

Using explain to analyze SQL statements is to optimize SQL and index problems. For a real enterprise-level project, the SQL statements may reach tens of thousands, so we cannot explain and analyze them one by one. Where can we get those long-running, performance-consuming SQL? ?
We can open the slow query log:
Estimate a time limit (20ms, 100ms) based on the specific business and concurrency, and start the business after setting it. After the stress test, open the slow query log, and you will see the SQL that exceeds the execution time, and then use explain to analyze these time-consuming SQL statements.
The steps are as follows:
Open Slow query log switchslow_query_log
Set a reasonable slow query time limit that is acceptable to the business
Stress test execution Various businesses
Check the slow query log and find out all the SQL statements that take time to execute
Use explain to analyze these time-consuming SQL statements , thereby targeted optimization
MySQL can set up slow query logs. When the execution time of SQL exceeds the time we set, these SQLs will be recorded in the slow query log, and then We check the logs and use explain to analyze the execution plans of these SQLs to determine why the efficiency is low. Is it because the index is not used? Or is there something wrong with the creation of the index itself? Or the index is used, but because the amount of data in the table is too large, it takes a long time. At this time, we can divide the table into multiple small tables, etc.
The parameters related to the slow query log are as follows:
(Many global switches defined by MySQL are stored in global variables, which can be viewed with show/set variables Or set the value of global variables)

The slow query log switch is turned off by default
The path of the slow query log: the default is /var/lib/mysql/下
The slow query log records logs containing all SQL statements whose execution time exceeds the value set by the parameter long_query_time (unit: seconds). You can view it with the command on MySQL, as follows:
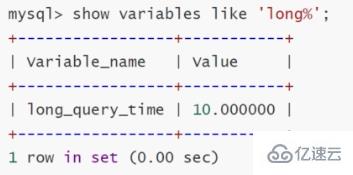
This value can be modified:


When the slow query log switch is turned on, an error message indicates that slow_query_log is a global variable (there are also variables that only affect the current session, such as: long_query_time, profiling ), the modification will affect all sessions, that is, all clients accessing the current MySQL server. 
Successfully turned on the slow query log switch!
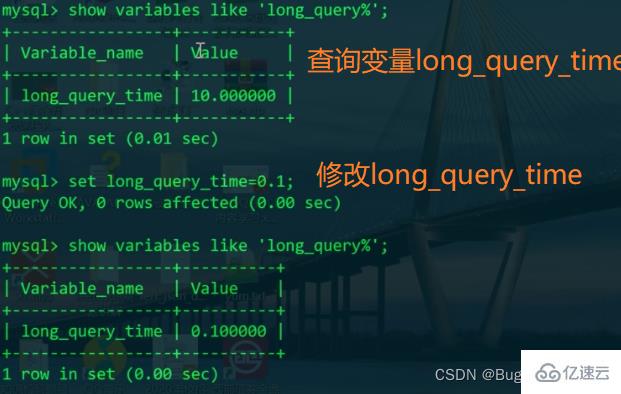
View another session
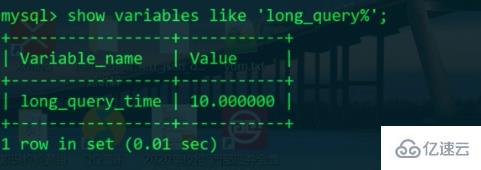
It was found that the default value is still 10s, so long_query_time only affects the current session

Already Exceeds the long_query_time=0.1s we set
Path: /var/lib/mysql/


Do Search the entire table and scan the entire primary key index tree.
We should add an index to the password, and then remember that the password is in string format, because if type conversion is involved, the index cannot be used
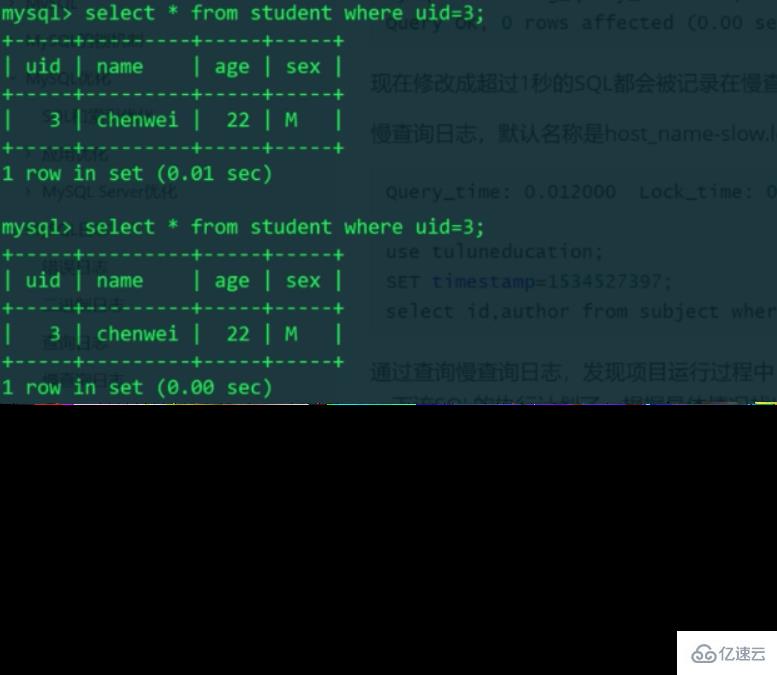
MySQL generally only displays the time to two decimal places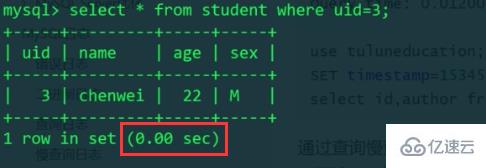
Turn on the profiling switch to display more detailed time
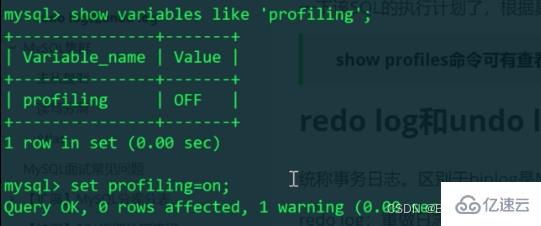
No error is reported, indicating that the profiling variable only affects the current session
The above is the detailed content of MySQL slow log query example analysis. For more information, please follow other related articles on the PHP Chinese website!


