

The practice of graph algorithm in Alibaba risk control system


1. Introduction to graph algorithms in e-commerce risk control scenarios
First, briefly outline the risks of Alibaba e-commerce Characteristics, application history and current status of graph algorithms.
1. Alibaba e-commerce risk characteristics
The main characteristics of Alibaba e-commerce risks: confrontation & permutations formula complexity.
# Risks must be confrontational, and the risks of Alibaba e-commerce are also complex in permutations and combinations. Risk identification mainly uses X (data) to predict Y (risk): P(Y|X). In Alibaba e-commerce , Tmall, 1688, Lazada, etc. The risk characteristics of different markets are different;
② Diverse business scenarios - accounts, products, promotions, etc., and With the iteration and innovation of business, new risks will arise;
③ Diverse application terminals - PC, H5, APP, etc., each terminal needs Do prevention and control;
#④ Diverse data sources require the ability to process and integrate data in different modalities.
##At the same time, Y is also very complicated, mainly reflected in three aspects. The first is the type of risk. Many, common content risks, behavioral risks, etc. are just a drop in the ocean of many risks; second, these risks are related, such as seller fraud is related to registration, theft, and product content; third, risks will transfer. One type of risk is better prevented, but the cost of committing a crime is high, and then it is transferred to other risks or creates new risks.
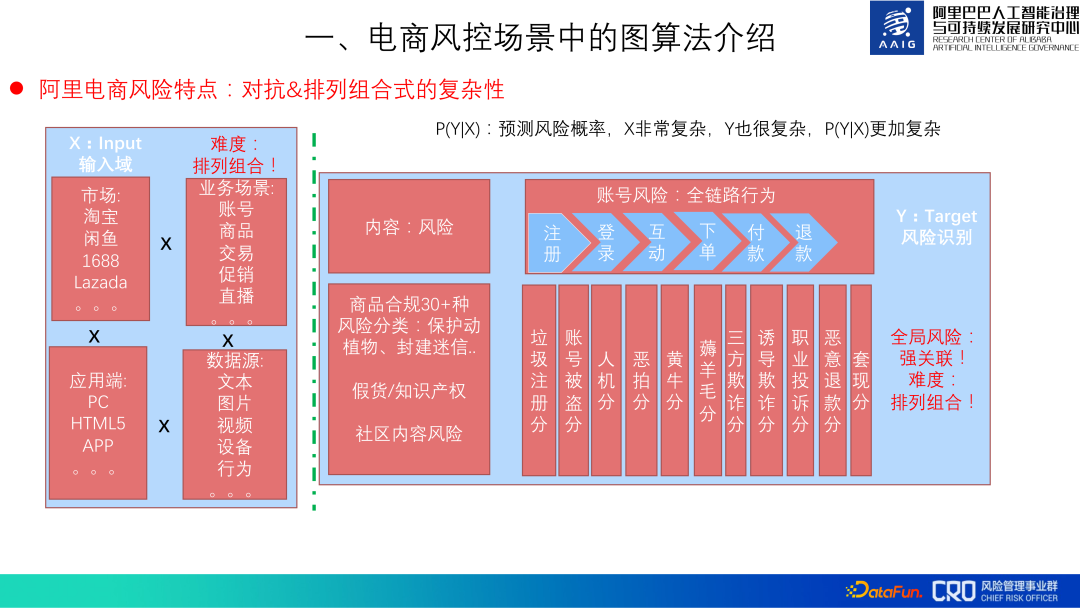
#So the entire risk prevention and control is very complicated, with permutations and combinations of complexity.
2. The importance of graph algorithms
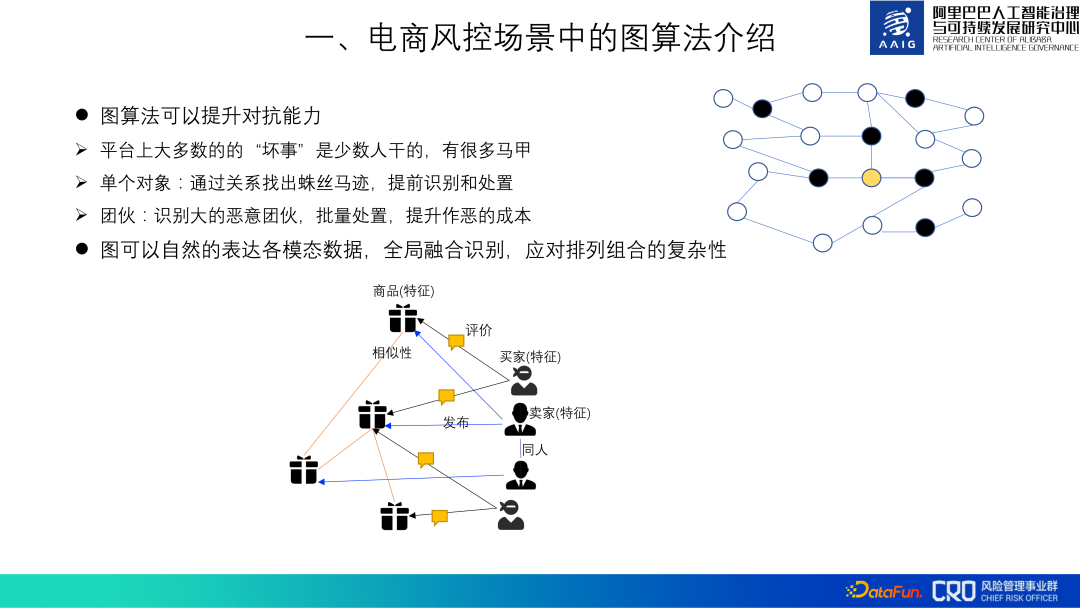
Graph algorithms can improve the confrontation ability of risk identification models. Most of the "bad things" on the platform are only done by a few people. The "bad guys" have many vests. We can find out the clues through "relationships" and identify and deal with them in advance. For example, the yellow dot in the picture below, assuming it is a user with abnormal behavior, it is difficult to judge that he is a fraudulent user based on his own behavior alone, but it can be analyzed by analyzing the other three fraudulent users associated with him (black dots) to determine that he is a fraudulent user. At the same time, we found all the accounts that were closely related to these four accounts and found that they were part of a gang. Dealing with these accounts in batches in advance can increase the cost of committing evil.
In addition, the heterogeneous graph can naturally and globally integrate various modalities and risk objects Data, calculate the representation of different objects, and then identify different risks to deal with the complexity of permutations and combinations
3. The history and current situation of graph algorithms
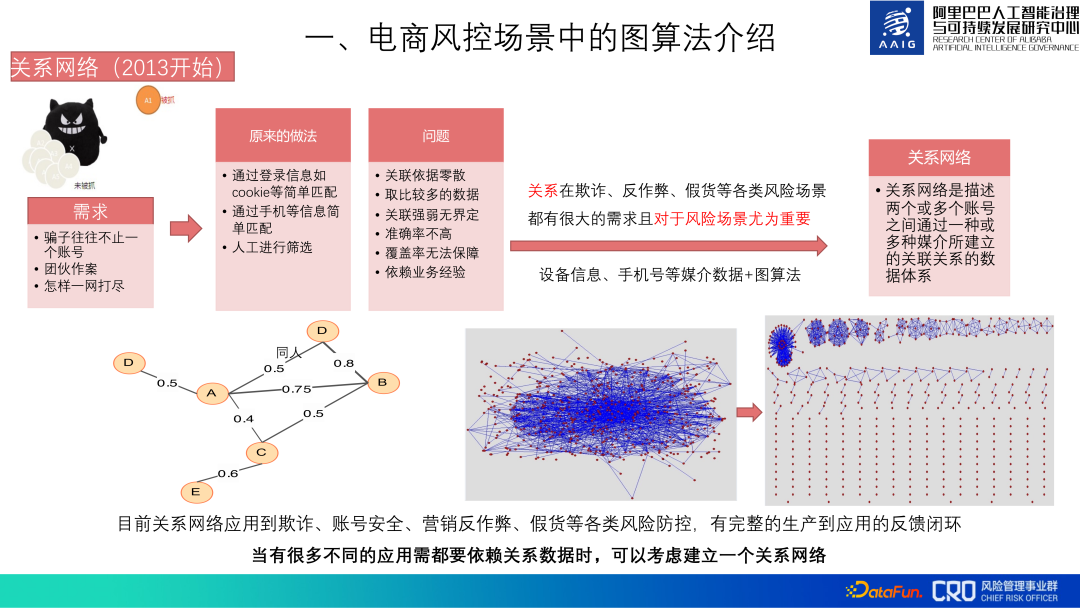
Based on the importance of graph algorithms, Alibaba e-commerce risk control has been using graph algorithms since 2013.#Initially graph algorithm was used to build the relationship network of the entire account database. This relational data is the basic data required for all risk prevention and control scenarios such as fraud, account security, anti-cheating, and counterfeit goods. The main data used includes media data such as device information and mobile phone numbers. It mainly describes the correlation between accounts, relationship types, group identification, etc. A closed-loop feedback channel from production to application has been established for this relationship network.
There is a lot of underlying relational data. The overall cost of aggregation, cleaning, graph calculation and storage of relational data is very high, and it must be continuously updated later, so building relationships The cost of the network is high, but because many of our risk models and strategies rely on this relationship network, it is still worth it.
## As for graph neural networks, we began to explore applications in 2016. At that time We were also called GGL (Geometric Graph Learning). At that time, there was no directly available graph neural network algorithm framework, so we implemented a GGL algorithm framework in C. In 2018, it was moved to Graph learn provided by Alibaba Computing Platform. This framework is also open source. We also contributed some graph algorithm code to this framework.
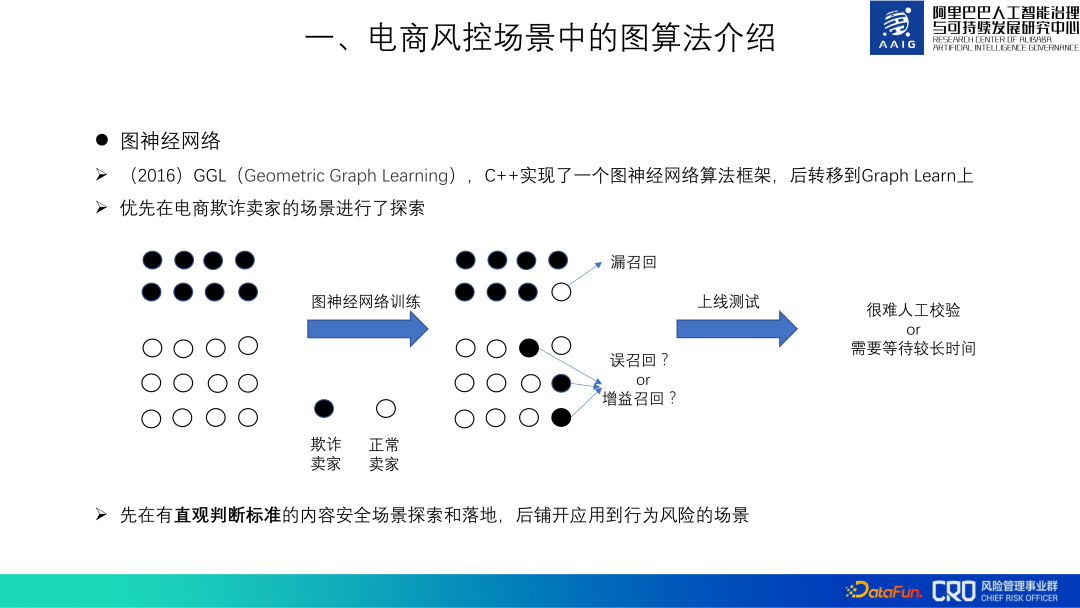
There are many e-commerce risk control scenarios, and it is also important to choose the appropriate scenario during the graph algorithm verification phase. Particularly important. The "judgment criteria" for behavioral risks, which account for a large proportion in risk scenarios, are not intuitive. In industrial scenarios, white samples of behavioral risks are mixed with many undiscovered black samples. When the graph algorithm judges the white samples as black samples, it is difficult to judge whether they are black samples or not. Whether it is false recall or gain recall, this will affect the tuning of the model and the judgment of the online effect. On the contrary, content security scenarios, such as spam and insults, are scenarios with "intuitive judgment criteria" and are more suitable for verifying the effectiveness of graph algorithms. Therefore, we first explore the algorithm in content security scenarios, verify its effectiveness and accumulate best practices, and then apply it to behavioral risk scenarios.
#So far, graph algorithms are used in various risk businesses of Alibaba e-commerce. The entire graph algorithm application framework is as shown below. First, a relational data layer is maintained at the bottom to collect and clean various relational data to facilitate the application of the upper layer. On top of the data layer, commonly used graph algorithms are precipitated; the next layer uses the relational data layer. and algorithm layer to build an account relationship network, which horizontally supports the prevention and control of various risk scenarios in the business layer; at the top business layer, combined with the characteristics of specific risks, we use these graph algorithms and relational data to build a graph model to identify various business risks.
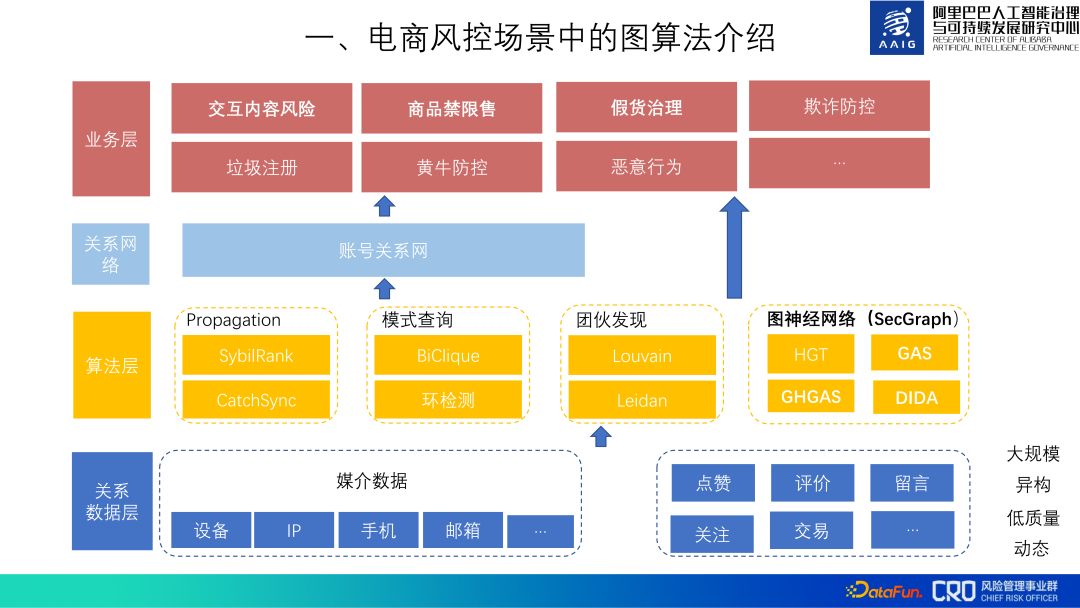
The following sharing will mainly introduce "interactive content risks", "commodity prohibition and restriction", "fake goods" Some graph algorithms applied to these three types of risks: "Governance".
2. Graph algorithm for interactive content risk control
Alibaba e-commerce platform has rich interactive content scenarios. Such as product evaluation, comments, asking everyone, as well as mobile Taobao shopping, Xianyu community, etc. The following uses the identification of spam advertisements in Xianyu messages as an example to introduce the content risk control graph algorithm.
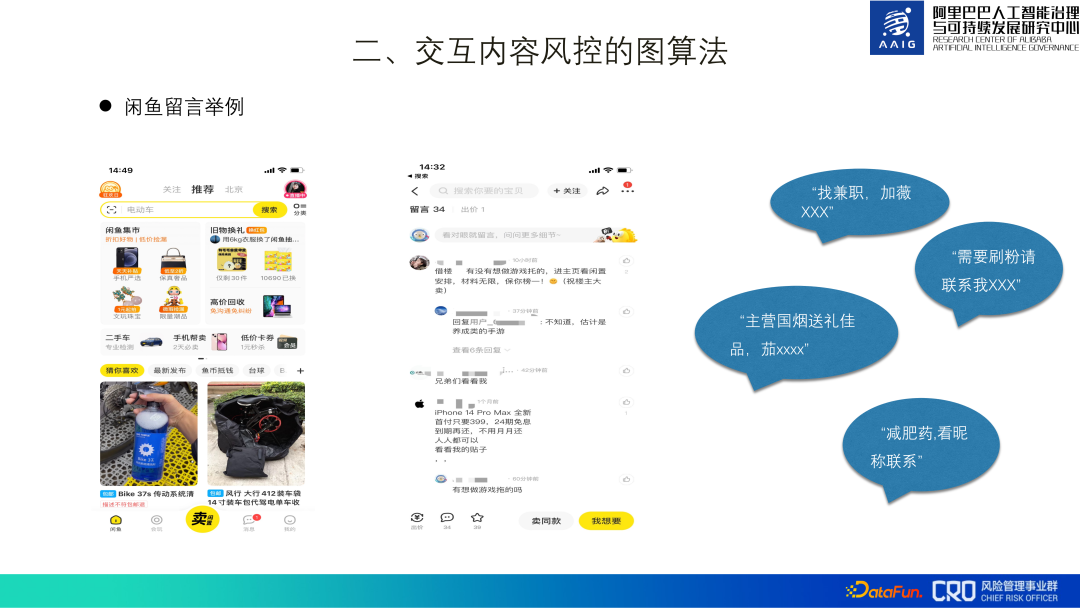
It is easy to see “spam advertisements” in the product comments in the Xianyu APP Content risks such as part-time jobs, fake orders, selling weight loss pills, etc., and are highly confrontational. For example, in the screenshot above, "Brother, look at me," the real advertisement is not in the text itself, but on the user's homepage.
The spam advertisement identification of Xianyu messages is the first application scenario of our graph neural network algorithm. We call this identification model GAS for short. The entire model consists of a heterogeneous graph and a homogeneous graph. The heterogeneous graph learns the local representation of each node, including products, comments, and users. The homogeneous graph is a comment graph that learns the global representation of different comments. Finally, these four representations are fused together for binary classification model training.
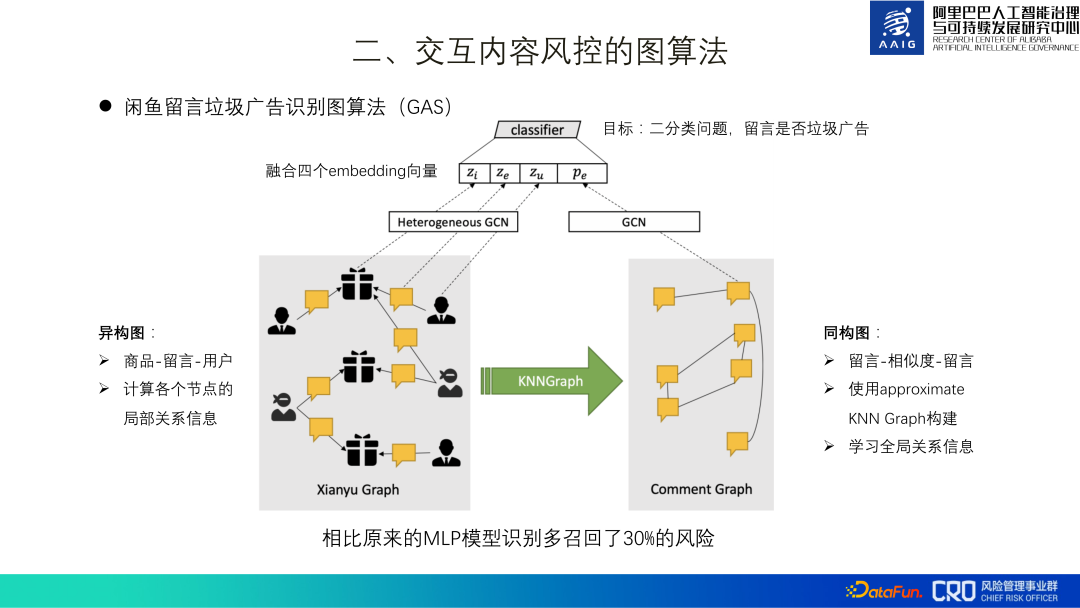
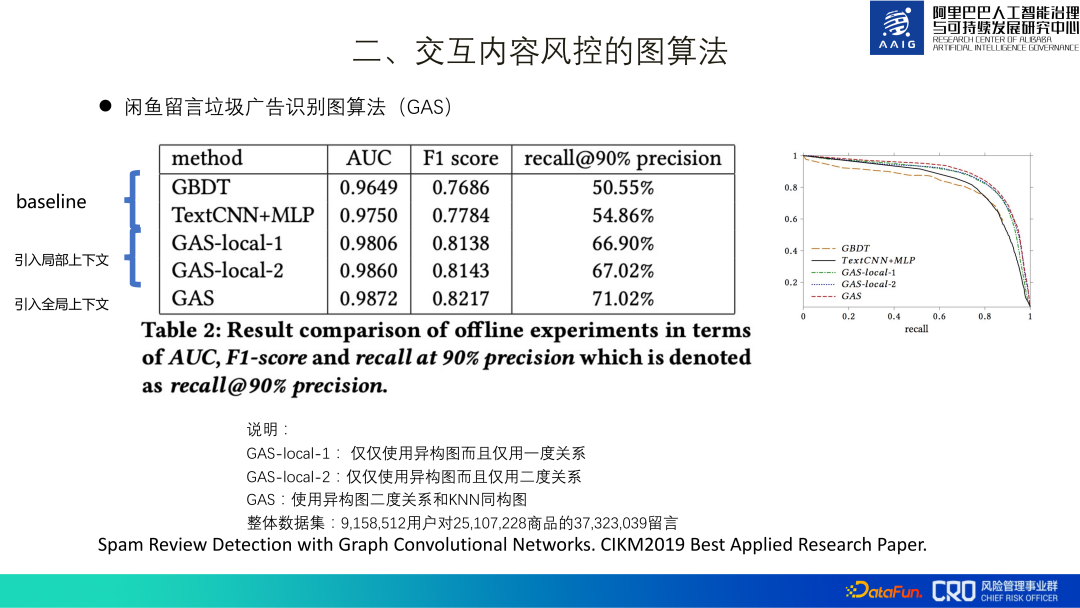
The overall training data set includes 3kw messages, 2kw products, and 9 million users. After going online, it recalled 30% more risks than the original MLP model. In addition, ablation experiments have also confirmed that adding global information is also significantly improved. This is due to the characteristics of spam advertising itself - it requires a large number of forwardings to achieve better benefits. This work was finally compiled and published in paper[1], and won the Best Applied Research Paper of CIKM2019.
3. Graphic algorithm for product content risk control
Here we mainly introduce two types of graph algorithms for product content risk control: one is product graph structure learning, and the other is the integration of product graph structure and professional knowledge graph.
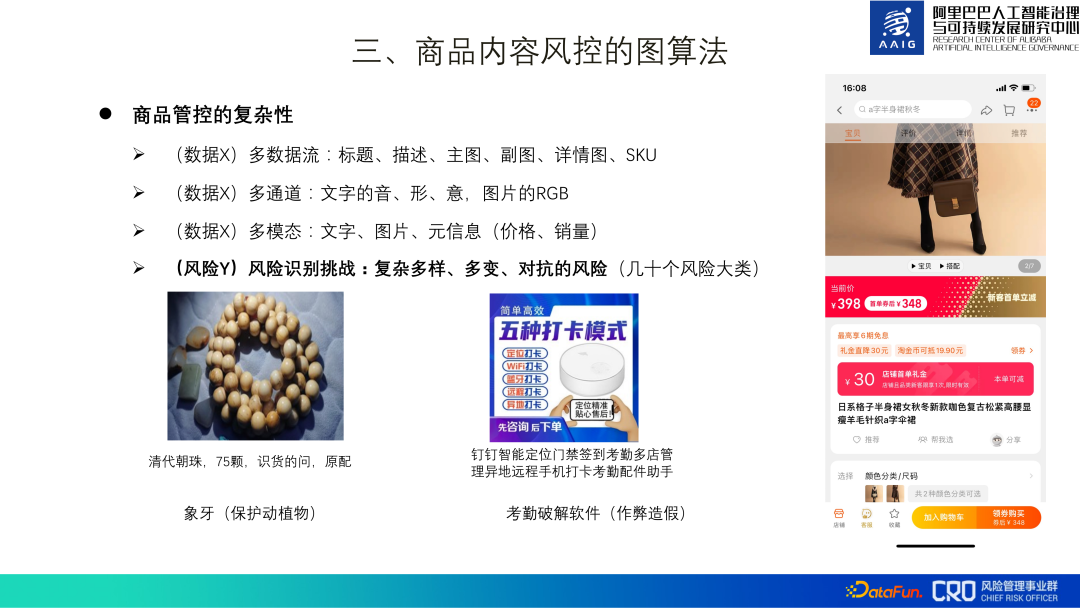
Commodity risk management is mainly to control the risk of "prohibited sales and restricted sales". Many types of commodities are prohibited by national laws and regulations. For sale, such as nationally protected animals and plants, cheating and counterfeiting, controlled medical devices, etc.
The management and control of commodities is very complex, and commodity data is multi-data stream, multi-channel, and multi-modal:
① Multiple data streams: Title, description, main image, secondary image, detail image, SKU;
② Multi-channel: The sound, shape and meaning of the text, the RGB of the picture;
③ Multi-modal: Text, pictures, meta information (price, sales).
#At the same time, the product content risks are also complex, diverse, and fiercely contested. For example, in the picture above, it looks like you are selling beads, but in fact you are selling ivory.
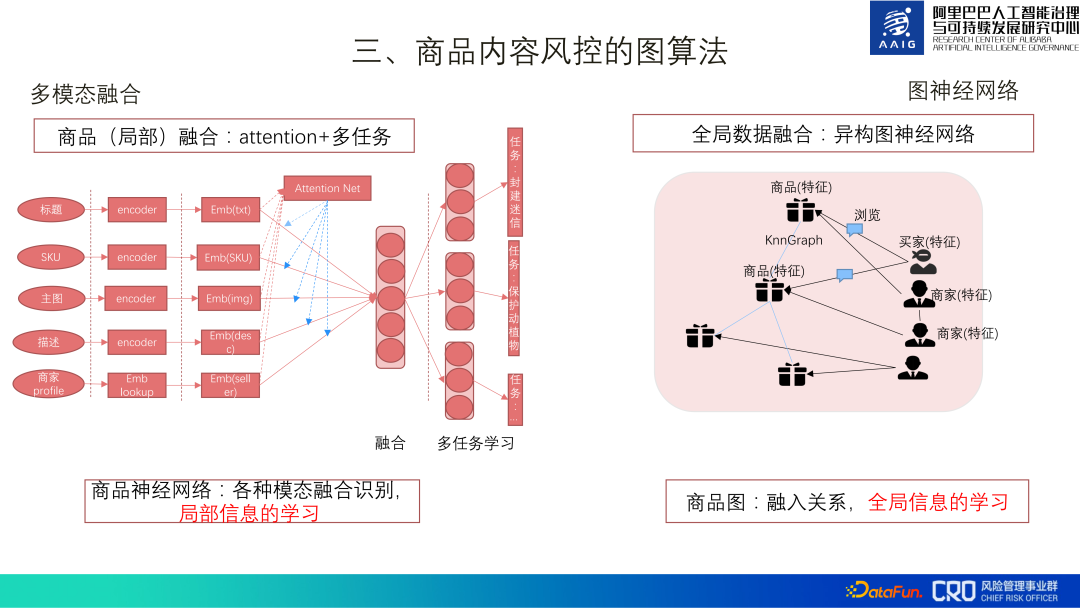
There are two main types of product content risk control map algorithms: one is a multi-modal fusion model, which uses a deep model to build a product neural network. Multi-modal fusion carries out multi-task learning, which is the learning of local information of goods; the other is to improve the recall of risks, using heterogeneous graphs to establish the relationship between goods and goods, goods and sellers, sellers and sellers , conduct fusion learning of global information.
1. Graph structure learning for product graphs
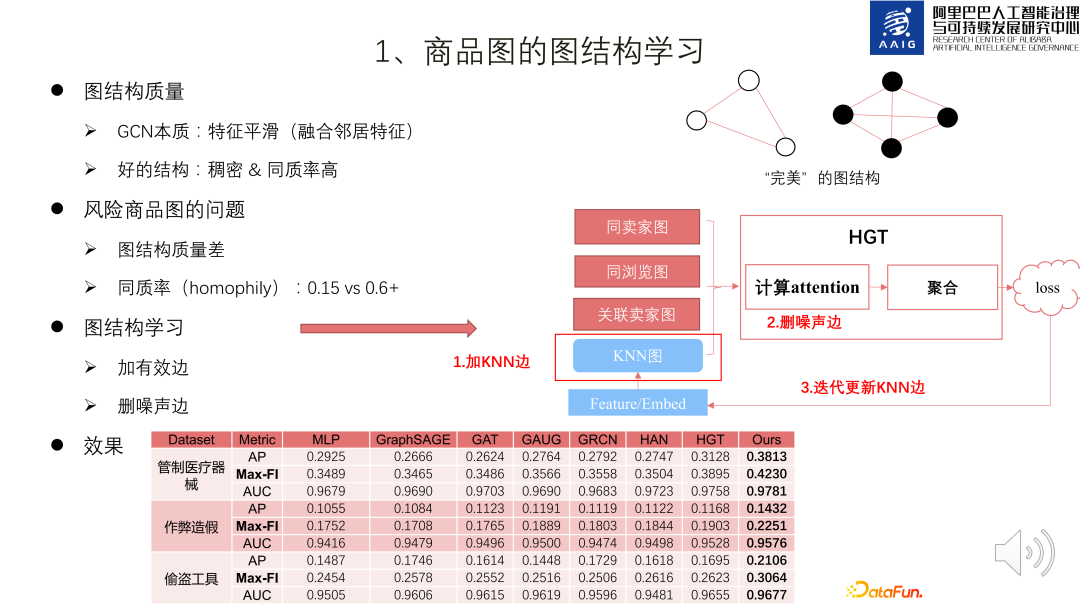
The essence of GCN is feature smoothing that fuses neighbor features, so The learning of graph neural networks has certain requirements on the quality of the graph structure. A good network graph is dense and has a high homogeneity rate. However, the risk product graph is sparse and the homogeneity rate is relatively low (0.15, and statistics on public data sets have found that 0.6 or above is better), so we must learn the graph structure.
There are three kinds of edges in the product graph, which constitute three kinds of graphs, as shown in the frame on the right side of the figure below: One type is The two products are sold by the same seller and have the same seller image. The second category is the same browse image where the two products have been viewed by the same consumer. The third category is the associated seller image where the sellers of the two products are strongly related.
The essence of product graph structure learning is the process of adding and deleting edges: first, use KNN Graph to build a KNN graph based on the product embedding, and then put the above four types of edges together with the product embedding. HGT learns new product embeddings and deletes edges with lower attention values as noise. The new product embeddings can be used to update the KNN Graph, and iterate back and forth until the loss converges. Practice in real data shows that this graph structure learning framework achieves SOTA results compared to homogeneous graphs/heterogeneous graphs.
2. Integration of graph computing and risk knowledge graph
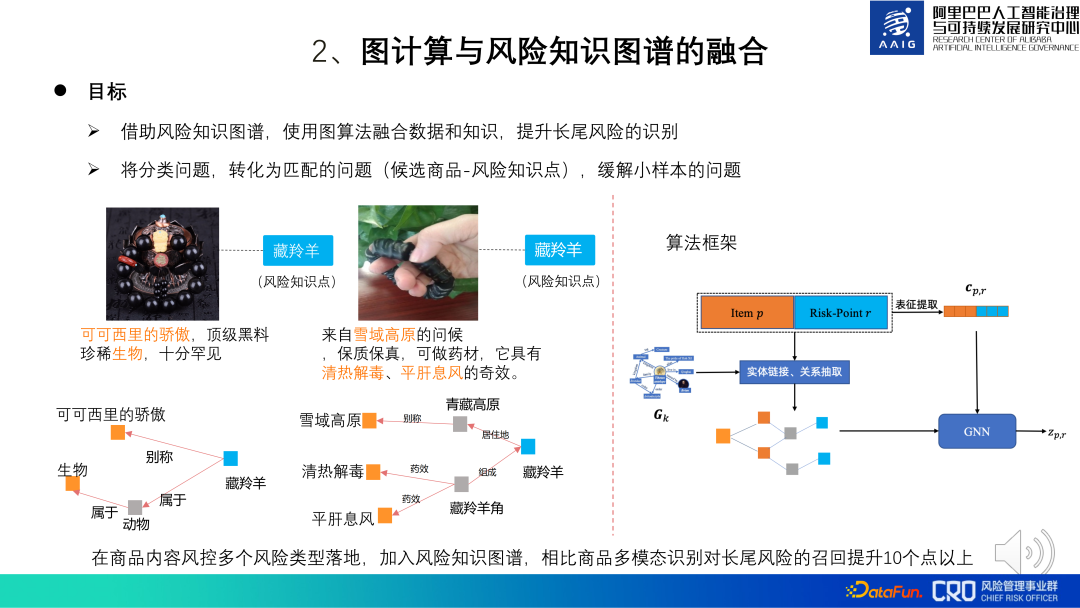
The improvement algorithm of the commodity graph algorithm is the fusion of graph computing and risk knowledge graph. Some commodity risks are difficult to judge through common sense and require a combination of certain professional domain knowledge. Therefore, specific knowledge graphs were constructed for these specific risk domain knowledge points to assist model identification and manual review.
For example, the two products shown on the left side of the picture below appear to be selling simple accessories, but they are actually selling Tibetan antelope horns, and Tibetan antelope is the national It is a first-level protected animal and its related products are banned. We can identify the risk of this product by matching it with the knowledge related to Tibetan antelope. The fusion algorithm framework is shown on the right side of the figure below: the model goal is to determine whether candidate products and risk knowledge points match. Item p is the graphic representation of the product, and Risk-Point R is the representation of the knowledge point. Through entity recognition, entity linking and relationship extraction, the subgraph of the product and the knowledge point is obtained, and then GNN is used to calculate the representation of the subgraph, and finally the representation is used Carry out risk classification and identification. Among them, CPR is a fusion of product representation and knowledge point representation. It is mainly used to guide graph representation to learn some global information. Practice shows that compared with product multi-modal recognition, the recall of long-tail risks is improved by more than 10 points by adding risk knowledge graphs.
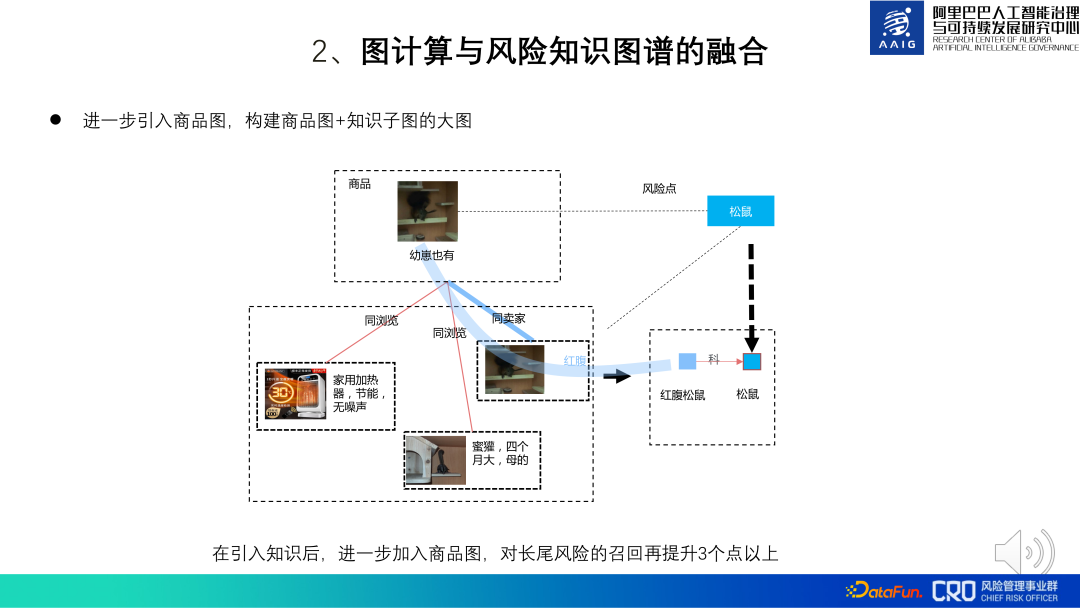
On this basis, we also tried to introduce a global product map. When the product content is directly related to the knowledge map and the risk cannot be identified, you can further introduce the association between the product and the product to assist in judgment. For example, in the picture below, a product marked "There are also cubs" and "red-bellied squirrel" have no strong knowledge. There is a matching relationship, but this product matches the seller's knowledge of another product "red-bellied" and "red-bellied squirrel", so it can be inferred that the product actually sells red-bellied squirrels (secondary protected animals, prohibited for sale). Practice has shown that introducing the entire large product graph when doing knowledge reasoning can increase long-tail risk recall by more than 3%.
4. Risk control practice of dynamic heterogeneous graphs
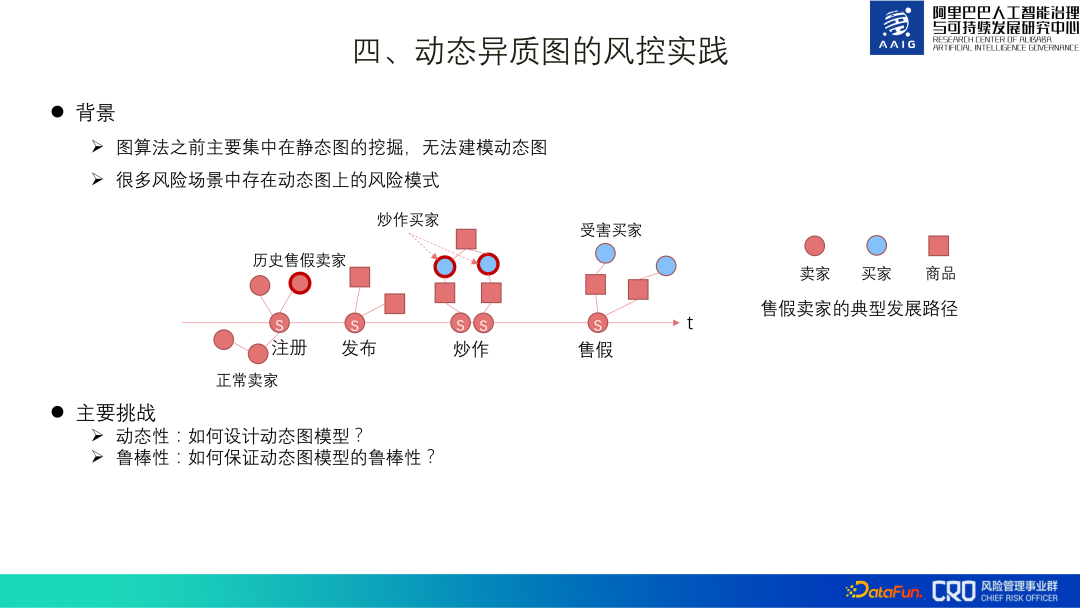
Before The graph algorithms introduced are mainly static graph mining applications, but many risk scenarios have dynamic graph risk patterns.
For example, a merchant selling counterfeit goods first registers, then releases a large number of products in batches, hypes up to attract traffic, and then quickly sells counterfeit goods. In this series of actions, the time dimension is Changes in graph structure are very important to our risk identification, so dynamic graphs are also a key direction in the exploration and application of graph algorithms.
#The biggest challenge of dynamic graphs is how to design and search for a good graph structure. On the one hand, dynamic graphs introduce a time dimension based on the original heterogeneous graph. For example, if there are 30 moments, then the parameters (information amount) of the dynamic graph are 30 times that of the heterogeneous graph, which brings great pressure to learning; On the other hand, due to the adversarial nature of risks, dynamic graphs need to be highly robust.
1. Automatic learning of dynamic graphs
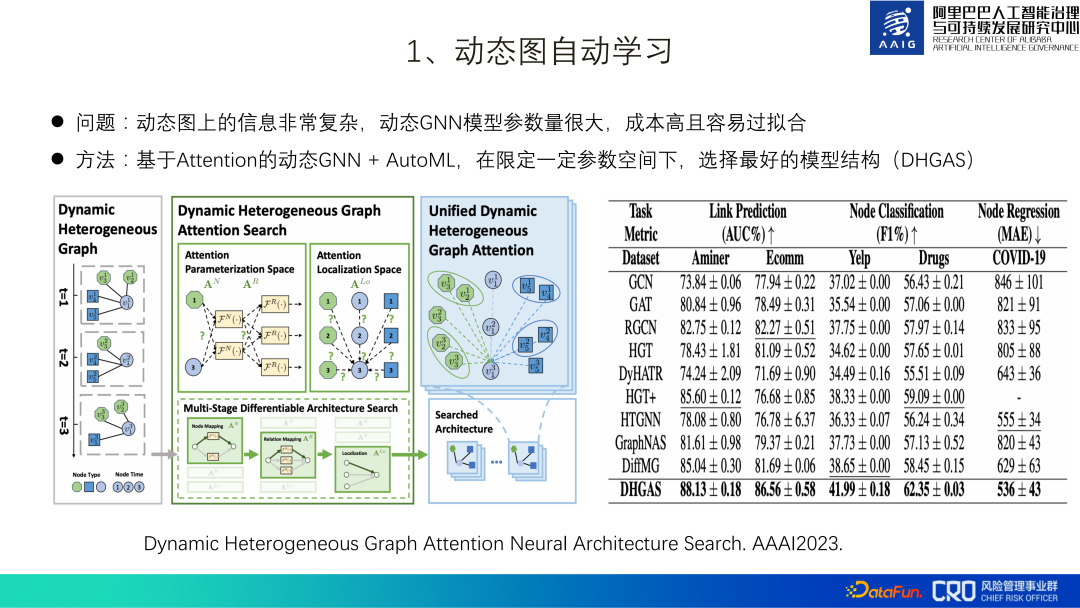
According to this, we proposed a dynamic GNN based on Attention AutoML selects the best model structure (DHGAS) under a certain parameter space. The core of this model is to optimize the model structure through automatic learning, as shown in the figure below: It is first preferred to decompose the dynamic graph into heterogeneous graphs at different moments, and set different function spaces at different moments and different nodes to represent changes in product representation. Space (N*T types, N: node type; T: time space), different function spaces are also set up for different moments and different edge types to represent the path space of information propagation (R*T types, R: edge type; T : time and space), and finally there are R*T*T aggregation methods when nodes and neighbors are aggregated (the two T are the timestamps of the nodes at both ends of the edge.
Obviously the entire search space is huge. We try to limit the parameter space and use automatic machine learning technology to build a supernet so that the model can automatically search for the optimal network architecture. Specific method: limit the number of function spaces of N*T to K_N, the function space data of R*T to K_R, and the module length of R*T*T to K_Lo. For example, N=6, T=30, the theory is N*T=180 function space, the actual limit is K_N=10.
This algorithm has currently been implemented in scenarios such as "identification of fake sellers" and "identification of malicious merchants with restricted sales of goods", and compared with the mainstream algorithms in the industry, it has obtained SOTA results. For details, you can check the paper [ 2].
2. Dynamic graph robust learning
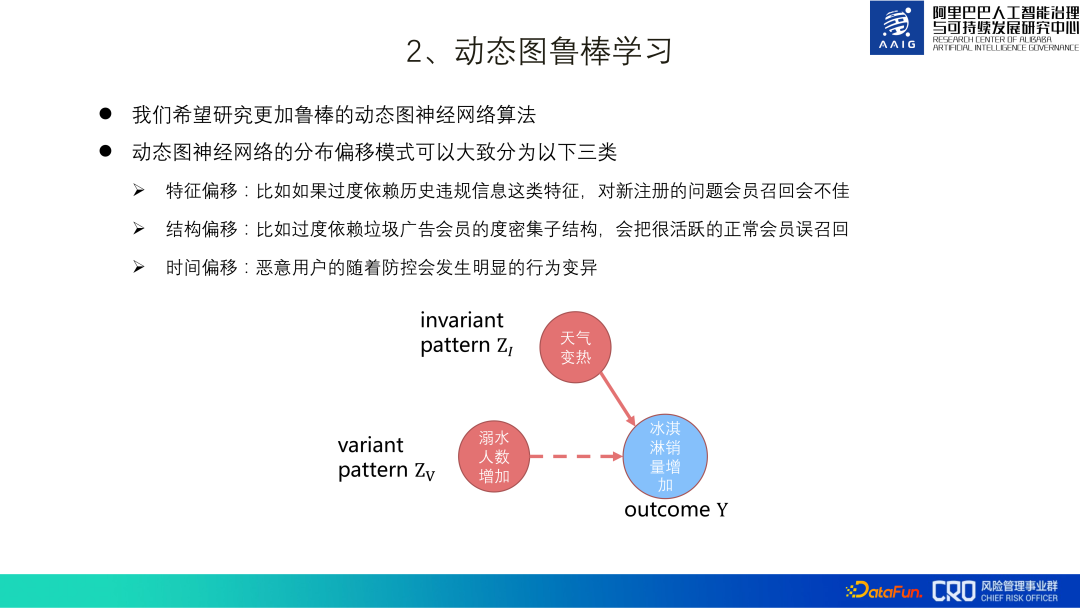
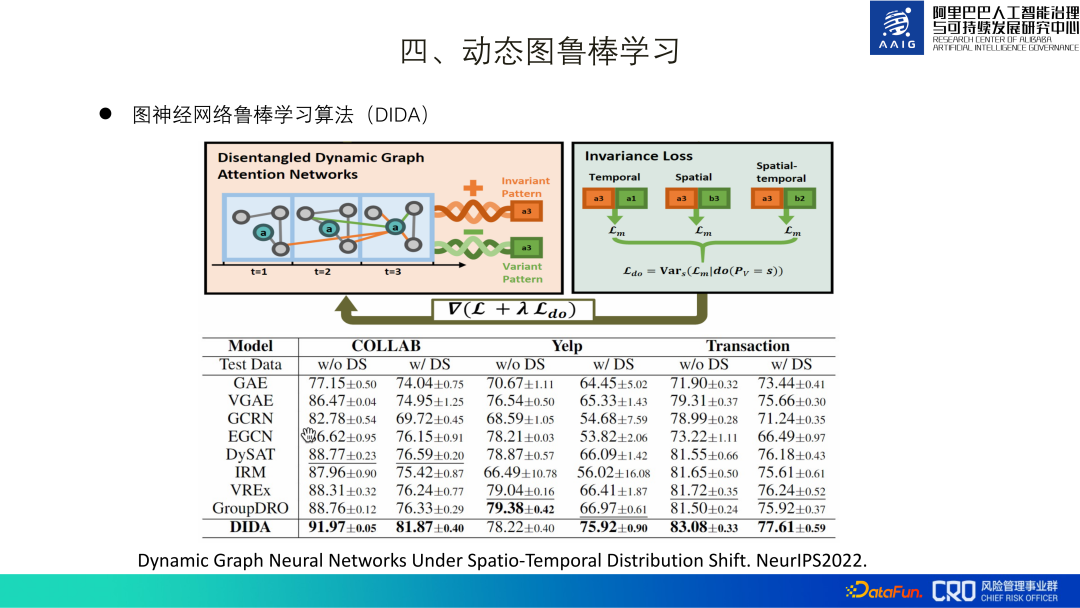
due to risk confrontation nature, dynamic graphics need to be strong in robustness, and its essence isI hope that dynamic graphics can learn some essential patterns, for example, the essential pattern of the example subgraph in the figure below is that the increase in ice cream sales is due to the weather It's getting hotter, not more drownings.
We hope that robust learning can solve some distribution shift problems in e-commerce risk control dynamic graphs:
(1) Feature offset: For example, if you rely too much on features such as historical violation information, the recall of newly registered problematic members will be poor;
(2) Structural offset #: For example, over-reliance on the degree-dense substructure of spam advertising members will cause very active Normal members are mistakenly recalled;
(3) Time offset: Malicious users will follow the prevention and control process Significant behavioral changes occur.
In this regard, we proposed an algorithm DIDA. The core idea is as shown in the figure below: learn two patterns when learning dynamic graphs-orange The essential pattern represented by green and the non-essential pattern represented by green are used. Only the loss (L) of the essential pattern and the loss variance (Ldo) of the combination of non-essential patterns are used as the final loss learned by the model. The design idea of the loss variance (Ldo) of the combination of non-essential patterns is: assuming that the green a3 in the picture is a non-essential pattern, then replacing this green a3 with other non-essential patterns such as b3, c3, etc. should improve the loss (discrimination) of the model. ability) has little impact. Therefore, we can add the loss variance of non-essential patterns to model learning, and in the final prediction stage, only the essential patterns are used for classification. At present, this algorithm has been implemented in product content risk control scenarios, and a paper[3] has also been compiled.
 ##5. ICDM2022 Competition: Risky Product Detection on Large-scale E-commerce Maps
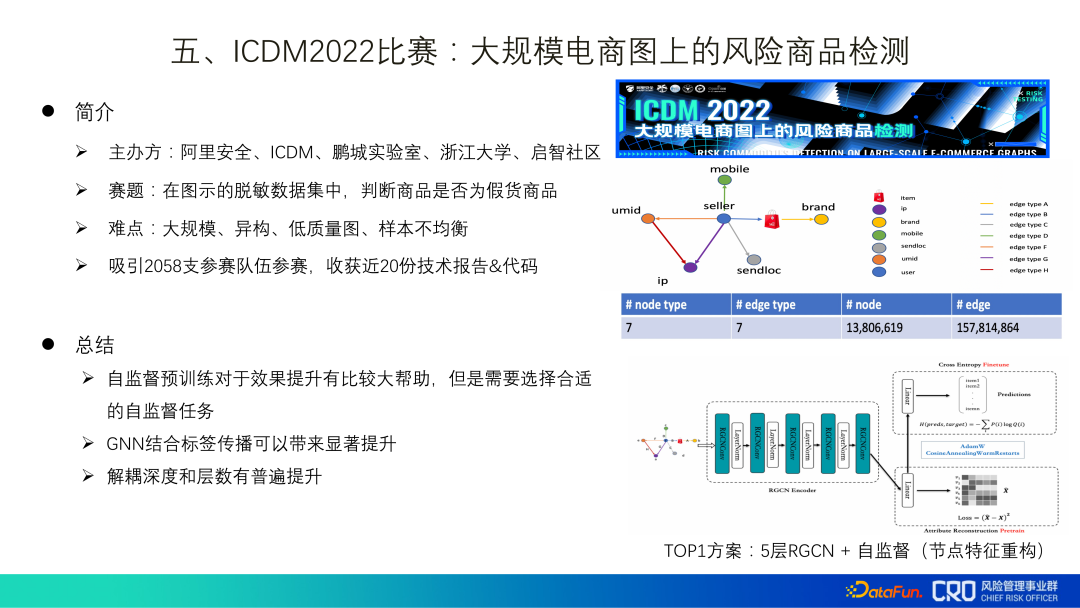
"ICDM2022 Competition: Risky Product Detection on Large-scale E-commerce Graphs" is an algorithm competition we hosted this year, and the data provided is desensitized data from real scenarios. Finally, I also gained some inspiration from the submitted technical codes and reports:
(1) Self-supervised pre-training is of great help to improve the effect, but it needs Choose an appropriate self-supervised task;
(2) GNN combined with label propagation can bring significant improvements. In previous graph algorithm applications, due to concerns about label leakage, This part of the data was discarded, but it was not obvious after practice on real data. The guess is that the current graph network only achieves information fusion, but has not yet achieved reasoning or has weak reasoning capabilities;
(3) Decoupling depth and layers The number has been generally improved, and it can be propagated once and aggregated several times at the same time.
6. Summary and outlook on the implementation of graph algorithms
Combined with our experience, The following graph algorithm implementation methods are summarized:
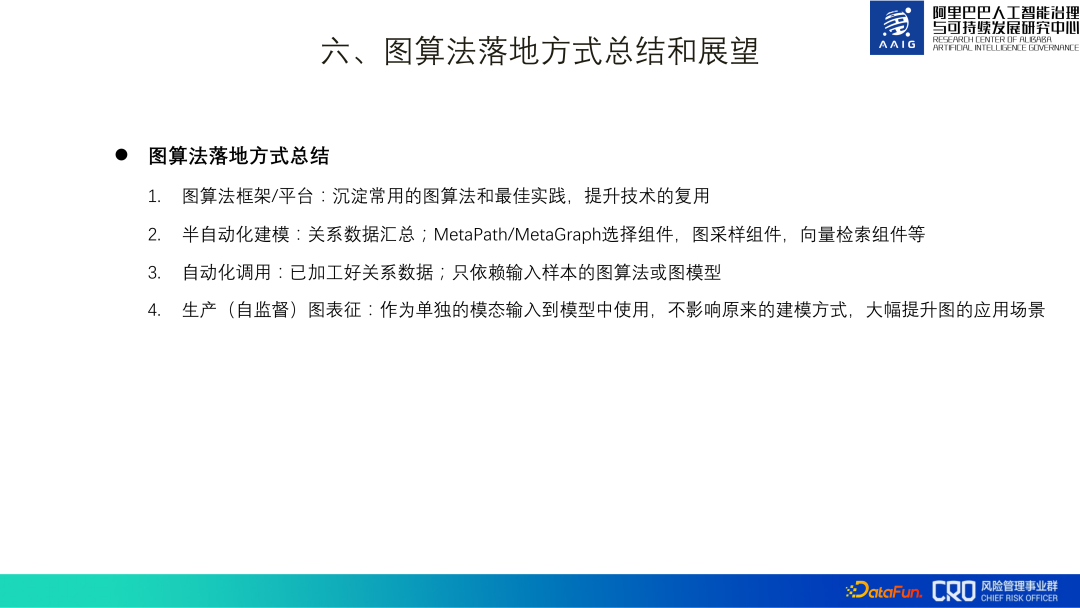
# (1) Graph algorithm framework/platform: There should be a graph algorithm framework to accumulate technology and best practices and improve technology reusability.
(2) Semi-automated modeling: In order to improve the efficiency of modeling, at the data level it is best to clean and summarize the underlying relational media data , some components (MetaPath/MetaGraph selection components, graph sampling components, vector retrieval components, etc.) can be provided at the modeling level to improve modeling efficiency.
# (3) Automated calling: Graph algorithms or graph models that only rely on input samples can be automatically called. There is no need to understand the graph model, which is convenient for others who are not familiar with graph algorithms. Risk control students carry out model optimization and use, such as gang identification, product recovery, risky user recovery, etc.
(4) Production (self-supervised) graph representation: used as a separate modal input into the model, without affecting the original modeling method, greatly improved Figure application scenarios.
Follow-up work outlook:
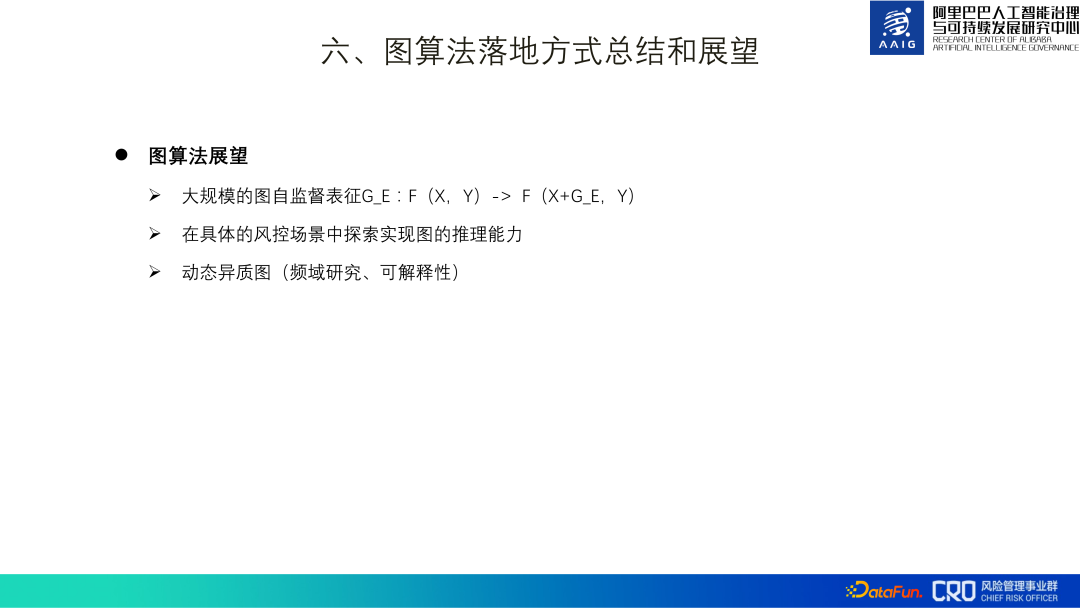
( 1) Large-scale graph self-supervised representation learning. We have thousands of risk models, many of which do not apply the above graph algorithm, so our next step is to do large-scale graph self-supervised representation to expand the application scope of graph features and help improve business results. This work has dual challenges in engineering and algorithms: Firstly, in terms of engineering, we have at least billions of nodes and tens of billions of edges for large-scale learning. Secondly, in terms of algorithms, graph representation must not only cover commonly used relationship representations, You also need to learn the characteristics of higher-order graph structures, which are highly versatile and can be applied to various scenarios.
# (2) Explore the reasoning capabilities of graphs in specific risk control scenarios. At present, graph algorithms are more about the fusion of knowledge, and the reasoning capabilities are relatively weak. , unable to cope with the high antagonism of risks. Objectively we need our model to have strong intelligence, so the reasoning ability of graphs is very important. Currently, we plan to rely on the rich interactive scenarios and content of the Xianyu community to explore the algorithm.
# (3) More exploration and implementation in frequency domain research and interpretability of dynamic heterogeneous graphs. The purpose of frequency domain research is to learn more details of graph structure changes in dynamic graphs. Interpretability helps us understand whether the algorithm has truly learned the essential characteristics. On the one hand, it helps us improve the algorithm, and on the other hand, it can also be better provided to business students for application implementation.
We are also seeking academic cooperation in the above exploration directions, especially in the direction of graph reasoning. At the same time, we are also recruiting students for graph algorithms. Interested students can contact me.
7. Reference
1. Spam Review Detection with Graph Convolutional Networks. CIKM2019 Best Applied Research Paper.
2. Dynamic Heterogeneous Graph Attention Neural Architecture Search. AAAI2023.
3. Dynamic Graph Neural Networks Under Spatio-Temporal Distribution Shift. NeurIPS2022.
8. Question and Answer Session
Q1: What are the special challenges of graph representation of risk control scenarios, compared with graph representation in other fields?
A1: The three main challenges: first, the graph structure is poor and the homogeneity rate is low; second, the robustness of the graph, in our scenario Especially for dynamic graphs, its distribution drift is still very serious. There is another problem. The risk concentration of black samples is very low. It does not mean 1:10 or 1:20. There are some risks in our graph algorithm. The concentration is above 1:1w, so our sample is extremely and extremely unbalanced, which is what we need to solve.
Q2: What is the current algorithm model of graph federated learning? Is there a mature solution in the industry? Do you have any applications or considerations for graph federated learning?
A2: We currently mainly use it in our e-commerce scenarios. Of course we also have some non-e-commerce businesses, but these data are our own data and we still It can be used directly for risk control, so federated learning has not been used yet, but it will still be necessary to use graph federated learning later, because data is currently being cut and isolated for information security, and data from different domains cannot be connected and used. , so graph federated learning should become an application direction for us to explore later.
The above is the detailed content of The practice of graph algorithm in Alibaba risk control system. For more information, please follow other related articles on the PHP Chinese website!

Hot AI Tools

Undresser.AI Undress
AI-powered app for creating realistic nude photos

AI Clothes Remover
Online AI tool for removing clothes from photos.

Undress AI Tool
Undress images for free

Clothoff.io
AI clothes remover

AI Hentai Generator
Generate AI Hentai for free.

Hot Article
Hot Tools

Notepad++7.3.1
Easy-to-use and free code editor

SublimeText3 Chinese version
Chinese version, very easy to use

Zend Studio 13.0.1
Powerful PHP integrated development environment

Dreamweaver CS6
Visual web development tools

SublimeText3 Mac version
God-level code editing software (SublimeText3)
Hot Topics
 1377
1377
 52
52

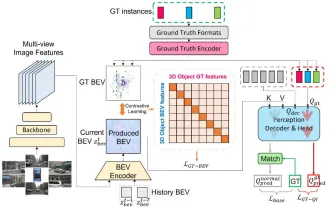 CLIP-BEVFormer: Explicitly supervise the BEVFormer structure to improve long-tail detection performance
Mar 26, 2024 pm 12:41 PM
CLIP-BEVFormer: Explicitly supervise the BEVFormer structure to improve long-tail detection performance
Mar 26, 2024 pm 12:41 PM
Written above & the author’s personal understanding: At present, in the entire autonomous driving system, the perception module plays a vital role. The autonomous vehicle driving on the road can only obtain accurate perception results through the perception module. The downstream regulation and control module in the autonomous driving system makes timely and correct judgments and behavioral decisions. Currently, cars with autonomous driving functions are usually equipped with a variety of data information sensors including surround-view camera sensors, lidar sensors, and millimeter-wave radar sensors to collect information in different modalities to achieve accurate perception tasks. The BEV perception algorithm based on pure vision is favored by the industry because of its low hardware cost and easy deployment, and its output results can be easily applied to various downstream tasks.
 Implementing Machine Learning Algorithms in C++: Common Challenges and Solutions
Jun 03, 2024 pm 01:25 PM
Implementing Machine Learning Algorithms in C++: Common Challenges and Solutions
Jun 03, 2024 pm 01:25 PM
Common challenges faced by machine learning algorithms in C++ include memory management, multi-threading, performance optimization, and maintainability. Solutions include using smart pointers, modern threading libraries, SIMD instructions and third-party libraries, as well as following coding style guidelines and using automation tools. Practical cases show how to use the Eigen library to implement linear regression algorithms, effectively manage memory and use high-performance matrix operations.
 Explore the underlying principles and algorithm selection of the C++sort function
Apr 02, 2024 pm 05:36 PM
Explore the underlying principles and algorithm selection of the C++sort function
Apr 02, 2024 pm 05:36 PM
The bottom layer of the C++sort function uses merge sort, its complexity is O(nlogn), and provides different sorting algorithm choices, including quick sort, heap sort and stable sort.
 Can artificial intelligence predict crime? Explore CrimeGPT's capabilities
Mar 22, 2024 pm 10:10 PM
Can artificial intelligence predict crime? Explore CrimeGPT's capabilities
Mar 22, 2024 pm 10:10 PM
The convergence of artificial intelligence (AI) and law enforcement opens up new possibilities for crime prevention and detection. The predictive capabilities of artificial intelligence are widely used in systems such as CrimeGPT (Crime Prediction Technology) to predict criminal activities. This article explores the potential of artificial intelligence in crime prediction, its current applications, the challenges it faces, and the possible ethical implications of the technology. Artificial Intelligence and Crime Prediction: The Basics CrimeGPT uses machine learning algorithms to analyze large data sets, identifying patterns that can predict where and when crimes are likely to occur. These data sets include historical crime statistics, demographic information, economic indicators, weather patterns, and more. By identifying trends that human analysts might miss, artificial intelligence can empower law enforcement agencies
 Improved detection algorithm: for target detection in high-resolution optical remote sensing images
Jun 06, 2024 pm 12:33 PM
Improved detection algorithm: for target detection in high-resolution optical remote sensing images
Jun 06, 2024 pm 12:33 PM
01 Outlook Summary Currently, it is difficult to achieve an appropriate balance between detection efficiency and detection results. We have developed an enhanced YOLOv5 algorithm for target detection in high-resolution optical remote sensing images, using multi-layer feature pyramids, multi-detection head strategies and hybrid attention modules to improve the effect of the target detection network in optical remote sensing images. According to the SIMD data set, the mAP of the new algorithm is 2.2% better than YOLOv5 and 8.48% better than YOLOX, achieving a better balance between detection results and speed. 02 Background & Motivation With the rapid development of remote sensing technology, high-resolution optical remote sensing images have been used to describe many objects on the earth’s surface, including aircraft, cars, buildings, etc. Object detection in the interpretation of remote sensing images
 Practice and reflections on Jiuzhang Yunji DataCanvas multi-modal large model platform
Oct 20, 2023 am 08:45 AM
Practice and reflections on Jiuzhang Yunji DataCanvas multi-modal large model platform
Oct 20, 2023 am 08:45 AM
1. The historical development of multi-modal large models. The photo above is the first artificial intelligence workshop held at Dartmouth College in the United States in 1956. This conference is also considered to have kicked off the development of artificial intelligence. Participants Mainly the pioneers of symbolic logic (except for the neurobiologist Peter Milner in the middle of the front row). However, this symbolic logic theory could not be realized for a long time, and even ushered in the first AI winter in the 1980s and 1990s. It was not until the recent implementation of large language models that we discovered that neural networks really carry this logical thinking. The work of neurobiologist Peter Milner inspired the subsequent development of artificial neural networks, and it was for this reason that he was invited to participate in this project.
 Application of algorithms in the construction of 58 portrait platform
May 09, 2024 am 09:01 AM
Application of algorithms in the construction of 58 portrait platform
May 09, 2024 am 09:01 AM
1. Background of the Construction of 58 Portraits Platform First of all, I would like to share with you the background of the construction of the 58 Portrait Platform. 1. The traditional thinking of the traditional profiling platform is no longer enough. Building a user profiling platform relies on data warehouse modeling capabilities to integrate data from multiple business lines to build accurate user portraits; it also requires data mining to understand user behavior, interests and needs, and provide algorithms. side capabilities; finally, it also needs to have data platform capabilities to efficiently store, query and share user profile data and provide profile services. The main difference between a self-built business profiling platform and a middle-office profiling platform is that the self-built profiling platform serves a single business line and can be customized on demand; the mid-office platform serves multiple business lines, has complex modeling, and provides more general capabilities. 2.58 User portraits of the background of Zhongtai portrait construction
 Add SOTA in real time and skyrocket! FastOcc: Faster inference and deployment-friendly Occ algorithm is here!
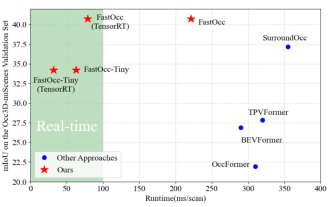
Mar 14, 2024 pm 11:50 PM
Add SOTA in real time and skyrocket! FastOcc: Faster inference and deployment-friendly Occ algorithm is here!
Mar 14, 2024 pm 11:50 PM
Written above & The author’s personal understanding is that in the autonomous driving system, the perception task is a crucial component of the entire autonomous driving system. The main goal of the perception task is to enable autonomous vehicles to understand and perceive surrounding environmental elements, such as vehicles driving on the road, pedestrians on the roadside, obstacles encountered during driving, traffic signs on the road, etc., thereby helping downstream modules Make correct and reasonable decisions and actions. A vehicle with self-driving capabilities is usually equipped with different types of information collection sensors, such as surround-view camera sensors, lidar sensors, millimeter-wave radar sensors, etc., to ensure that the self-driving vehicle can accurately perceive and understand surrounding environment elements. , enabling autonomous vehicles to make correct decisions during autonomous driving. Head
