How to perform CaptureFramework framework analysis
1. Background
Application service monitoring is an important part of the intelligent operation and maintenance system. In the UAV system, the middleware enhancement framework (MOF) probe provides application portrait and performance data collection functions. The data collection function mainly collects four types of data: real-time data, portrait data, call link data generation and thread data analysis data. . In order to achieve real-time data collection, UAVStack designed the CaptureFramework framework to provide unified data capture behavior and the ability to generate capture results.
2. CaptureFramework operating principle
2.1 Key technical description
JavaAssist
Monitor capture system
precap/docap
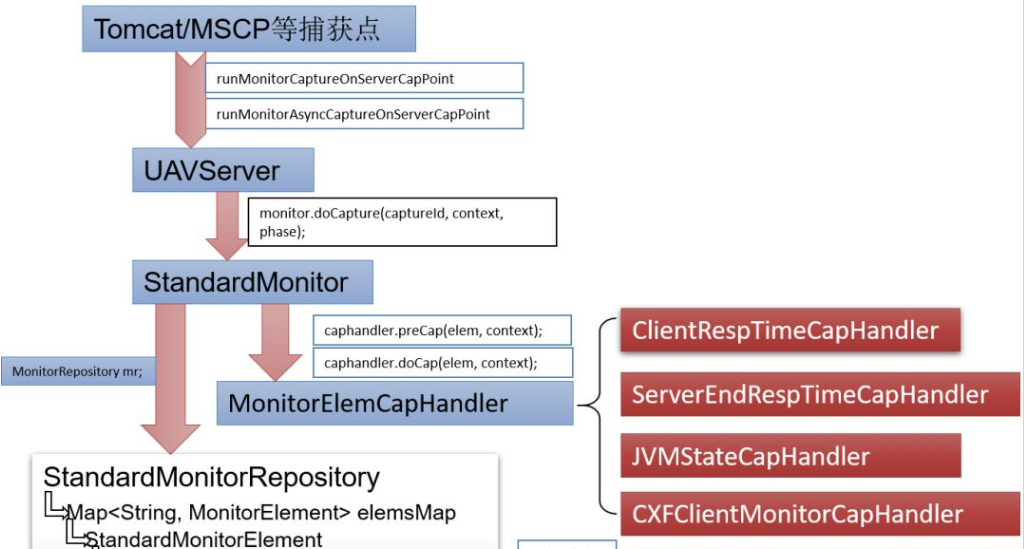
- Capture points: Supports Tomcat, MSCP, Springboot, and Jetty capture points.
- UAVServer singleton: As a unified capture entry point, it provides synchronous and asynchronous methods.
- StandardMonitor: It implements the Monitor interface and is a real-time data capture implementation class. It provides the doCapture method, which is responsible for the capture behavior and generating capture results.
- MonitorElemCapHandler: Different crawling logic and common interfaces of crawling points implement different burying logic, and provide methods of crawling behavior, preCap and doCap, and methods of generating crawling results. preStore.
- StandardMonitorRepository: Stores real-time data capture data structure.
- DataObserver: Exposes JMX/HTTP interface data.
- Monitor real-time monitoring mainly starts from the DefaultMonitorSupporter class to initialize the StandardMonitor object, and installs the monitor object to the DataStore object through CaptureFramework middle.
- DataObserver provides JMX/HTTP service for subsequent MA crawling. The Http service has registered three handlers, namely HttpJEEJVMObserver, HttpJEEMonitorObserver, and HttpJEEProfileObserver. Different handlers expose different interfaces.
- The Handler class under the MonitorHandler package specifically handles the calculation and statistics of Monitor's indicator data.
- Synchronous capture entry point: runMonitorCaptureOnServerCapPoint
- Asynchronous capture entry point: runMonitorAsyncCaptureOnServerCapPoint
- Asynchronous call before method execution

- ##The asynchronous call after method execution is as follows, where ccMap is the encapsulated context information returned by the asynchronous call
 2.5 Analysis of grabbing behavior
- Monitor interface: Provides multiple interfaces, the most important of which are the doCapture and doPreStore methods. doCapture is used to implement execution at a specific capture point. For the behavior of capturing data, the doPreStore method is used to implement some capturing actions before storing it in the data structure, and to do some special data processing.
- StandardMonitor class: The specific implementation class of the Monitor interface.
- StandardMonitorRepository class: stores real-time data capture data structure.
- MonitorElementInstance interface: An instance interface that stores real-time data capture data structures.
- StandardMonitorElementInstance class: The specific implementation class of the MonitorElementInstance interface.
- Whether it is a synchronous capture entry point or an asynchronous capture entry point, the doCapture method will be executed. The code snippet is as follows:
 monitor.doCapture It calls doCapture in the Monitor interface, and its implementation class is StandardMonitor.
The doCapture method in StandardMonitor mainly does the following operations:
- Get the current MonitorElement array according to the parameters. The MonitorElement array is implemented through getElementByCapId of StandardMonitorRepository;
Loop through the MonitorElement array, obtain the capture data implementation class, obtain the current handler to be executed based on the implementation class, and finally determine the capture stage (precap/docap) based on the currently obtained handler, and then perform corresponding processing . Different handlers generate MonitorElementInstance based on different characteristics, and finally store the results in the StandardMonitorRepository data structure.
Take ServerEndRespTimeCapHandler (server-side crawling behavior) as an example:
preCap method: only records the start request time of the service.
doCap method: perform different logical processing according to different monitorElemId, and finally encapsulate the MonitorElementInstance instance, and then process the capture behavior results, including maximum value peak elimination, maximum value , minimum value, return status code, timestamp update, counting and other corresponding data processing.
3. Real-time data collection
3.1 What is real-time data
That is, runtime data, which refers to the information generated when the program is running. The CPU, heap memory, JVM information occupied by the program, and statistics related to service access and client calls (average response time, access count, etc.).
3.2 Server-side data collection
Implementation of DefaultMonitorSupporter
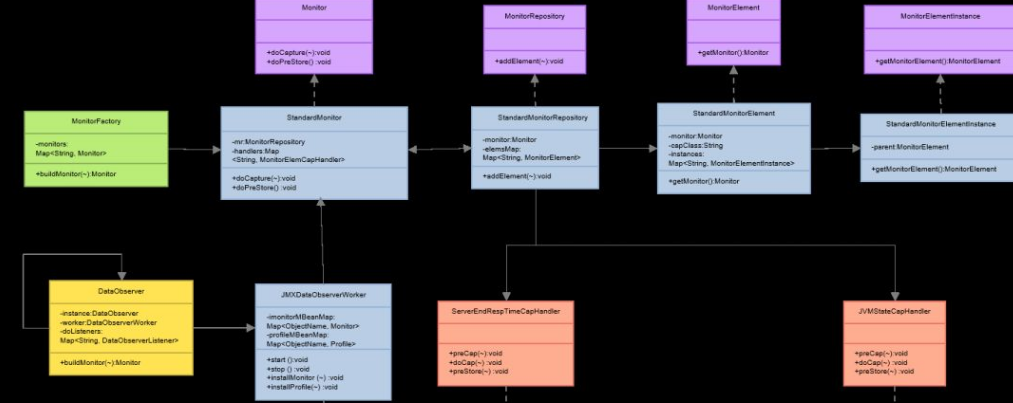
Server-side data collection uses DefaultMonitorSupporter.start as the entry point to build a monitor instance :

- ServerEndRespTimeCapHandler: collects the response time and loading count of Server, APP, URL, etc.
- JVMStateCapHandler: Collects jvm status, including Heap usage, GC count, thread count, CPU, class count, etc.

 ##3.3 Client data collection
Implementation of DefaultClientMonitorSupporter
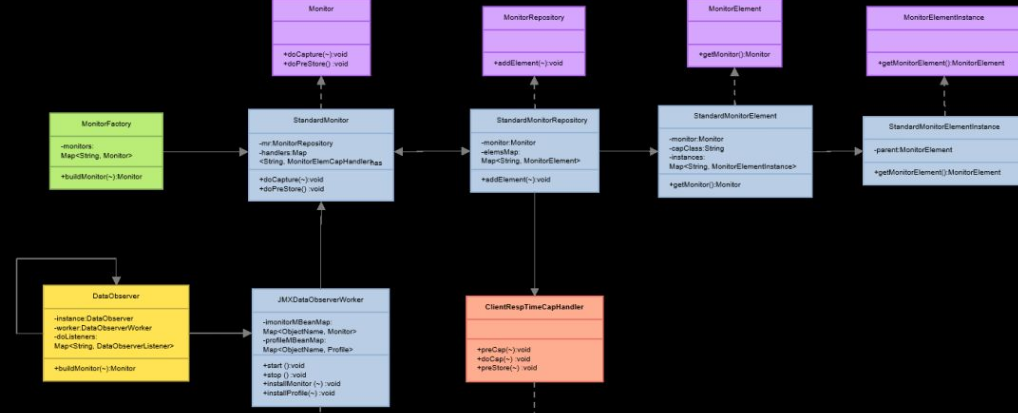 Client data collection uses DefaultClientMonitorSupporter.start as the entry point to build a monitor instance:
 Build the client type StandardMonitor by default Instance, which contains StandardMonitorRepository instance, StandardMonitorRepository instance registers monitor, one instance contains multiple MonitorElement instances, and saves all MonitorElement instances in the elemsMap attribute.
- elemsMap: The property only saves one ClientRespTimeCapHandler collection class.
- ClientRespTimeCapHandler: Collects the client's response time and loading count, etc.
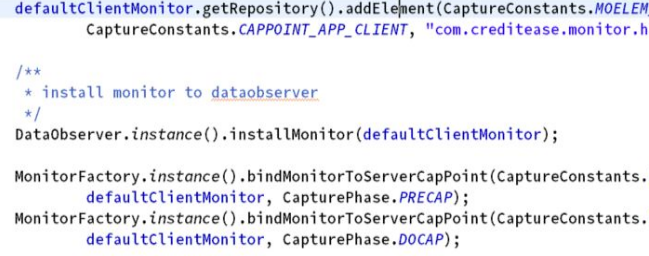 Whether it is client-side data collection or server-side data collection, the monitor will be installed into the DataObserver; and finally the successfully constructed monitor will be bound Set to the specified capture method (i.e. precap and docap).
3.4 Implementation of DataObServer
DataObServer provides two modes to expose interface data, namely JMX and HTTP:
- HTTP mode: by HttpDataObserverWorker .start is used as the entry point, and three handlers are registered respectively, which are handlers for obtaining JVM data, Monitor data and profile data. Each handler exposes a unique interface, but they all return data in JSON format.
- JMX method: The JMX agent obtains the exposed interface through the getMBeanInfo method to obtain data.
- DataObServer also provides methods to install and uninstall monitors, add and remove listeners, and obtain profiles and monitors:
The above is the detailed content of How to perform CaptureFramework framework analysis. For more information, please follow other related articles on the PHP Chinese website!

Hot AI Tools

Undresser.AI Undress
AI-powered app for creating realistic nude photos

AI Clothes Remover
Online AI tool for removing clothes from photos.

Undress AI Tool
Undress images for free

Clothoff.io
AI clothes remover

AI Hentai Generator
Generate AI Hentai for free.

Hot Article

Hot Tools

Notepad++7.3.1
Easy-to-use and free code editor

SublimeText3 Chinese version
Chinese version, very easy to use

Zend Studio 13.0.1
Powerful PHP integrated development environment

Dreamweaver CS6
Visual web development tools

SublimeText3 Mac version
God-level code editing software (SublimeText3)

Hot Topics
 What category does the operation and maintenance security audit system belong to?
Mar 05, 2025 pm 03:59 PM
This article examines operational security audit system procurement. It details typical categories (hardware, software, services), budget allocation (CAPEX, OPEX, project, training, contingency), and suitable government contracting vehicles (GSA Sch
 What are the job safety responsibilities of operation and maintenance personnel
Mar 05, 2025 pm 03:51 PM
This article details crucial security responsibilities for DevOps engineers, system administrators, IT operations staff, and maintenance personnel. It emphasizes integrating security into all stages of the SDLC (DevOps), implementing robust access c
 What does the operation and maintenance safety engineer do?
Mar 05, 2025 pm 04:00 PM
This article explores the roles and required skills of DevOps, security, and IT operations engineers. It details the daily tasks, career paths, and necessary technical and soft skills for each, highlighting the increasing importance of automation, c
 The difference between operation and maintenance security audit system and network security audit system
Mar 05, 2025 pm 04:02 PM
This article contrasts Operations Security (OpSec) and Network Security (NetSec) audit systems. OpSec focuses on internal processes, data access, and employee behavior, while NetSec centers on network infrastructure and communication security. Key
 What is operation and maintenance security?
Mar 05, 2025 pm 03:54 PM
This article examines DevSecOps, integrating security into the software development lifecycle. It details a DevOps security engineer's multifaceted role, encompassing security architecture, automation, vulnerability management, and incident response
 What is the prospect of safety operation and maintenance personnel?
Mar 05, 2025 pm 03:52 PM
This article examines essential skills for a successful security operations career. It highlights the need for technical expertise (network security, SIEM, cloud platforms), analytical skills (data analysis, threat intelligence), and soft skills (co
 What is operation and maintenance security?
Mar 05, 2025 pm 03:58 PM
DevOps enhances operational security by automating security checks within CI/CD pipelines, utilizing Infrastructure as Code for improved control, and fostering collaboration between development and security teams. This approach accelerates vulnerabi
 Main work of operation and maintenance security
Mar 05, 2025 pm 03:53 PM
This article details operational and maintenance (O&M) security, emphasizing vulnerability management, access control, security monitoring, data protection, and physical security. Key responsibilities and mitigation strategies, including proacti


