

Duxiaoman quota model based on counterfactual causal inference


1. Research paradigm of causal inference
Research paradigm currently has two main research directions:
- Judea Pearl Structure Model
- Potential output framework
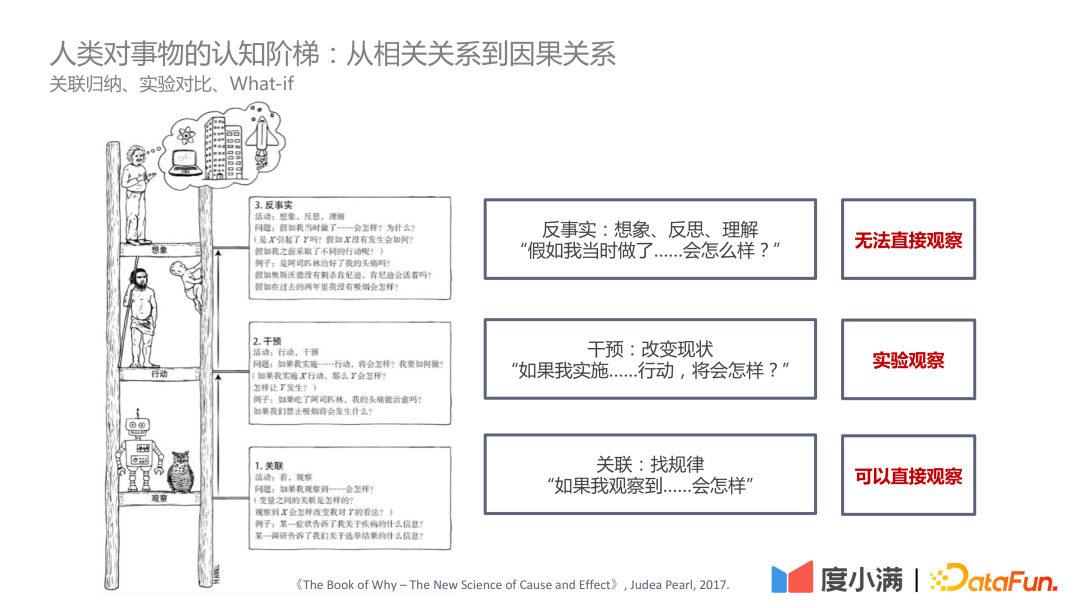
In "The Book of Why – The New Science of Cause and Effect" by Judea Pearl In this book, the cognitive ladder is positioned as three levels:
- The first level - correlation: find out the rules through correlation, you can directly Observation;
- The second level - intervention: if the status quo is changed, what actions should be implemented and what conclusions should be drawn can be observed through experiments;
- The third level - Counterfactual: Due to problems such as laws and regulations, it is impossible to directly observe experimentally. Through counterfactual assumptions, what will happen if the action is implemented and how to evaluate it ATE and CATE are a more difficult problem.
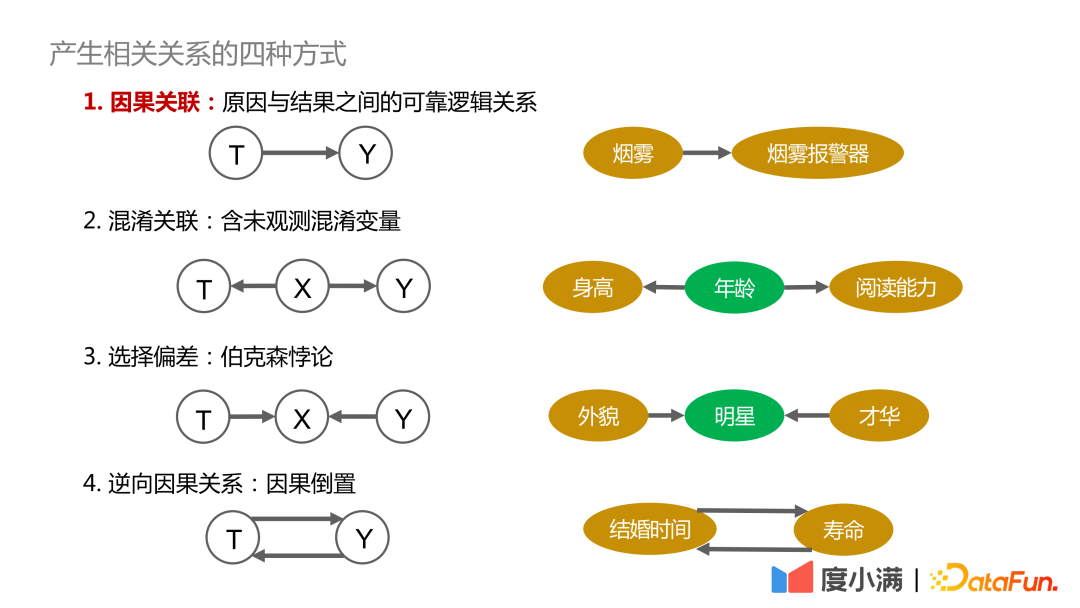
First explain the four ways to generate correlation:
1. Cause and effect Association: There is a reliable, traceable, and positively dependent relationship between the cause and the result. For example, smoke and smoke alarms are causally related;
2. Confused correlation: Contains confounding variables that cannot be directly observed, such as whether height and reading ability can be related, which need to be controlled The variable age is similar, thus drawing valid conclusions;
3. Selection bias: Essentially Berkson's Paradox, for example, if you explore the relationship between appearance and talent, if you only observe it among celebrities, you may come to the conclusion that appearance and talent cannot have both. If observed among all humans, there is no causal relationship between appearance and talent.
4. Reverse causation: That is, the inversion of cause and effect. For example, statistics show that the longer humans are married, the longer their life expectancy. the longer. But conversely, we cannot say: If you want to live longer, you must get married early.
How confounding factors affect the observation results, here are two cases to illustrate:
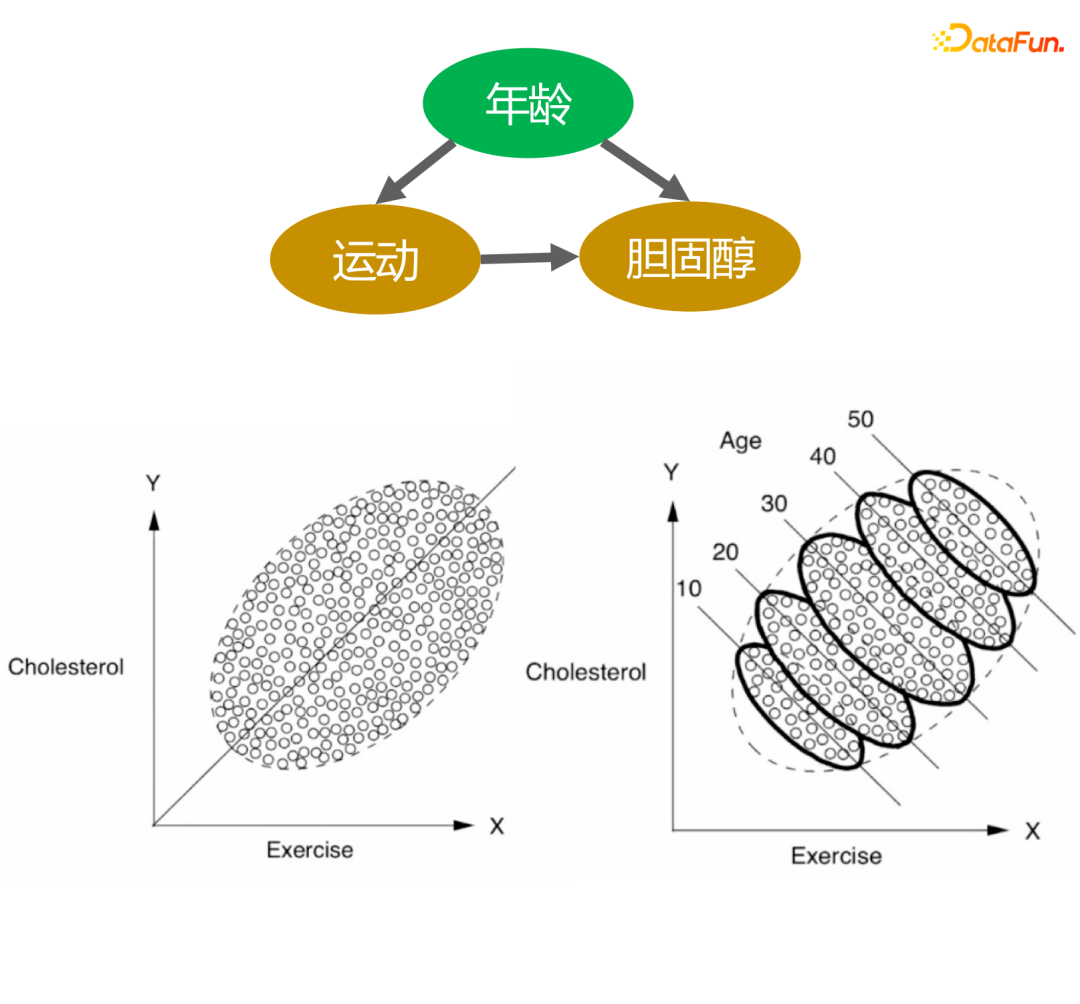
The above picture describes the relationship between exercise volume and cholesterol levels. From the picture on the left, we can conclude that the greater the amount of exercise, the higher the cholesterol level. However, when age stratification is added, under the same age stratification, the greater the amount of exercise, the lower the cholesterol level. In addition, as we age, cholesterol levels gradually increase, so this conclusion is consistent with our knowledge.
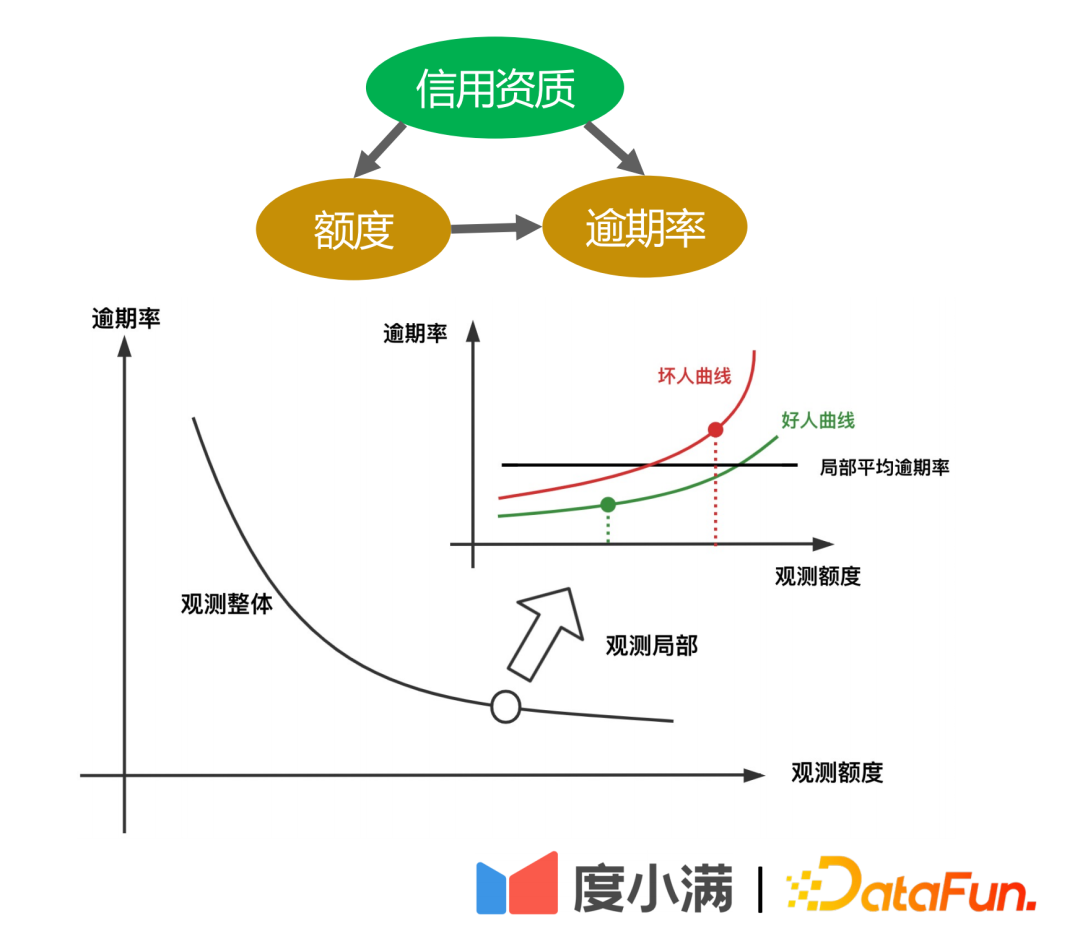
The second example is the credit scenario. It can be seen from historical statistics that the higher the given limit (the amount of money that can be borrowed), the lower the overdue rate. However, in the financial field, the borrower's credit qualification will first be judged based on his A card. If the credit qualification is better, the platform will grant a higher limit and the overall overdue rate will be very low. However, local random experiments show that for people with the same credit qualifications, there will be some people whose credit limit migration curve changes slowly, and there will also be some people whose credit limit migration risk is higher. That is, after the credit limit is increased, the risk increase will be larger. .
The above two cases illustrate that if confounding factors are ignored in modeling, wrong or even opposite conclusions may be obtained.
How to transition from RCT random samples to observational sample causal modeling?
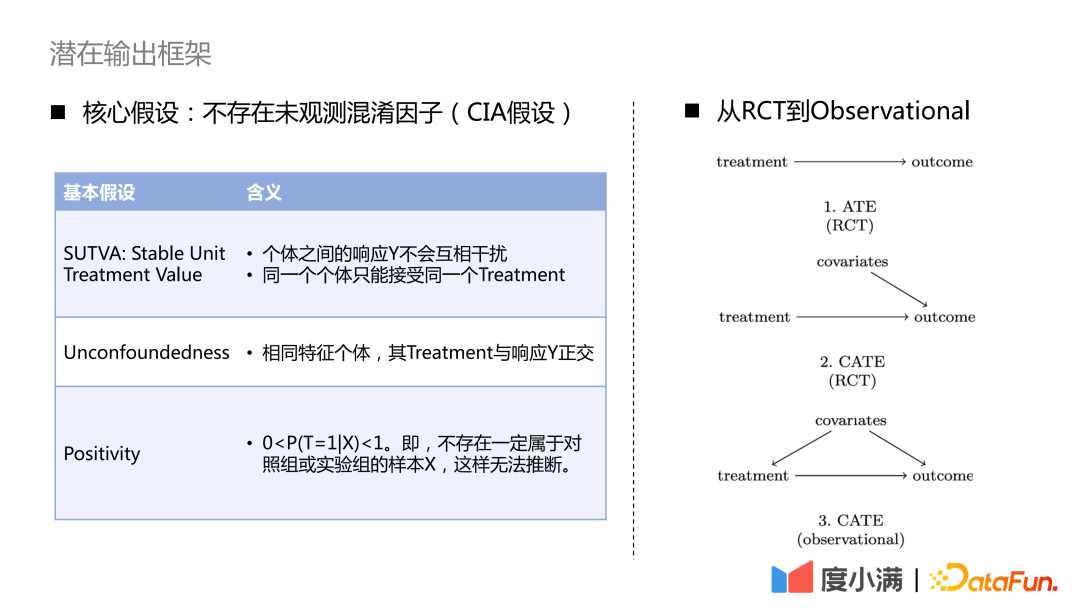
For the case of RCT samples, if you want to evaluate the ATE indicator, you can use group subtraction or DID (difference in difference). If you want to evaluate the CATE indicator, you can use uplift modeling. Common methods include meta-learner, double machine learning, causal forest, etc. There are three necessary assumptions to note here: SUTVA, Unconfoundedness and Positivity. The core assumption is that there are no unobserved confounding factors.
For the case of only observation samples, the causal relationship between treatment->outcome cannot be directly obtained. We need to use necessary means to cut off the backdoor from covariates to treatment. path. Common methods are instrumental variable methods and counterfactual representation learning. The instrumental variable method needs to peel off the details of the specific business and draw a cause-and-effect diagram of the business variables. Counterfactual representation learning relies on mature machine learning to match samples with similar covariates for causal evaluation.
2. Evolution of the framework of causal inference
1. From random data to observational data
Next, we will introduce the evolution of the framework of causal inference, and how to transition to causal representation learning step by step.
#Common Uplift Models include: Slearner, Tlearner, Xlearner.
#where Slearner treats the intervening variables as one-dimensional features. It should be noted that in common tree models, treatment is easily overwhelmed, resulting in smaller treatment effect estimates.

Tlearner discretizes the treatment, models the intervening variables in groups, builds a prediction model for each treatment, and then makes a difference . It is important to note that smaller sample sizes lead to higher estimated variances.
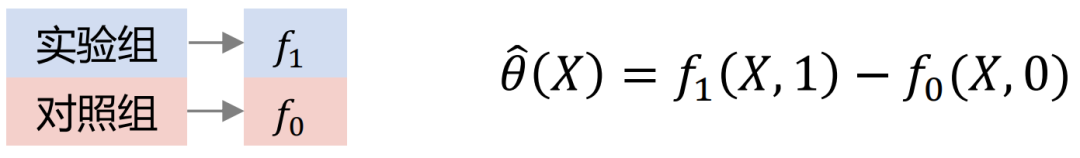
Xlearner group cross modeling, the experimental group and the control group are cross calculated and trained separately. This method combines the advantages of S/T-learner, but its disadvantage is that it introduces higher model structure errors and increases the difficulty of parameter adjustment.
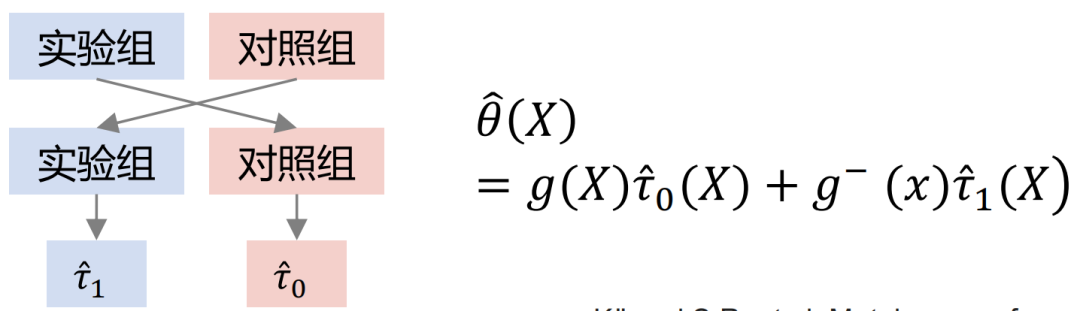
Comparison of three models:
In the above figure, the horizontal axis is the complex causal effect and the estimation error of MSE. The vertical axis is the simple causal effect. The horizontal axis and the vertical axis represent two parts respectively. data. Green represents the error distribution of Slearner, brown represents the error distribution of Tlearner, and blue represents the error distribution of Xlearner.
Under random sample conditions, Xlearner is better for both complex causal effect estimation and simple causal effect estimation; Slearner performs relatively poorly for complex causal effect estimation, and is better for simple causal effect estimation. Excellent; Tlearner is the opposite of Slearner.
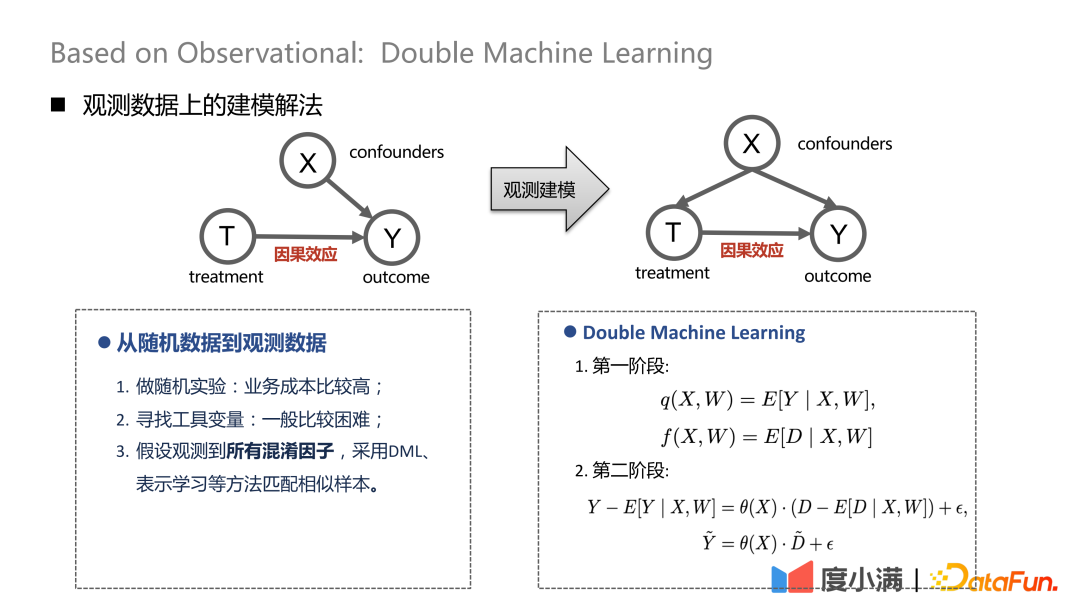
If there are random samples, the arrows from X to T can be removed. After transitioning to observational modeling, the arrows from X to T cannot be removed. Treatment and outcome will be affected by confounders at the same time. At this time, some depolarization processing can be performed. For example, DML (Double Machine Learning) method performs two-stage modeling. In the first stage, X here is the user's own representation characteristics, such as age, gender, etc. Confounding variables could include, for example, historical efforts to screen out specific groups of people. In the second stage, the error in the calculation result of the previous stage is modeled, here is the estimate of CATE.
There are three processing methods from random data to observed data:
(1) Conduct randomized experiments, but the business cost is high;
(2) Finding instrumental variables is generally difficult;
(3) Assuming that all confounding factors are observed, use DML, representation learning and other methods to match similar samples.
2. Causal representation learning
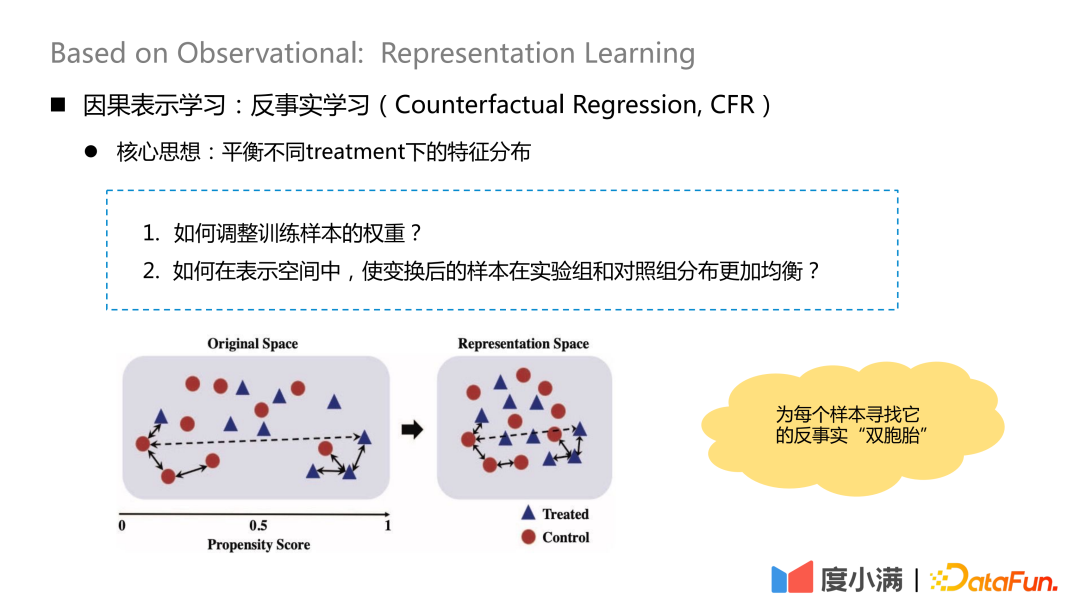
The core idea of counterfactual learning It is to balance the feature distribution under different treatments.
There are two core questions:
1. How to adjust the weight of training samples?
#2. How to make the transformed samples more evenly distributed in the experimental group and the control group in the representation space?
#The essential idea is to find its counterfactual "twin" for each sample after transformation mapping. After mapping, the distribution of X in the treatment group and control group is relatively similar.
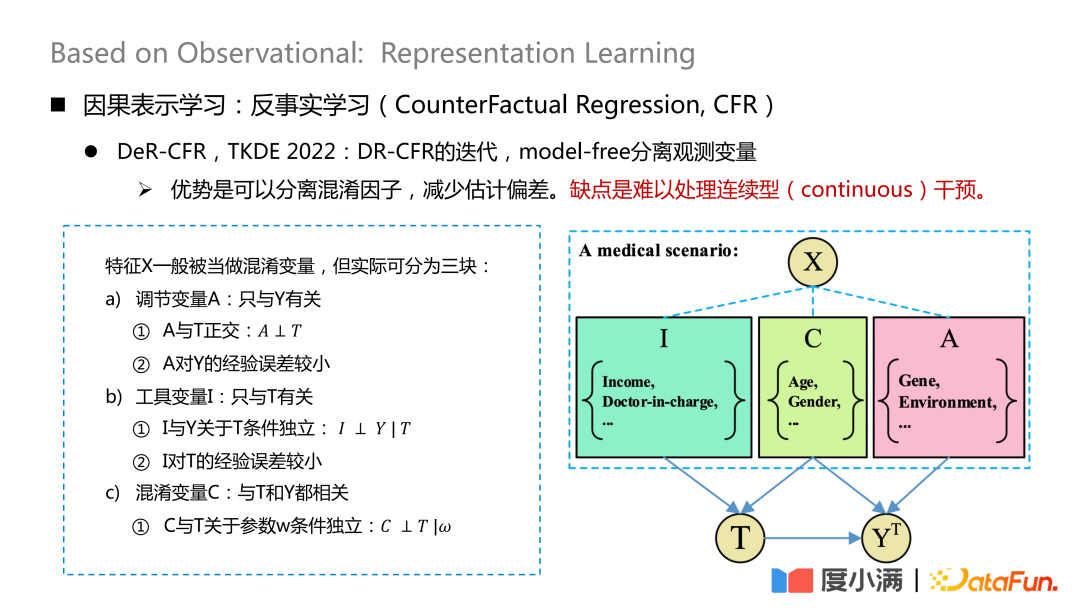
The more representative work is a paper published on TKDE 2022, which introduces the DeR-CFR Some work, this part is actually an iteration of the DR-CRF model, using a model-free method to separate observed variables.
# Divide the X variable into three pieces: adjustment variable A, instrumental variable I and confounding variable C. Then I, C, and A are used to adjust the weight of X under different treatments to achieve the purpose of causal modeling on the observed data.
#The advantage of this method is that it can separate confounding factors and reduce estimation bias. The disadvantage is that it is difficult to handle continuous interventions.
#The core of this network is how to separate the three types of variables A/I/C. The adjustment variable A is only related to Y, and it needs to be ensured that A and T are orthogonal, and the empirical error of A to Y is small; the instrumental variable I is only related to T, and it needs to satisfy the conditional independence of I and Y with respect to T, and the experience of I with respect to T The error is small; the confusion variable C is related to both T and Y, and w is the weight of the network. After giving the network weight, it is necessary to ensure that C and T are conditionally independent with respect to w. The orthogonality here can be achieved through general distance formulas, such as logloss or mse Euclidean distance and other constraints.
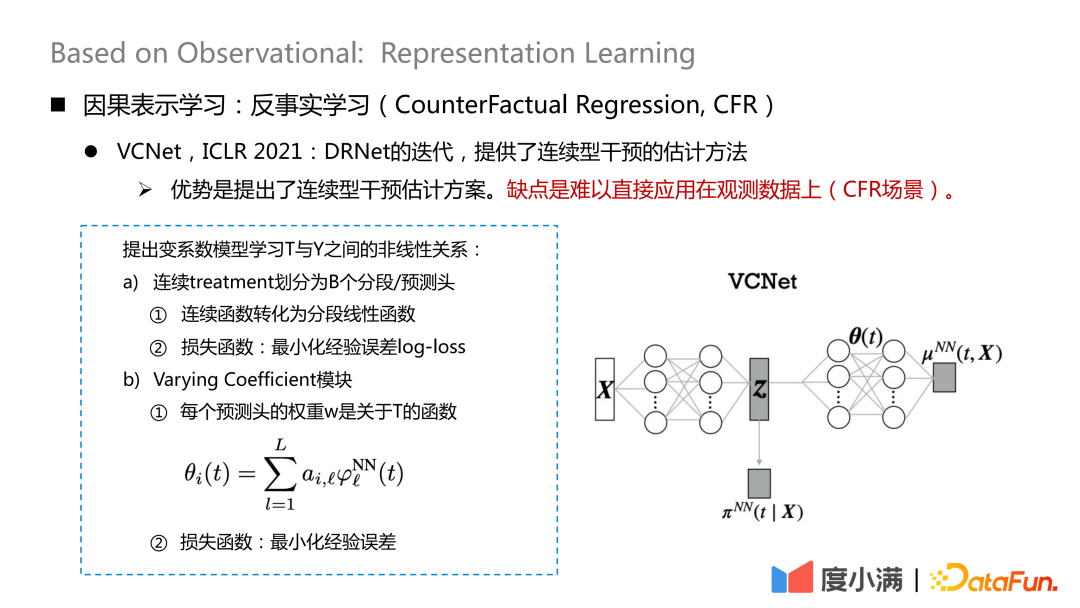
There are also some new paper studies on how to deal with continuous intervention. VCNet published on ICLR2021 provides an estimation method for continuous intervention. The disadvantage is that it is difficult to apply directly to observation data (CFR scenario).
Map The contributing variables are extracted from X. Here, the continuous treatment is divided into B segmentation/prediction heads, each continuous function is converted into a segmented linear function, and the empirical error log-loss is minimized, which is used to learn
Then use the Z and θ(t) you have learned to learn. 
3. Counterfactual Quota Model Mono-CFR
Finally, let’s introduce Du Xiaoman’s counterfactual The factual credit model mainly solves the problem of counterfactual estimation of continuous treatment on observation data.
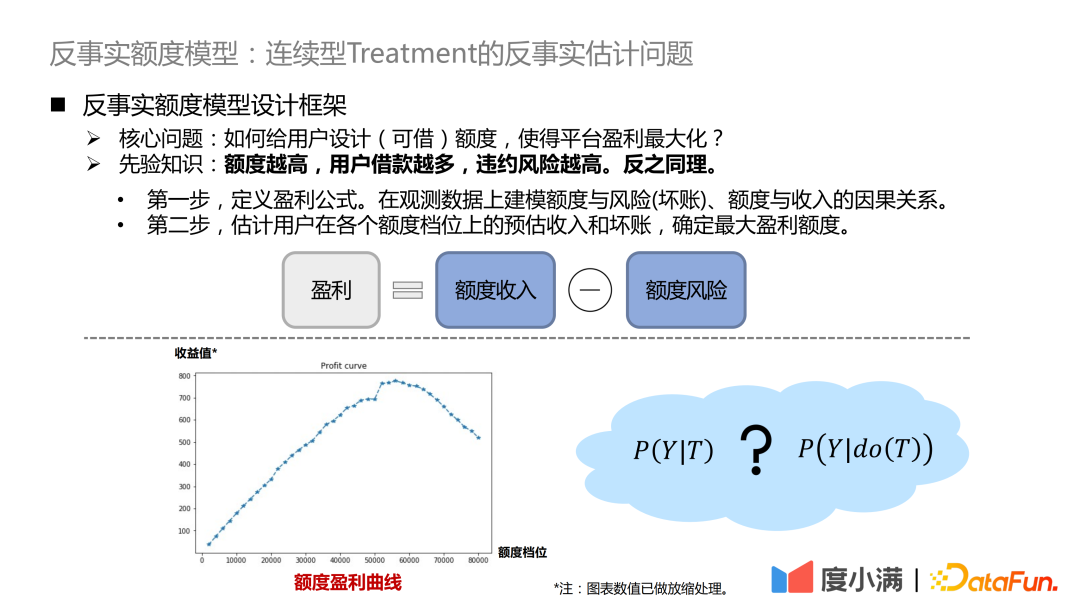
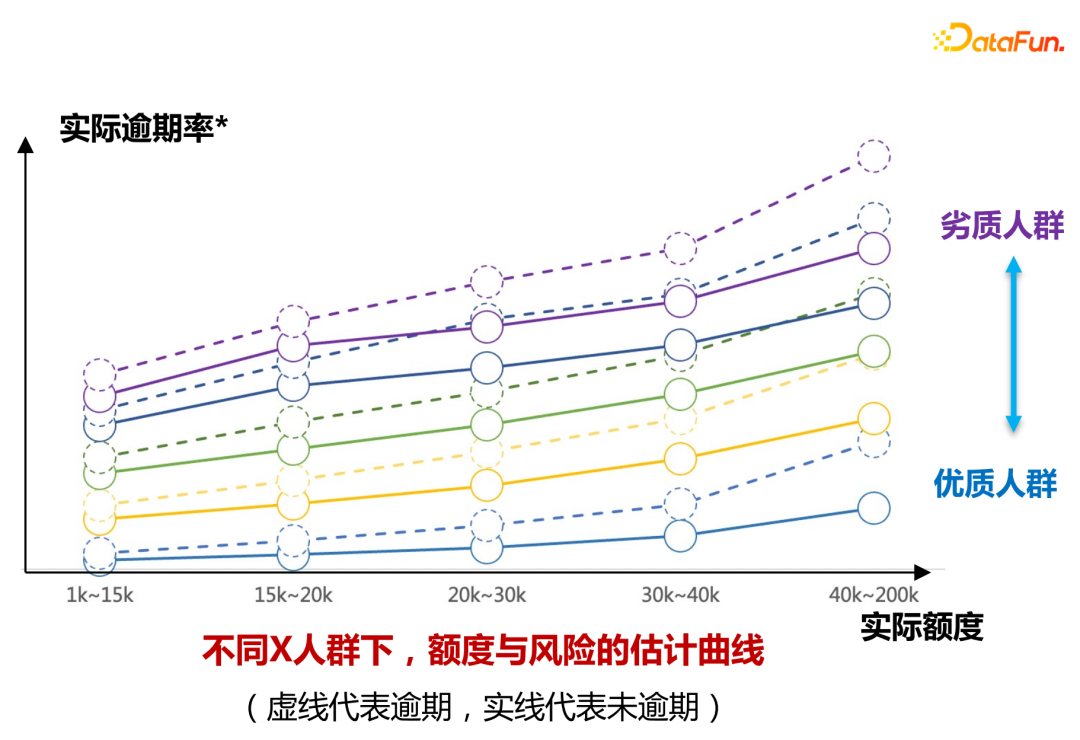
The core question is, how to design (borrowable) quotas for users to maximize platform profits? The a priori knowledge here is that the higher the limit, the more users borrow and the higher the default risk. Vice versa.
- The first step is to define the profit formula. Profit = quota income - quota risk. The formula looks simple, but in fact there are many details to adjust. In this way, the problem is transformed into modeling the causal relationship between quota and risk (bad debt), quota and income on observation data.
- #The second step is to estimate the user’s estimated income and bad debts at each quota level and determine the maximum profit amount.
We expect each user to have a profit curve as shown in the figure above. At different quota levels, the income value is inversely Factual estimates.
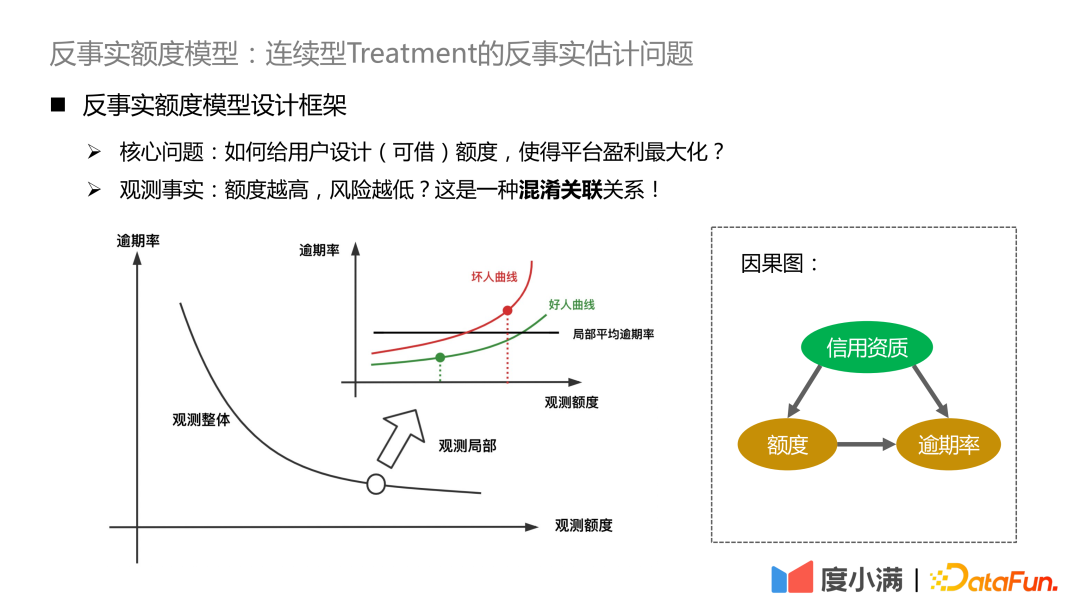
#If you see in the observation data that the higher the amount, the lower the risk, essentially due to the existence of confounding factors. The confounding factor in our scenario is credit qualifications. For people with good credit qualifications, the platform will grant a higher limit, and vice versa, the platform will grant a lower limit. The absolute risk of people with excellent credit qualifications is still significantly lower than that of people with low credit qualifications. If you improve your credit qualifications, you will see that the increase in the limit will bring about an increase in risk, and the high limit will exceed the user's own solvency.
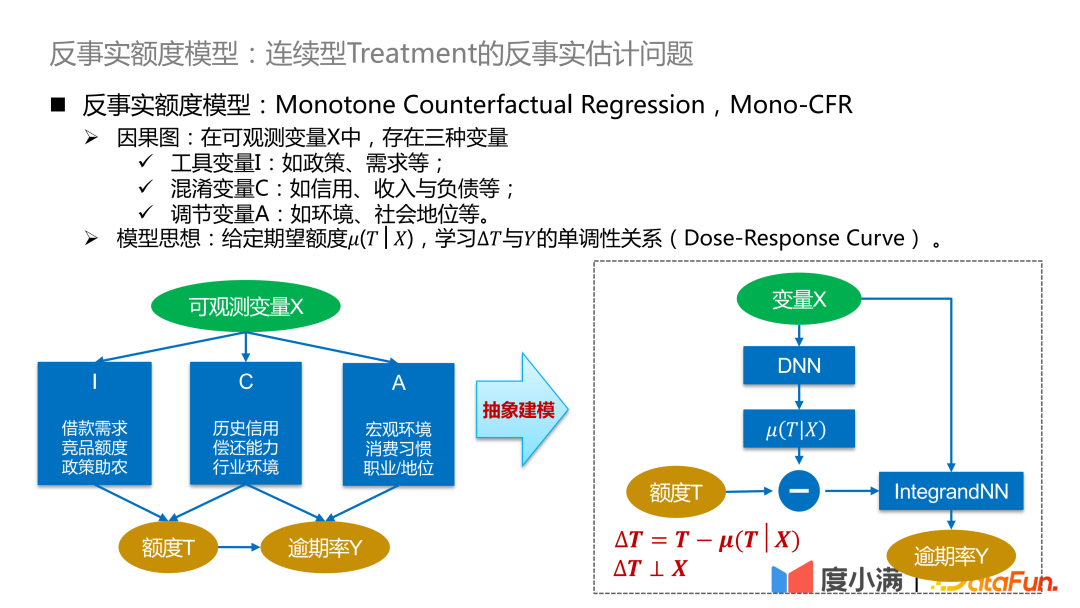
We begin to introduce the framework of the counterfactual quota model. Among the observable variables .
- Instrumental variables I: Such as policy, demand, etc., will affect the historical quota strategy, but will not affect the overdue probability.
- # Confusing variables C: Such as credit, income and liabilities, etc., which simultaneously affect the adjustment of the limit and the person's overdue probability.
- Adjusting variable A: Such as environment, social status, etc., will affect the overdue rate.
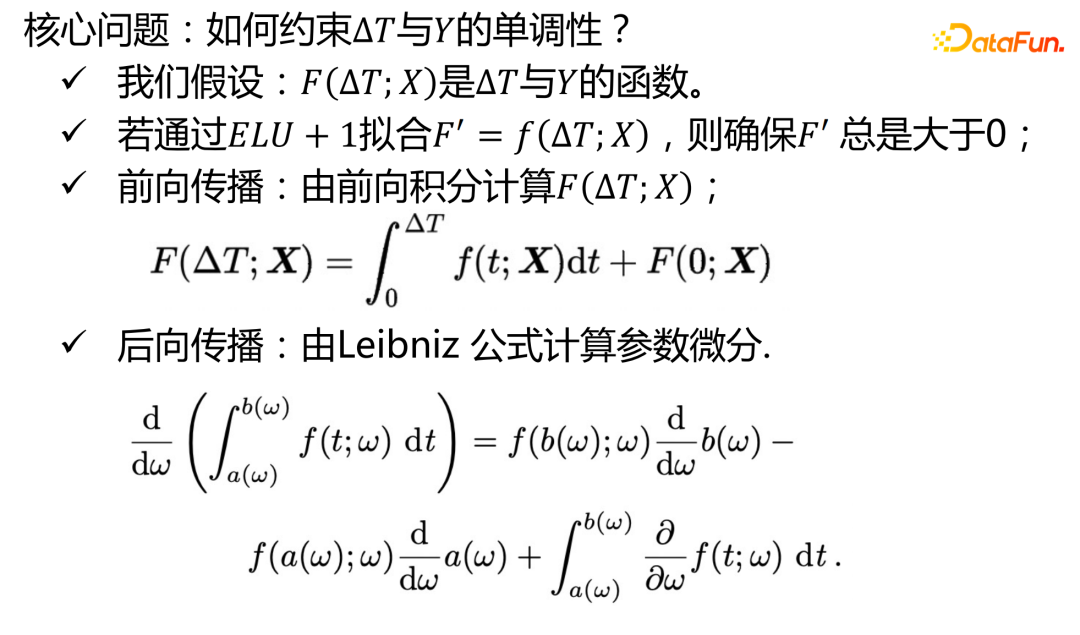
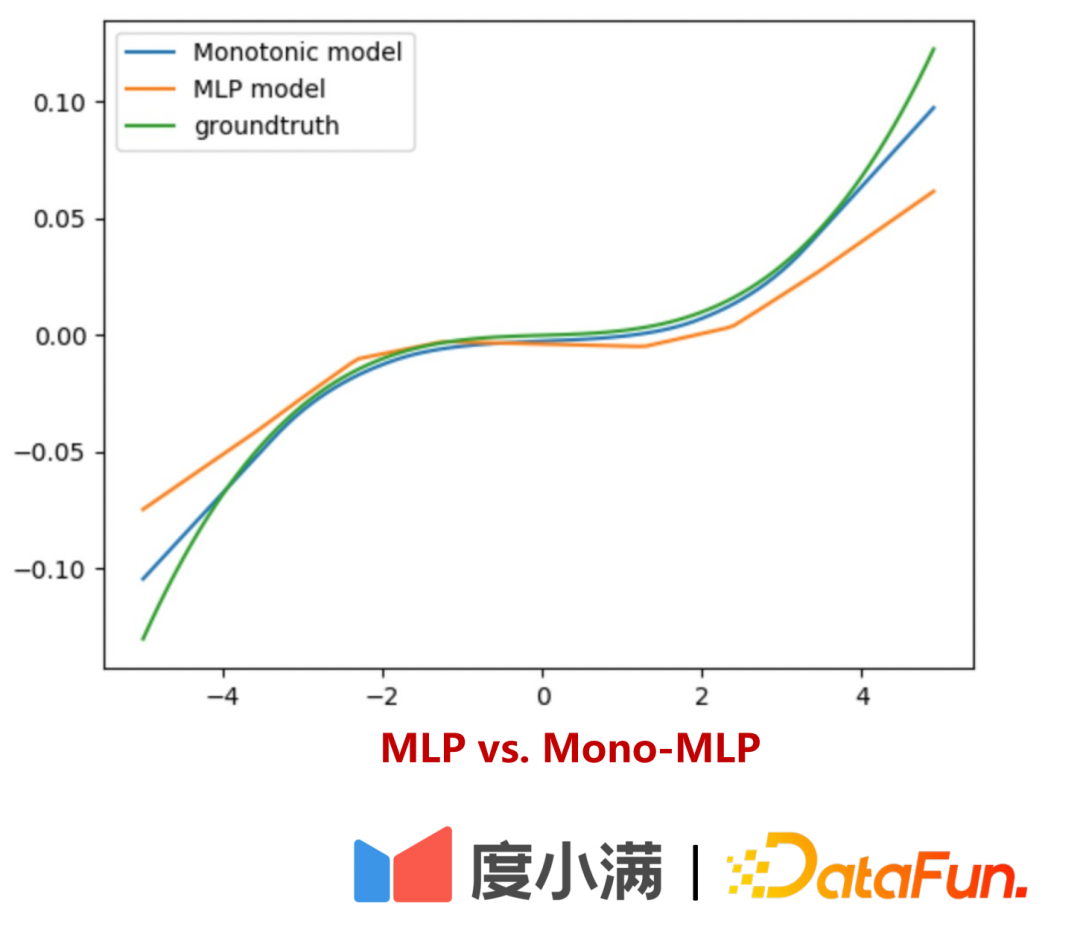
Model idea: Given the expected amount μ(T|X), learn the monotonic relationship between ΔT and Y (Dose-Response Curve) . The expected amount can be understood as the continuity tendency amount learned by the model, so that the relationship between the confounding variable C and the amount T can be disconnected and converted into the causal relationship learning between ΔT and Y, so as to compare the distribution of Y under ΔT Good characterization.
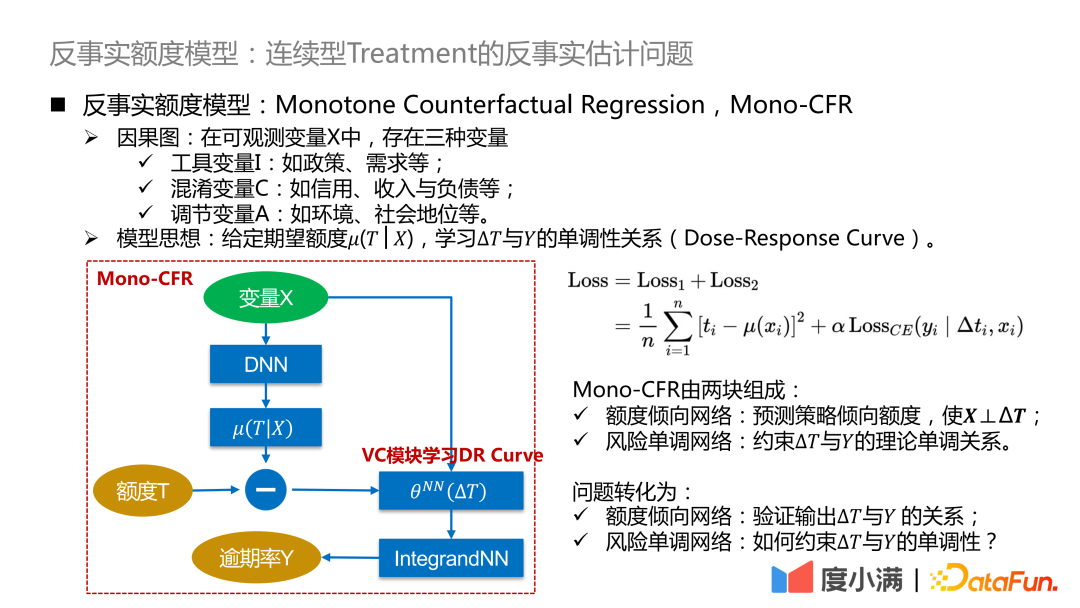
#Here we further refine the above abstract framework : Convert ΔT into a variable coefficient model, and then connect to the IntegrandNN network. The training error is divided into two parts:
##The α here is a hyperparameter that measures the importance of risk.
Mono-CFR consists of two parts:
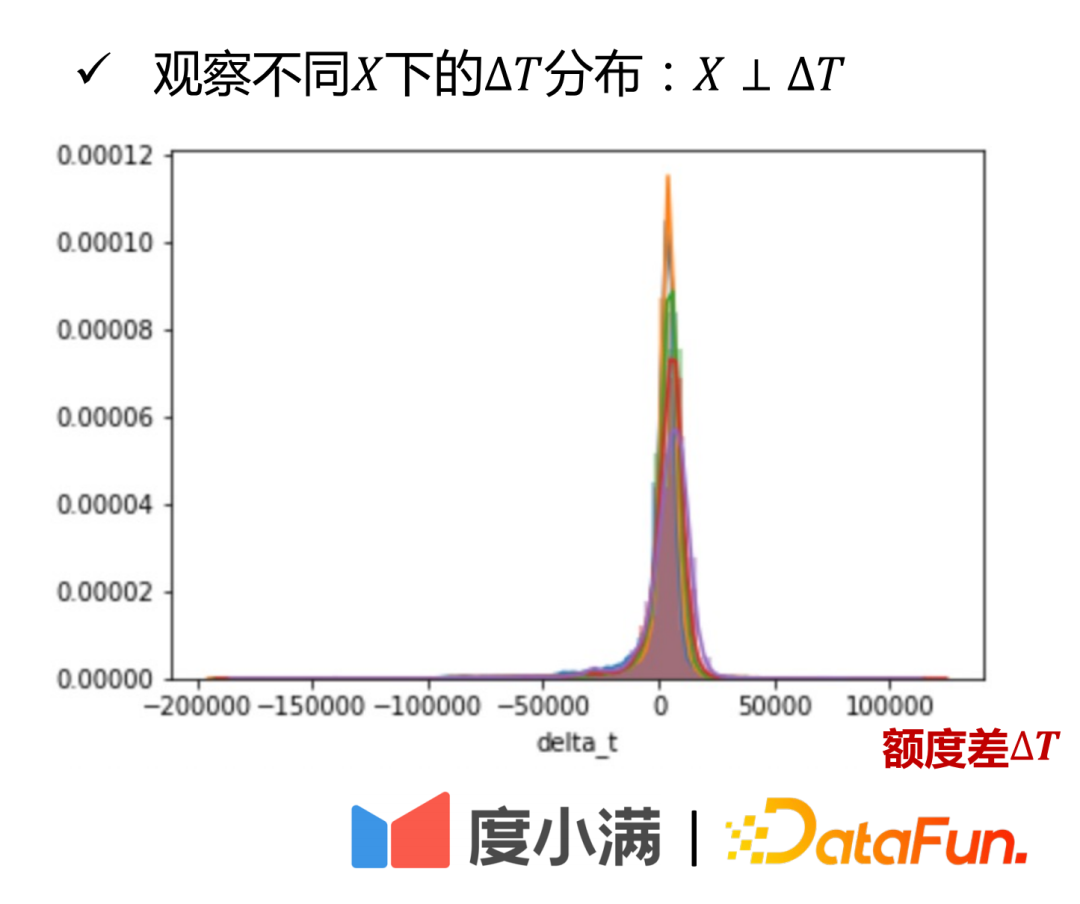
- Quota tendency Network: Predict the strategic tendency amount so that X⊥ΔT.
Function 1: Distill out the variables in X that are most relevant to T and minimize the empirical error.
# Function 2: Anchoring approximate samples on historical strategies.
- Risk monotonic network: The theoretical monotonic relationship between constraint ΔT and Y.
Function 1: Apply independent monotonic constraints to weak coefficient variables.
#Function 2: Reduce estimation bias.
The problem is transformed into:
- Quota tendency network: Verification output Δ The relationship between T and Y.
- Risk monotonic network: How to constrain the monotonicity of ΔT and Y?
The actual amount tendency network input is as follows:
#From a theoretical perspective, it can also be rigorously proven. 
The second part is the implementation of risk monotonic network:
The mathematical expression of the ELU 1 function here is:
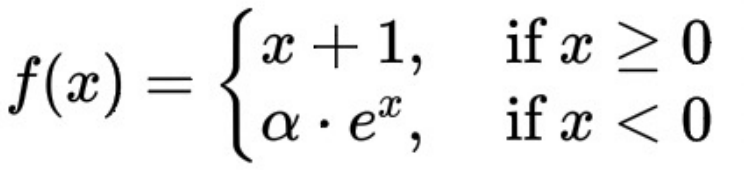
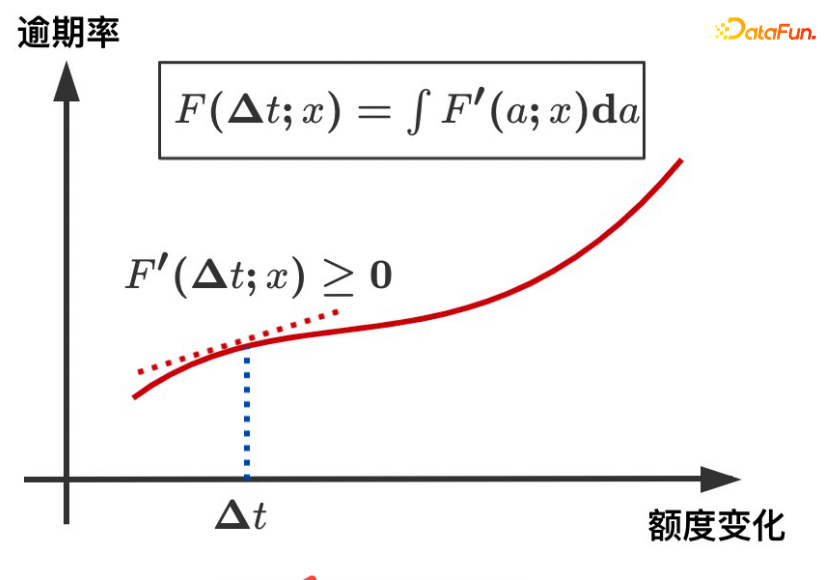
##ΔT and the overdue rate show a monotonic increasing trend, which is guaranteed by the derivative of the ELU 1 function being always greater than or equal to 0.
The following explains how the risk monotonic network can learn more accurately for weak coefficient variables:
Suppose there is such a formula:

##You can see the # here ##x1 is a weak coefficient variable. When applying monotonicity to x1 After the sexual constraint, the estimation of the response Y is more accurate. Without such a separate constraint, the importance of x1 will be overwhelmed by x2, resulting in increased model bias.
is divided into two parts:
- Part One: Interpretable Verification
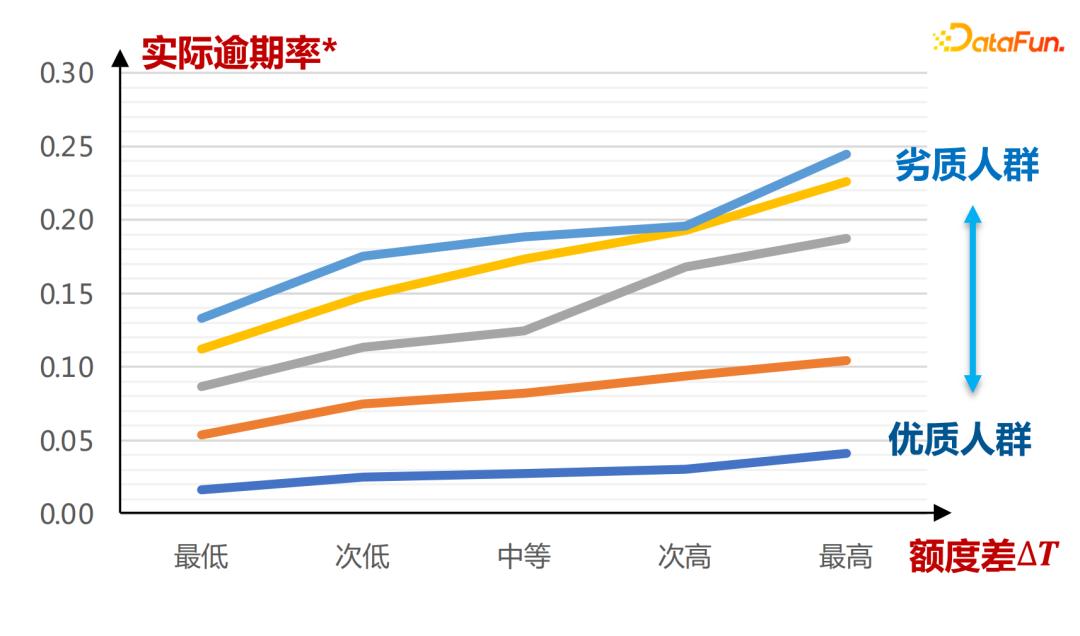
- #Part 2: Use small traffic experiments to verify that the risk deviation under different increase ranges can be obtained through uplift binning.
- ##Online experiment conclusion:
Under the condition that the quota increases by 30%, the overdue amount of users decreases by more than 20%, borrowing increases by 30%, and profitability increases by more than 30%.
Future model expectations:
Combine instrumental variables and adjustments in model-free form Variables are separated more clearly, allowing the model to perform better on risk transfer on inferior populations.
In actual business scenarios, Du Xiaoman’s model evolution iteration process is as follows:
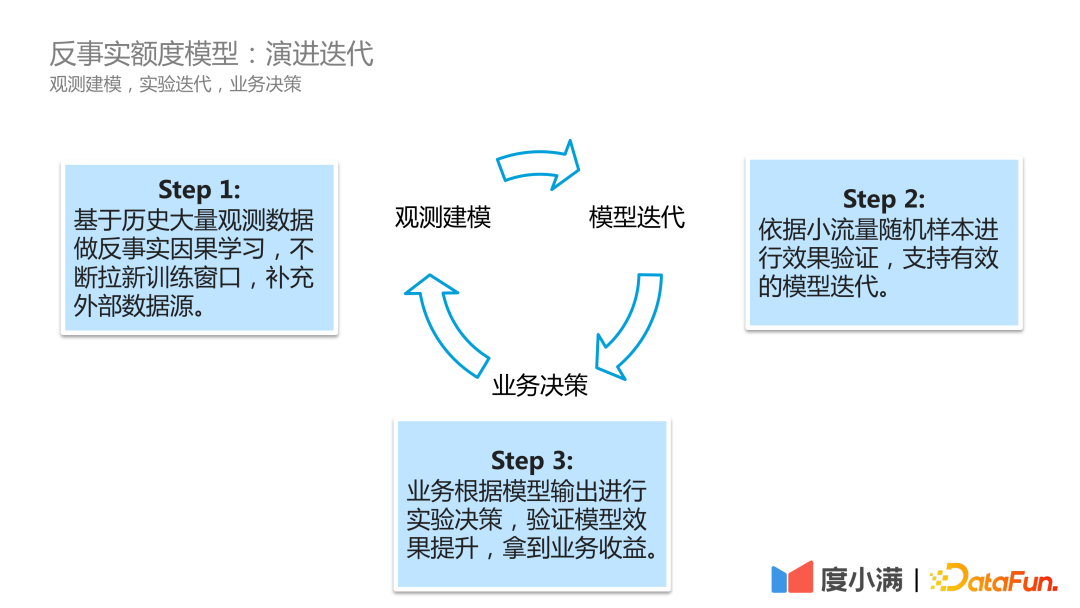
The first step is observation modeling, continuously scrolling historical observation data, doing counterfactual causal learning, and constantly opening new training windows. , supplemented by external data sources.
#The second step is model iteration. The effect is verified based on small traffic random samples to support effective model iteration.
#The third step is business decision-making. The business makes experimental decisions based on the model output to verify the model effect improvement and obtain business benefits.
The above is the detailed content of Duxiaoman quota model based on counterfactual causal inference. For more information, please follow other related articles on the PHP Chinese website!

Hot AI Tools

Undresser.AI Undress
AI-powered app for creating realistic nude photos

AI Clothes Remover
Online AI tool for removing clothes from photos.

Undress AI Tool
Undress images for free

Clothoff.io
AI clothes remover

AI Hentai Generator
Generate AI Hentai for free.

Hot Article
Hot Tools

Notepad++7.3.1
Easy-to-use and free code editor

SublimeText3 Chinese version
Chinese version, very easy to use

Zend Studio 13.0.1
Powerful PHP integrated development environment

Dreamweaver CS6
Visual web development tools

SublimeText3 Mac version
God-level code editing software (SublimeText3)
Hot Topics
 1386
1386
 52
52

 Summary of main technical ideas and methods of causal inference
Apr 12, 2023 am 08:10 AM
Summary of main technical ideas and methods of causal inference
Apr 12, 2023 am 08:10 AM
Introduction: Causal inference is an important branch of data science. It plays an important role in product iteration, algorithm and incentive strategy evaluation in the Internet and industry. It combines data, experiments or statistical econometric models to calculate the impact of new changes. The benefits are the basis for decision making. However, causal inference is not a simple matter. First of all, in daily life, people often confuse correlation and causation. Correlation often means that two variables have a tendency to increase or decrease at the same time, but causation means that we want to know what will happen when we change a variable, or we expect to get a counterfactual result, if we did it in the past If we take different actions, will there be changes in the future? The difficulty, however, is that counterfactual data are often
 Duxiaoman quota model based on counterfactual causal inference
Jun 03, 2023 pm 10:16 PM
Duxiaoman quota model based on counterfactual causal inference
Jun 03, 2023 pm 10:16 PM
1. Research paradigm of causal inference. The research paradigm currently has two main research directions: the potential output framework of Judea Pearl Structure Model. In Judea Pearl's book "The Book of Why-The New Science of Cause and Effect", the cognitive ladder is positioned as three levels: the first level - association : Find out the rules through correlation, which can be directly observed; second level - intervention: if the status quo is changed, what actions should be implemented and what conclusions should be drawn, can be observed experimentally; third level - counterfactual: due to Issues such as laws and regulations cannot be directly observed experimentally, and counterfactual assumptions are made about what would have happened if the action had been implemented, such as
 Recommender systems based on causal inference: review and prospects
Apr 12, 2024 am 09:01 AM
Recommender systems based on causal inference: review and prospects
Apr 12, 2024 am 09:01 AM
The theme of this sharing is recommendation systems based on causal inference. We review past related work and propose future prospects in this direction. Why do we need to use causal inference techniques in recommender systems? Existing research work uses causal inference to solve three types of problems (see Gaoe et al.'s TOIS2023 paper Causal Inference in Recommender Systems: ASurvey and Future Directions): First, there are various biases (BIAS) in recommendation systems, and causal inference is an effective way to remove these Tools for bias. Recommender systems may face challenges in addressing data scarcity and the inability to accurately estimate causal effects. in order to solve
 Focus on it! ! Analysis of two major algorithm frameworks for causal inference
Jun 04, 2024 pm 04:45 PM
Focus on it! ! Analysis of two major algorithm frameworks for causal inference
Jun 04, 2024 pm 04:45 PM
1. The main tasks of the overall framework can be divided into three categories. The first is the discovery of causal structures, that is, identifying causal relationships between variables from the data. The second is the estimation of causal effects, that is, inferring from the data the degree of influence of one variable on another variable. It should be noted that this impact does not refer to relative nature, but to how the value or distribution of another variable changes when one variable is intervened. The last step is to correct for bias, because in many tasks, various factors may cause the distribution of development samples and application samples to be different. In this case, causal inference may help us correct for bias. These functions are suitable for a variety of scenarios, the most typical of which is decision-making scenarios. Through causal inference, we can understand how different users react to our decision-making behavior. Secondly, in industry
 Application of causal recommendation technology in marketing and explainability
May 18, 2023 pm 01:58 PM
Application of causal recommendation technology in marketing and explainability
May 18, 2023 pm 01:58 PM
1. Uplifit gain sensitivity prediction Regarding Uplift gain, the general business problem can be summarized as: among the defined groups of people, marketers will want to know how much the new marketing action T=1 can bring compared to the original marketing action T=0. How much is the average benefit (lift, ATE, AverageTreatmentEffect). Everyone will pay attention to whether the new marketing action is more effective than the original one. In the insurance scenario, marketing actions mainly refer to insurance recommendations, such as copywriting and products revealed on the recommendation module. The goal is to find the groups that have gained the most due to marketing actions under various marketing actions and constraints, and to Do targeted delivery (AudienceTargeting). Let’s make a comparison first
 Causal inference practice in Kuaishou short video recommendation
Feb 05, 2024 pm 06:20 PM
Causal inference practice in Kuaishou short video recommendation
Feb 05, 2024 pm 06:20 PM
1. Kuaishou single-column short video recommendation scenario 1. About Kuaishou* Data is taken from the second quarter of 2023. Kuaishou is a popular short video and live broadcast community application. It has achieved impressive MAU and New DAU record. The core concept of Kuaishou is to enable everyone to become a content creator and disseminator by observing and sharing the lives of ordinary people. In Kuaishou applications, short video scenes are mainly divided into two forms: single column and double column. At present, the traffic of a single column is relatively large, and users can immersively browse video content by sliding up and down. The double-column presentation is similar to an information flow. Users need to select the ones they are interested in from the several contents appearing on the screen and click to watch. The recommendation algorithm is the core of Kuaishou’s business ecosystem and is important for traffic distribution.
 How to make better use of data in causal inference?
Apr 11, 2023 pm 07:43 PM
How to make better use of data in causal inference?
Apr 11, 2023 pm 07:43 PM
Introduction: The title of this sharing is "How to better use data in causal inference?" ", which mainly introduces the team's recent work related to published papers on cause and effect. This report introduces how we can use more data to make causal inferences from two aspects. One is to use historical control data to explicitly mitigate confusion bias, and the other is causal inference under the fusion of multi-source data. Full text table of contents: Causal inference, background correction, causal trees, GBCT causal data fusion in ants’ business applications 1. Causal inference background. Common machine learning prediction problems are generally set in the same system. For example, independent and identical distribution is usually assumed, such as predicting smokers. Prediction problems such as the probability of getting lung cancer and picture classification. The question of cause and effect is concerned with the mechanism behind the data. Common questions such as
 Is AI fraud a 100% success rate? Du Xiaoman's anti-deep fake model 'defeats magic with magic”
May 30, 2023 pm 09:46 PM
Is AI fraud a 100% success rate? Du Xiaoman's anti-deep fake model 'defeats magic with magic”
May 30, 2023 pm 09:46 PM
2023-05-2610:22:19 Author: Song Junyi Recently, a topic #AIFraud Success Rate is Close to 100%# became a hot search on Weibo. A video of AI face-changing defrauded the legal representative of a technology company in Fujian out of 4.3 million yuan in 10 minutes. An AI-related scam also occurred abroad. An email with a video of Google CEO attached led many YouTube bloggers to download files containing dangerous viruses. Both fraud incidents involved deepfake technology. This is a face-changing method that has been around for 6 years. Nowadays, the explosion of AIGC technology has made it easier and easier to create hard-to-identify deepfake videos. For the financial industry where facial recognition is widely used,
