
Hello everyone, the monthly VR content/hardware big data statistics is with you again. Want to know about the VR software and hardware market? Just pay attention here. We will collect statistics on users and content on the Steam platform and push them to you on time at the beginning of each month, so don’t miss it!

This data report includes: Steam VR hardware statistics, Steam VR game statistics, Oculus (Rift, Quest, App Lab) game statistics, SideQuest game statistics.
Since the Steam platform simplified the classification of VR tags on the game page in December 22, and canceled information such as supported models of VR devices (one of the reasons is the promotion of OpenXR, which is more universal and has less meaning in display), so The statistics section will also be simplified.
VR Hardware Big Data
According to statistics released by the Steam platform, active SteamVR players accounted for 1.87% of the total number of Steam players in May 2023, a slight decrease of 0.06 percentage points from the previous month (1.93%).
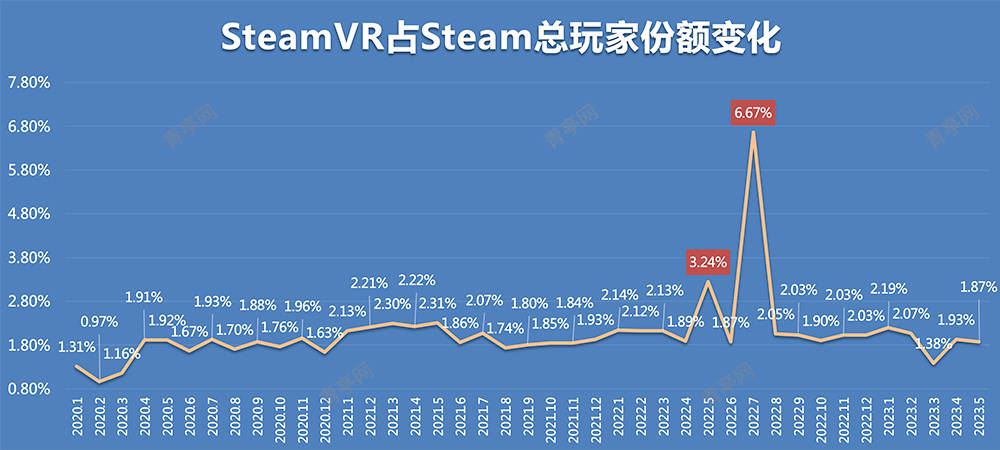
Because the Steam platform has not yet announced the 2022 summary data, the latest MAU, etc. are still unknown. Here is a rough estimate based on the 132 million monthly active users of Steam in 2021. SteamVR’s active users in May were 2.5476 million (actually it must be higher).
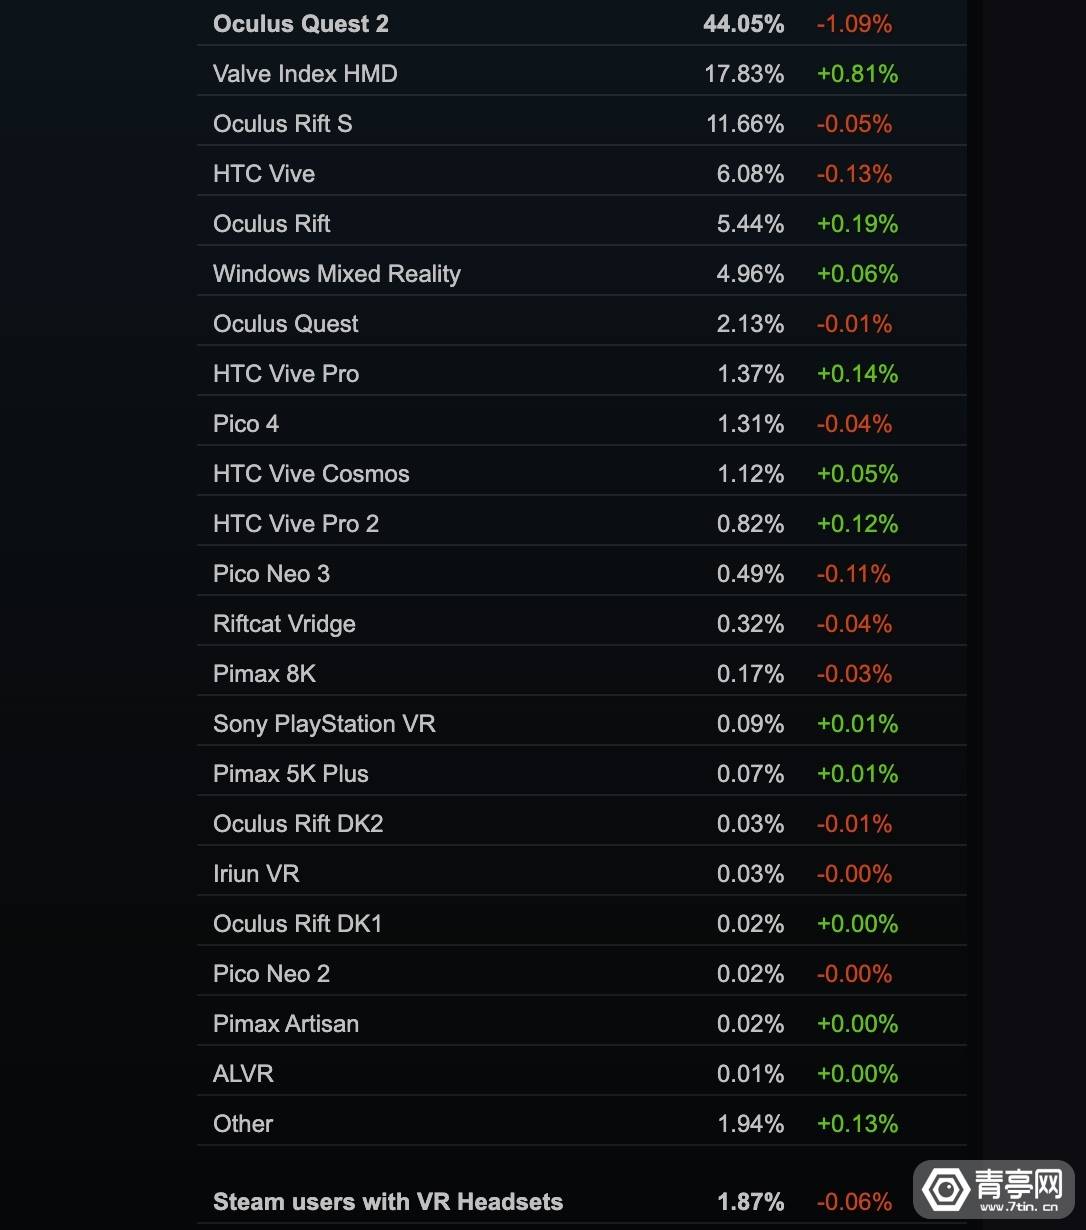
The top three active devices on SteamVR in May are: Oculus Quest 2 (44.05% ↓), Valve Index HMD (17.83% ↑), and Oculus Rift S (11.66% ↓).
From the statistics in May, only Quest 2’s share has changed significantly, with its share falling by more than 1 percentage point.
Reminder: The data related to all-in-one VR machines on the Steam platform is only for users who participate in streaming. Since not all all-in-one machine users use the streaming function, users who only use all-in-one machine mode (without streaming) are not included in the statistics. scope. In turn, it proves that Quest 2 is powerful enough to not only dominate the all-in-one VR market, but can also erode the PC VR market, so that now PC VR is in a slump and there are very few new products.
In terms of hardware brand distribution, the distribution of SteamVR in May is: Oculus (63.33% ↓), Valve (17.83% ↑), HTC (9.39% ↑), Windows MR series (4.96% ↑), PICO (1.82% ↓), Pimax (0.26% ↓).
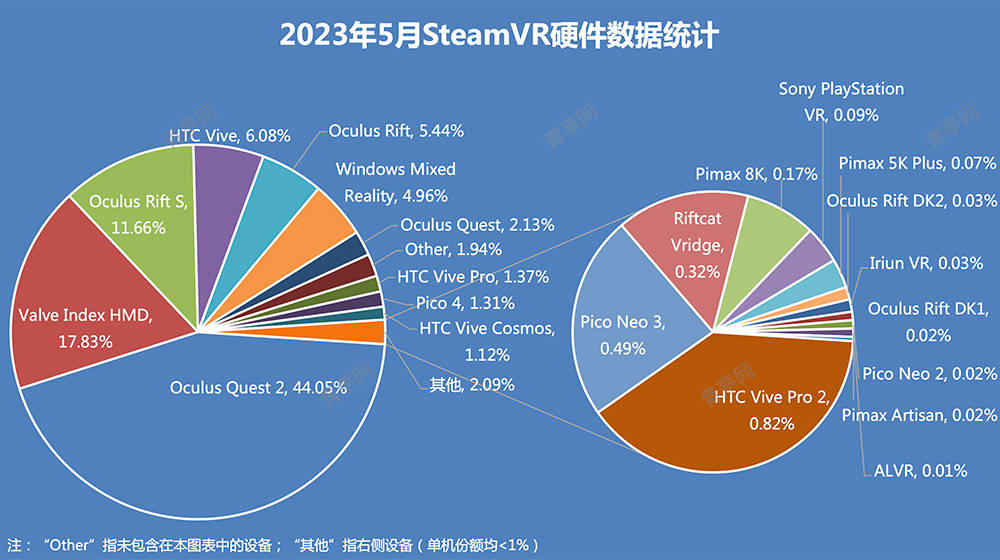
SteamVR hardware distribution chart in May
According to the statistics of SteamVR headset hardware in May, ranking from high to low (the color of rising and falling in the article is changed to domestic custom, rising is red, falling is green, which is opposite to the color of Steam marked data):
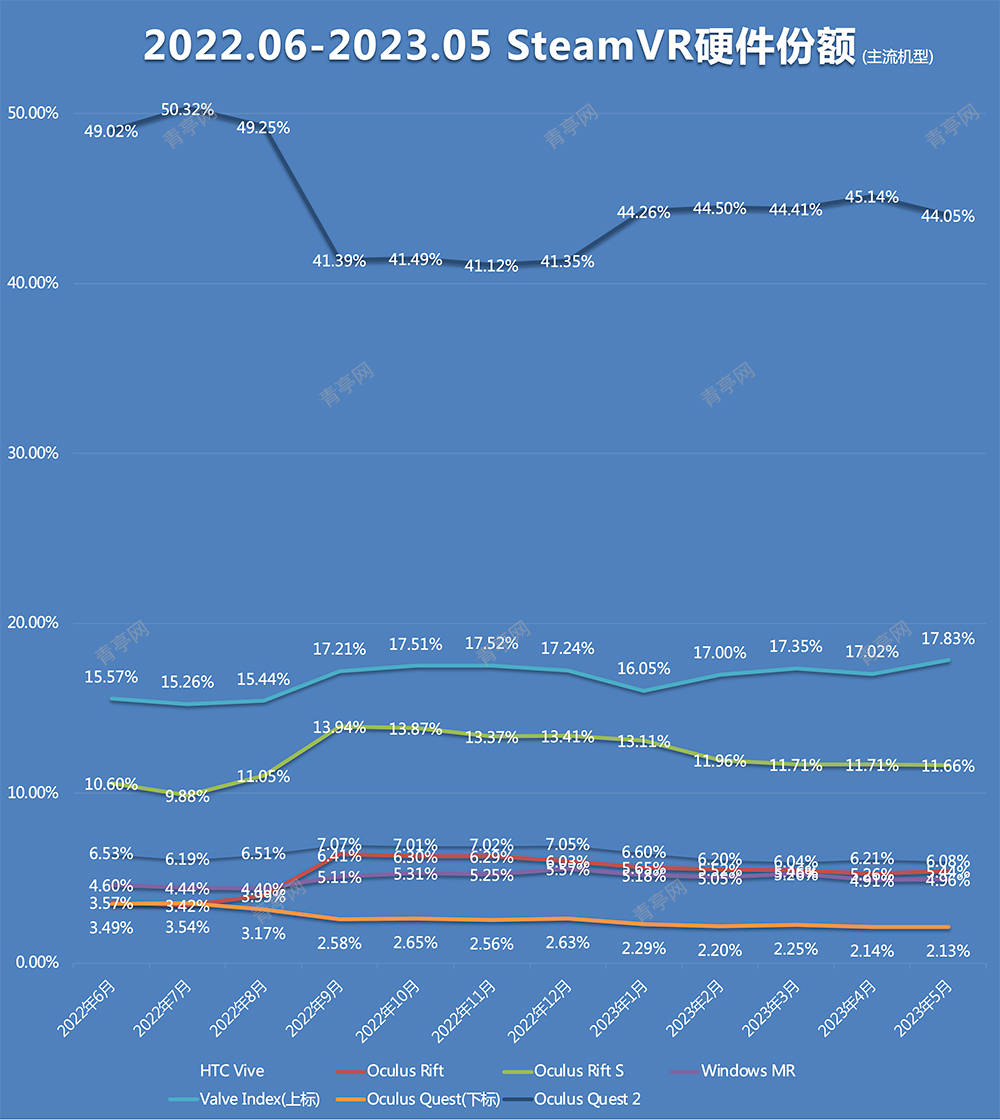
Changing trends of mainstream VR equipment
Hardware change trends in May:
1, Quest 2 fell by more than 1 percentage point, but it is within the normal range;
2. The overall hardware share is relatively stable. The next step is to release new blockbuster hardware. For example, Quest 3 has been released, and it will definitely hit the list when it is officially launched.
Steam platform VR application data
Regarding the SteamVR platform, according to statistics from Qingting.com, as of the end of May 2023, the total number of Steam platform applications was 150913 (last month was 149697), of which support VR content There are 7360 models (7344 models last month), an increase of 16 models from the previous month. VR applications account for approximately 4.87% of the total number of applications on Steam.
VR exclusive content ("exclusive" refers to applications that only provide VR mode), a total of 6099 models (last month: 6079 models), an increase of 20 models from the previous month, exclusive content accounts for the total number of VR content About 82.87%. Among them, there are 4828 exclusive VR games (4817 last month), an increase of 11 from last month.
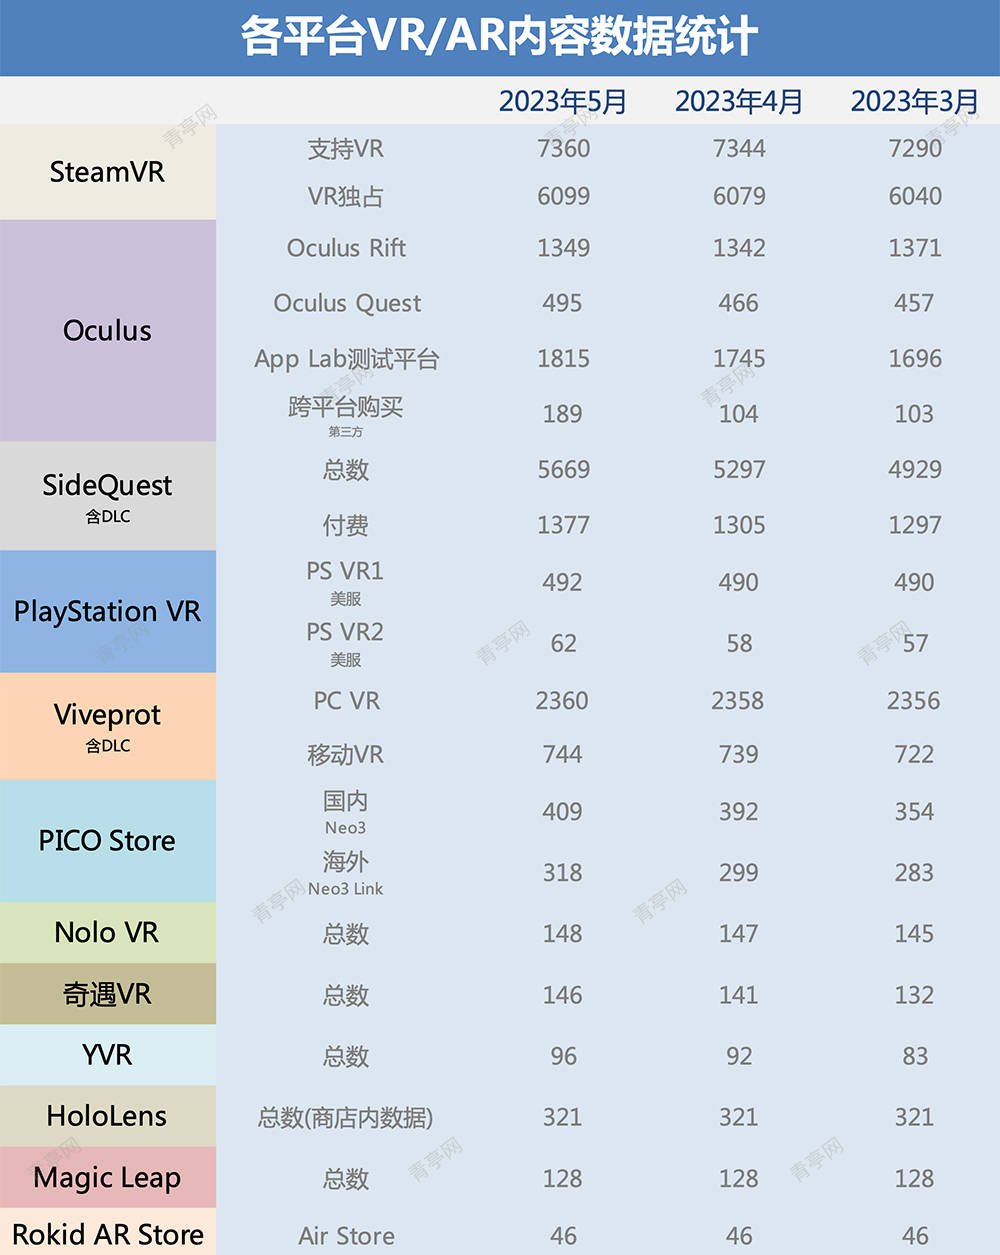
Oculus platform application data
Regarding the Oculus platform, as of the end of May, the number of Oculus Rift platform applications was 1,349; The number of Oculus Quest platform applications was 495.
As of now, Meta’s official cross-platform purchase (Crossbuy, supports Oculus Rift and Quest single-platform purchase, both ends are available) has been closed and cannot be opened, so we combined third-party data platform statistics in May (3, 4 (month is still official data), with a total of 189 cross-platform applications. Unexpectedly, the third-party statistics were more than twice as fast as the official ones. I compared them and found that the statistics on the previous official page were incomplete and mainly based on the latest data.
Oculus official test platform App Lab has experienced rapid growth in applications since its launch early last year. The latest statistics at the end of MayThe number of App Lab applications and games reached 1815. App Lab alone exceeds the number of content on the Rift platform. So now the App Lab platform is vigorously promoting the content diversity of Quest, and it also includes a large number of imaginative applications.
Although the third-party platform SideQuest continues to grow, its application data is complicated. According to statistics from Qingting.com, the latest number of SideQuest applications has reached 5,669, including 1,377 paid applications. Please note: SideQuest statistics are not accurate because they include platform content such as Oculus store applications, App Lab applications, Itch.io or Patreon (which can be understood as the total number of Quest items that can be searched), and the same item can be distributed Multiple plug-ins or DLCs lead to cluttered data, for reference only.
In addition, from the picture above, the scale of the PICO App Store is also growing rapidly. The number of domestic platforms has officially exceeded 400, and the quality and quantity of applications are also leading. This lead continues to expand.
The above is the detailed content of VR big data in May: Quest 2 fell by more than 1%, with little other changes. For more information, please follow other related articles on the PHP Chinese website!


