

systemd log maintenance guide (with examples)


If your Linux distribution supports systemd, then starting from startup, it will download all processes and applications from the system every second Collect logs in the program. All these journal events are managed by systemd’s journald daemon. journald collects all logs (information, warnings, errors, etc.) and stores them as binary data in disk files.
Since the log is retained on disk and collected every second, it takes up a huge amount of disk space; especially for old systems and servers. For example, on one of my test systems that's been running for a year or so, the log files are gigabytes in size.
If you manage multiple systems and servers, it is recommended that you must correctly manage journald logs for efficient operation. Let's take a look at how to manage log files.
systemd log maintenance
Using systemd’s journalctl tool, you can query these logs and perform various operations on them. For example, view log files from different startups to examine the last warnings and errors for a specific process or application. If you don’t know any of this, I suggest you take a quick look at this tutorial before following this guide: Using journalctl to view and analyze systemd logs (with examples).
Where are the log files of the physical diary?
systemd's journald daemon collects logs every time it is started. This means that it categorizes log files based on startup conditions.
The log is stored in binary form in the path /var/log/journal, and the folder is the machine ID.
For example:
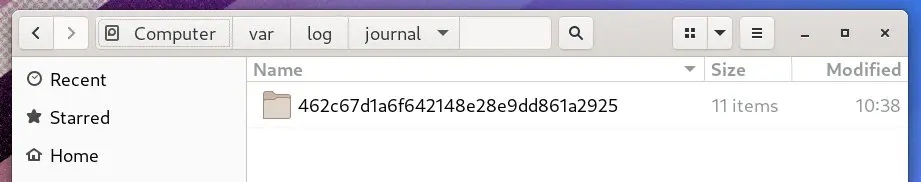
Screenshot of log file location-1
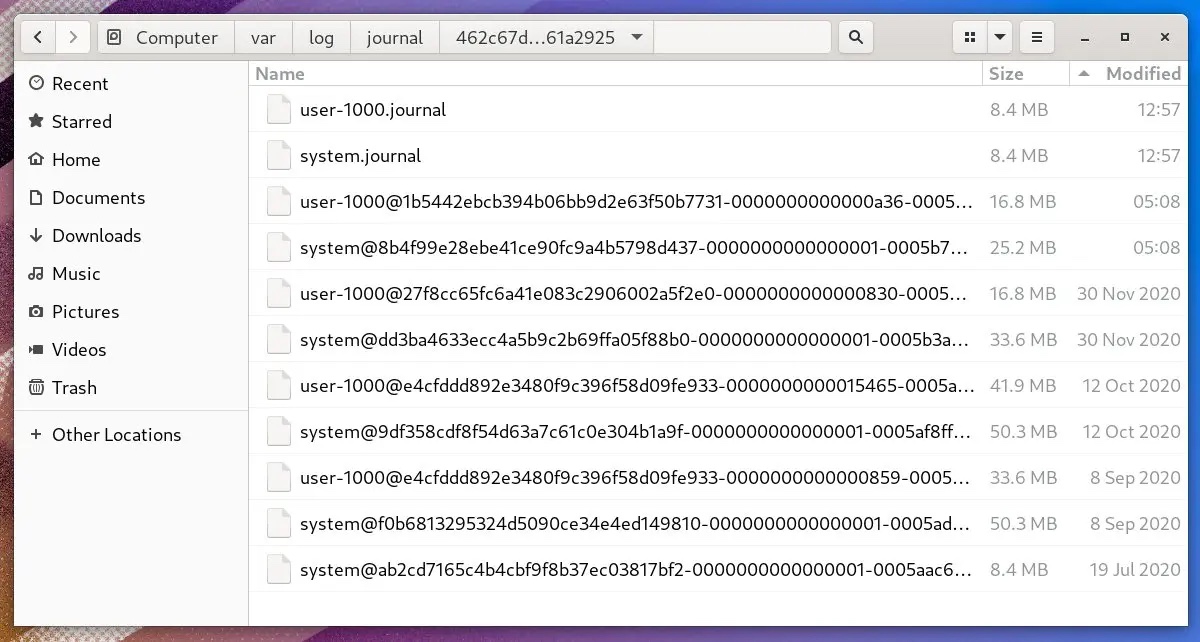
Screenshot of log file location-2
Also, please remember that depending on the system configuration, the runtime log file is stored in /run/log/journal/ . And these will be deleted on every startup.
Can I delete the log files manually?
You can, but don't do it. Instead, follow the instructions below to clear the log files to free up disk space using the journalctl tool.
How much disk space does the systemd log file occupy?
Open a terminal and run the following command.
journalctl --disk-usage
This should give you the actual number of log files in use on your system.
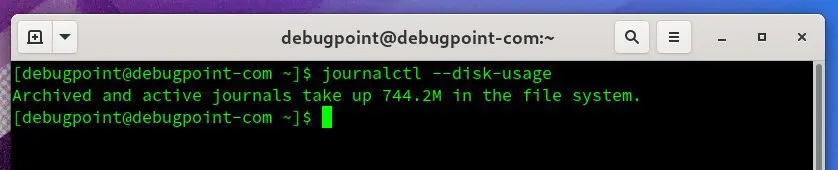
journalctl disk usage command
If you have a graphical desktop environment, you can open the file manager and browse the path /var/log/journal, and check the properties.
systemd log cleaning process
The effective way to clean log files should be through the journald.conf configuration file. Under normal circumstances, even though journalctl provides a tool to delete log files, you should not delete these files manually.
让我们来看看如何 手动 删除它,然后我将解释 journald.conf 中的配置变化,这样你就不需要时不时地手动删除文件;相反,systemd 会根据你的配置自动处理它。
手动删除
首先,你必须 flush 和 rotate 日志文件。轮换rotate是将当前活动的日志文件归档,并立即开始创建一个新的日志文件继续记录日志。冲洗flush 开关要求日志守护进程将存储在 /run/log/journal/ 中的所有日志数据冲入 /var/log/journal/,如果持久性存储被启用的话。
然后,在 flush 和 rotate 之后,你需要用 vacuum-size、vacuum-time 和 vacuum-files 选项运行 journalctl 来强制 systemd 清除日志。
例 1:
sudo journalctl --flush --rotate
sudo journalctl --vacuum-time=1s
上面这组命令会删除所有存档的日志文件,直到最后一秒。这有效地清除了一切。因此,在运行该命令时要小心。
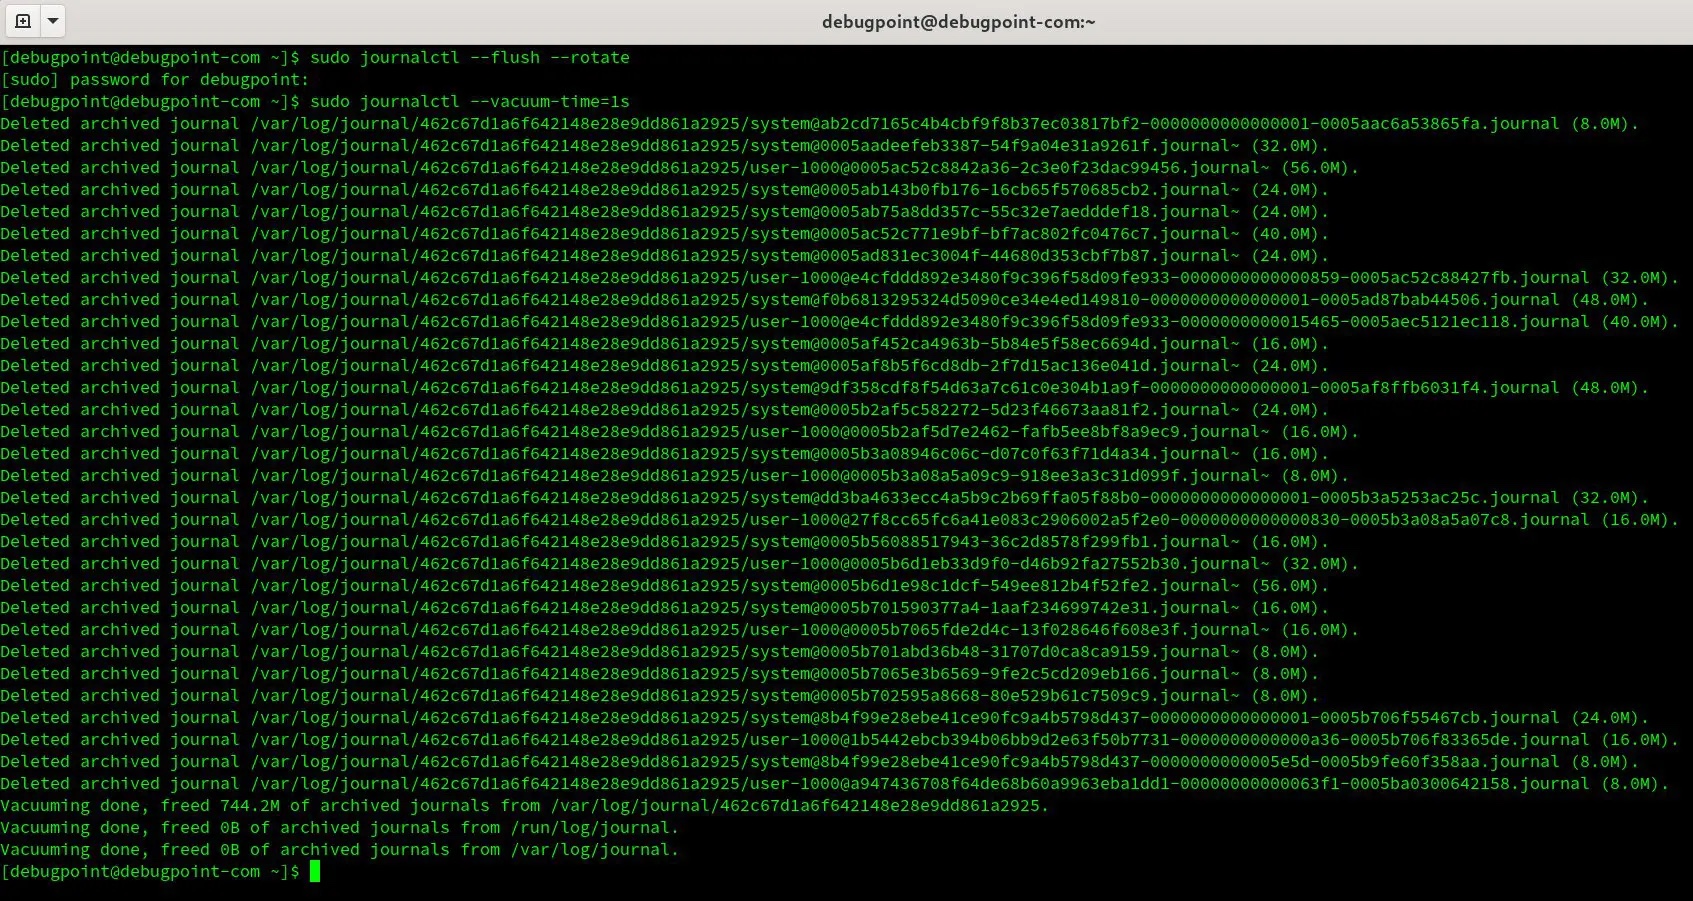
日志清理-例子
清理完毕后:
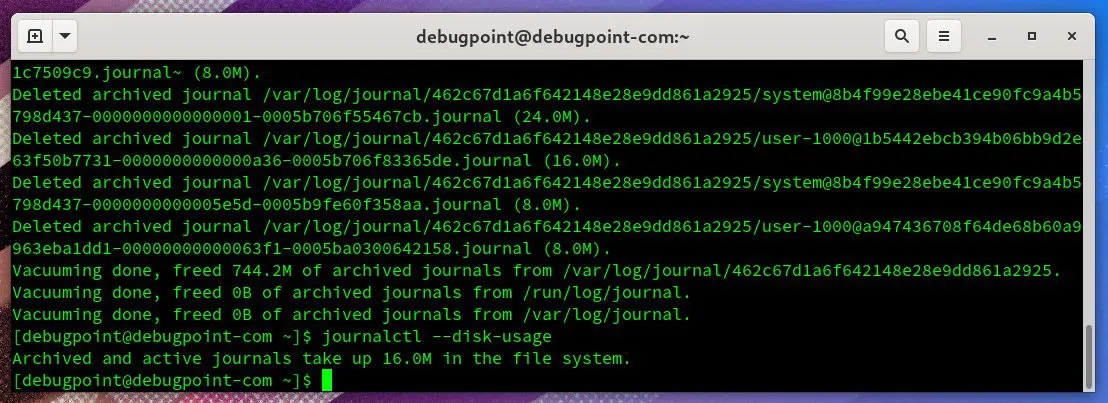
清理后--日志的占用空间
你也可以根据你的需要在 --vacuum-time 的数字后面提供以下后缀:
-
s:秒 -
m:分钟 -
h:小时 -
days:天 -
months:月 -
weeks:周 -
years:年
例 2:
sudo journalctl --flush --rotate
sudo journalctl --vacuum-size=400M
这将清除所有存档的日志文件,并保留最后 400MB 的文件。记住这个开关只适用于存档的日志文件,不适用于活动的日志文件。你也可以使用后缀,如下所示。
-
K:KB -
M:MB -
G:GB
例 3:
sudo journalctl --flush --rotate
sudo journalctl --vacuum-files=2
vacuum-files 选项会清除所有低于指定数量的日志文件。因此,在上面的例子中,只有最后两个日志文件被保留,其他的都被删除。同样,这只对存档的文件有效。
如果你愿意,你可以把两种选项结合起来,但我建议不要这样做。然而,如果同时使用两个选项,请确保先用 --rotate 选项运行。
使用配置文件自动删除
虽然上述方法很好,也很容易使用,但建议你使用 journald 配置文件来控制日志文件的清理过程,该文件存在于 /etc/systemd/journald.conf。
systemd 为你提供了许多参数来有效管理日志文件。通过组合这些参数,你可以有效地限制日志文件所占用的磁盘空间。让我们来看看。
journald.conf 参数 | 描述 | 实例 |
| 指定日志在持久性存储中可使用的最大磁盘空间 | |
| 指定在将日志条目添加到持久性存储时,日志应留出的空间量。 | |
| # SystemMaxFileSize | Controls how large a single log file can grow in persistent storage before being rotated. | SystemMaxFileSize=100M |
| RuntimeMaxUse | Specifies the maximum disk space that can be used in volatile storage (within the /run file system) . | RuntimeMaxUse=100M |
| | /run file system) and is reserved for other uses. Number of spaces. | RuntimeMaxUse=100M | ##
指定单个日志文件在被轮换之前在易失性存储(在 | |
如果你在运行中的系统的 /etc/systemd/journald.conf 文件中添加这些值,那么在更新文件后,你必须重新启动 journald。要重新启动,请使用以下命令。
sudo systemctl restart systemd-journald
核实日志文件
在你清理完文件后,检查日志文件的完整性是比较明智的。要做到这一点,请运行下面的命令。该命令显示了日志文件是否通过(PASS)、失败(FAIL)。
journalctl --verify
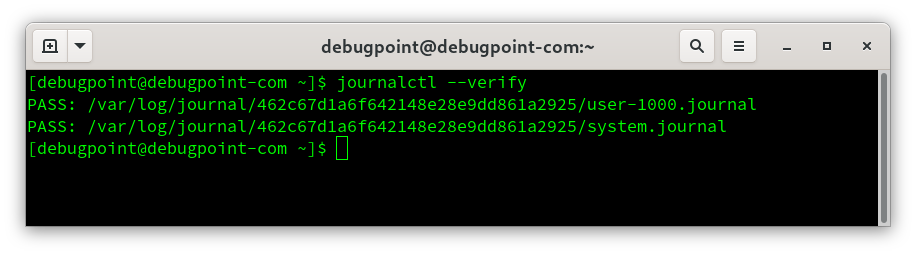
验证日志文件
总结
希望本指南能帮助你了解 systemd 日志管理流程的基本情况。通过这些,你可以通过限制空间、清除旧的日志文件来管理系统或服务器中的日志文件所使用的磁盘空间。这些只是指导性的命令,你可以通过多种方式组合这些命令来实现你的系统需求。
The above is the detailed content of systemd log maintenance guide (with examples). For more information, please follow other related articles on the PHP Chinese website!

Hot AI Tools

Undresser.AI Undress
AI-powered app for creating realistic nude photos

AI Clothes Remover
Online AI tool for removing clothes from photos.

Undress AI Tool
Undress images for free

Clothoff.io
AI clothes remover

AI Hentai Generator
Generate AI Hentai for free.

Hot Article
Hot Tools

Notepad++7.3.1
Easy-to-use and free code editor

SublimeText3 Chinese version
Chinese version, very easy to use

Zend Studio 13.0.1
Powerful PHP integrated development environment

Dreamweaver CS6
Visual web development tools

SublimeText3 Mac version
God-level code editing software (SublimeText3)
Hot Topics
 1378
1378
 52
52

 What is event ID 6013 in win10?
Jan 09, 2024 am 10:09 AM
What is event ID 6013 in win10?
Jan 09, 2024 am 10:09 AM
The logs of win10 can help users understand the system usage in detail. Many users must have encountered log 6013 when looking for their own management logs. So what does this code mean? Let’s introduce it below. What is win10 log 6013: 1. This is a normal log. The information in this log does not mean that your computer has been restarted, but it indicates how long the system has been running since the last startup. This log will appear once every day at 12 o'clock sharp. How to check how long the system has been running? You can enter systeminfo in cmd. There is one line in it.
 Logger buffer size what is log used for
Mar 13, 2023 pm 04:27 PM
Logger buffer size what is log used for
Mar 13, 2023 pm 04:27 PM
The function is to provide engineers with feedback on usage information and records to facilitate problem analysis (used during development); because users themselves do not often generate upload logs, they are useless to users. The logging buffer is a small, temporary area used for short-term storage of change vectors for redo logs to be written to disk. A log buffer write to disk is a batch of change vectors from multiple transactions. Even so, the change vector in the log buffer is written to disk in near real-time, and when the session issues a COMMIT statement, the log buffer write operation is performed in real time.
 Troubleshooting Event 7034 Error Log Issues in Win10
Jan 11, 2024 pm 02:06 PM
Troubleshooting Event 7034 Error Log Issues in Win10
Jan 11, 2024 pm 02:06 PM
The logs of win10 can help users understand the system usage in detail. Many users must have seen a lot of error logs when looking for their own management logs. So how to solve them? Let’s take a look below. . How to solve win10 log event 7034: 1. Click "Start" to open "Control Panel" 2. Find "Administrative Tools" 3. Click "Services" 4. Find HDZBCommServiceForV2.0, right-click "Stop Service" and change it to "Manual Start "
 How to use logging in ThinkPHP6
Jun 20, 2023 am 08:37 AM
How to use logging in ThinkPHP6
Jun 20, 2023 am 08:37 AM
With the rapid development of the Internet and Web applications, log management is becoming more and more important. When developing web applications, how to find and locate problems is a very critical issue. A logging system is a very effective tool that can help us achieve these tasks. ThinkPHP6 provides a powerful logging system that can help application developers better manage and track events that occur in applications. This article will introduce how to use the logging system in ThinkPHP6 and how to utilize the logging system
 How to view your medication log history in the Health app on iPhone
Nov 29, 2023 pm 08:46 PM
How to view your medication log history in the Health app on iPhone
Nov 29, 2023 pm 08:46 PM
iPhone lets you add medications to the Health app to track and manage the medications, vitamins and supplements you take every day. You can then log medications you've taken or skipped when you receive a notification on your device. After you log your medications, you can see how often you took or skipped them to help you track your health. In this post, we will guide you to view the log history of selected medications in the Health app on iPhone. A short guide on how to view your medication log history in the Health App: Go to the Health App>Browse>Medications>Medications>Select a Medication>Options&a
 Detailed explanation of log viewing command in Linux system!
Mar 06, 2024 pm 03:55 PM
Detailed explanation of log viewing command in Linux system!
Mar 06, 2024 pm 03:55 PM
In Linux systems, you can use the following command to view the contents of the log file: tail command: The tail command is used to display the content at the end of the log file. It is a common command to view the latest log information. tail [option] [file name] Commonly used options include: -n: Specify the number of lines to be displayed, the default is 10 lines. -f: Monitor the file content in real time and automatically display the new content when the file is updated. Example: tail-n20logfile.txt#Display the last 20 lines of the logfile.txt file tail-flogfile.txt#Monitor the updated content of the logfile.txt file in real time head command: The head command is used to display the beginning of the log file
 Understand the meaning of event ID455 in win10 logs
Jan 12, 2024 pm 09:45 PM
Understand the meaning of event ID455 in win10 logs
Jan 12, 2024 pm 09:45 PM
The logs of win10 have a lot of rich content. Many users must have seen the event ID455 display error when looking for their own management logs. So what does it mean? Let’s take a look below. What is event ID455 in the win10 log: 1. ID455 is the error <error> that occurred in <file> when the information store opened the log file.
 Three commands to view logs in Linux
Jan 04, 2023 pm 02:00 PM
Three commands to view logs in Linux
Jan 04, 2023 pm 02:00 PM
The three commands for viewing logs in Linux are: 1. tail command, which can view changes in file content and log files in real time; 2. multitail command, which can monitor multiple log files at the same time; 3. less command, which can Changes to the log can be viewed quickly without cluttering the screen.
