
 Operation and Maintenance
Safety
Spring Boot Actuator Endpoint Revealed: Easily Monitor Your Application
Operation and Maintenance
Safety
Spring Boot Actuator Endpoint Revealed: Easily Monitor Your Application
Spring Boot Actuator Endpoint Revealed: Easily Monitor Your Application

1. Introduction to Spring Boot Actuator endpoint
1.1 What is Actuator endpoint
Spring Boot Actuator is a sub-project used to monitor and manage Spring Boot applications. It provides a series of built-in endpoints (Endpoints) that can be used to view the status, operation status and operation indicators of the application. Actuator endpoints can be exposed to external systems in HTTP, JMX, or other forms to facilitate operation and maintenance personnel to monitor, diagnose, and manage applications.
1.2 The role and function of the endpoint
The Actuator endpoint is mainly used to implement the following functions:
- Provide applications Program health check, including database connection, cache, message queue, etc.
- Collect application metric data, such as memory usage, GC status, thread status, etc.
- View the configuration information of the application, including environment variables, system properties, properties in the configuration file, etc.
- Manage the logs of the application, including viewing and dynamically modifying the logs Level
- Get the Spring Bean information of the application, as well as the metadata of the application, etc.
- Provide the shutdown function of the application, etc.
1.3 Default configuration of Actuator endpoints
Spring Boot Actuator provides a series of built-in endpoints by default, which can be directly accessed in the development environment, but in the production environment , it may be necessary to configure permission control and exposure policy for the endpoint. Actuator endpoints can be configured through application.properties or application.yml files. For example, you can control which endpoints are exposed to external access by configuring
management.endpoints.web.exposure.include, or modify the endpoint's URL path through management.endpoints.web.base-path.
2. Detailed explanation of built-in endpoints
Spring Boot Actuator provides many built-in endpoints for viewing and managing different aspects of the application. The following is a detailed introduction to some commonly used endpoints:
2.1 /actuator/health
This endpoint is used to view the health status of the application. It checks the status of various components, such as database connections, caches, message queues, etc. The returned status includes UP (normal), DOWN (abnormal), OUT_OF_SERVICE (under maintenance), etc.
2.2 /actuator/info
This endpoint is used to display basic information of the application, such as version number, build time, etc. This information usually comes from the application's configuration files or the build system.
2.3 /actuator/metrics
This endpoint is used to view the application’s metric data. It collects data on memory usage, GC, thread status, etc. Details of a specific metric can be viewed by adding parameters, for example:
/actuator/metrics/jvm.memory.used。
2.4 /actuator/beans
This endpoint is used to view the All Spring Beans. It displays information such as the Bean's name, type, scope, and ApplicationContext to which it belongs.
2.5 /actuator/env
This endpoint is used to view the environment information of the application, including environment variables, system properties, properties in the configuration file, etc. You can view the value of a specific property by adding a parameter, for example: /actuator/env/server.port.
2.6 /actuator/loggers
This endpoint is used to view and manage the application’s logs. It displays the names and log levels of all loggers in the current application. By sending a POST request, you can also dynamically modify the log level of a Logger.
2.7 /actuator/shutdown
This endpoint is used to shut down the application. It requires configuring
management.endpoint.shutdown.enabled to true to enable it. In a production environment, it is usually necessary to control permissions on this endpoint to prevent misuse.
2.8 Other endpoints
In addition to the above common endpoints, Spring Boot Actuator also provides some other endpoints, such as:
- /actuator/auditevents:查看应用程序的审计事件
- /actuator/threaddump:获取应用程序的线程转储信息
- /actuator/heapdump:获取应用程序的堆转储信息
- /actuator/mappings:查看应用程序的 URL 映射信息
三、端点配置与定制
在实际项目中,我们可能需要对 Spring Boot Actuator 的端点进行一些定制,以满足特定的需求。本节将介绍如何对端点进行配置和定制。
3.1 控制端点访问权限
访问端点可能涉及敏感信息,我们需要对端点进行权限控制。可以通过集成 Spring Security 或自定义拦截器实现访问权限控制。例如,仅允许具有 ADMIN 角色的用户访问 /actuator/shutdown 端点。
3.2 端点暴露策略
可以通过management.endpoints.web.exposure.include 和 management.endpoints.web.exposure.exclude 配置项来控制哪些端点应该被暴露。默认情况下,仅暴露 /actuator/health 和 /actuator/info 端点。例如,暴露所有端点:
management.endpoints.web.exposure.include=*
或者仅暴露某些特定端点:
management.endpoints.web.exposure.include=health,info,metrics,env
3.3 修改端点的 URL 路径
默认情况下,所有端点的路径都是以 /actuator 开头的。我们可以通过
management.endpoints.web.base-path 配置项修改这个前缀。例如,将其更改为 /admin:
management.endpoints.web.base-path=/admin
3.4 端点响应内容定制
默认情况下,某些端点的响应内容可能不包含我们关心的所有信息。可以通过实现自定义的 EndpointFilter 来定制端点的响应内容。例如,可以为 /actuator/health 端点添加自定义的健康指标。或者通过继承并重写原有端点的方法来实现定制。
通过这些定制方法,我们可以使 Spring Boot Actuator 更好地适应实际项目需求。
四、创建自定义端点
在某些情况下,内置的端点无法满足我们的需求,因此我们需要创建自定义端点。本节将介绍自定义端点的实现方式、应用场景举例以及如何注册和配置自定义端点。
4.1 自定义端点的实现方式
要创建自定义端点,需要实现org.springframework.boot.actuate.endpoint.web.annotation.RestControllerEndpoint 接口或 org.springframework.boot.actuate.endpoint.annotation.Endpoint 接口。其中,RestControllerEndpoint 接口允许我们创建基于 Web 的端点,而 Endpoint 接口则适用于其他类型的端点。
4.2 注册和配置自定义端点
创建自定义端点后,需要将其注册到 Spring Boot Actuator。我们可以通过将自定义端点作为 Bean 注册到 Spring 上下文来实现。例如:
import org.springframework.boot.actuate.endpoint.annotation.Endpoint;
import org.springframework.boot.actuate.endpoint.annotation.ReadOperation;
import org.springframework.stereotype.Component;

@Component
@Endpoint(id = "cache-status")
public class CacheStatusEndpoint {

@ReadOperation
public CacheStatus getCacheStatus() {
// 在这里实现获取缓存状态的逻辑
// 例如,从缓存管理器中获取相关信息
CacheStatus cacheStatus = new CacheStatus();
cacheStatus.setCacheSize(100);
cacheStatus.setHitCount(200);
cacheStatus.setMissCount(50);
return cacheStatus;
}
}在上面的代码中,我们首先使用@Endpoint注解来指定端点的ID(即cache-status)。然后,我们定义了一个getCacheStatus()方法,使用@ReadOperation注解来表示这是一个读操作。此方法应返回一个表示缓存状态的对象(例如,CacheStatus类)。
接下来,我们需要定义CacheStatus类:
public class CacheStatus {

private int cacheSize;
private int hitCount;
private int missCount;

// 省略 getter 和 setter 方法
}接下来,我们需要为自定义端点配置访问权限、暴露策略等。这可以通过在 application.properties 文件中添加相关配置来实现。例如:
management.endpoints.web.exposure.include=health,info,cache-status
这将使得我们的自定义端点 /actuator/cache-status 能够被访问。
五、端点数据监控与可视化
在本节中,我们将介绍如何利用Spring Boot Actuator端点数据进行监控与可视化,从而更好地了解应用程序的运行状况。
5.1 使用JMX监控端点
Java Management Extensions(JMX)是Java平台的一种技术,允许对Java应用程序进行管理和监控。Spring Boot Actuator默认支持将端点数据暴露到JMX。要使用JMX监控端点,请确保在应用程序的application.properties或application.yml文件中启用了JMX:
management.endpoints.jmx.exposure.include=*
然后,您可以使用JMX客户端(如Java Mission Control、VisualVM等)连接到应用程序的JMX端口,查看和操作暴露的端点数据。
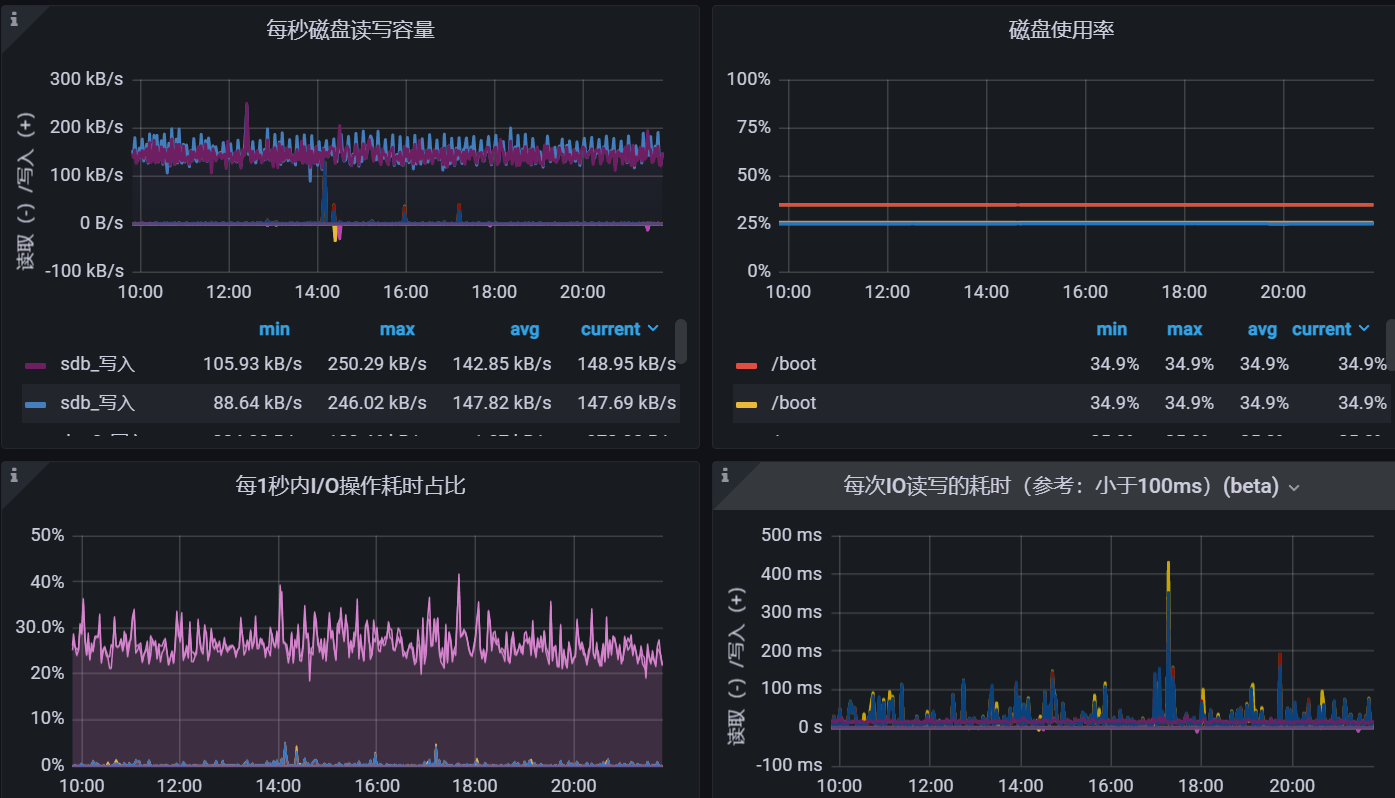
5.2 使用Prometheus和Grafana进行可视化监控
Prometheus是一个流行的开源监控系统,与Grafana这个数据可视化工具结合使用,可以为Spring Boot Actuator端点数据提供强大的可视化监控功能。
首先,需要在Spring Boot应用程序中集成Prometheus。添加相应的依赖并配置application.properties或application.yml文件,以启用Prometheus端点:
management.endpoints.web.exposure.include=*
management.metrics.export.prometheus.enabled=true
接下来,需要配置Prometheus来抓取Spring Boot应用程序的数据。在Prometheus的配置文件中(通常是prometheus.yml),添加以下内容:
scrape_configs:
- job_name: 'spring-boot-actuator'
metrics_path: '/actuator/prometheus'
static_configs:
- targets: ['localhost:8080'] # 将此处替换为Spring Boot应用程序的实际地址
最后,在Grafana中添加Prometheus数据源,并创建仪表板来展示和分析Spring Boot Actuator端点的数据。如下图所示:
5.3 集成其他监控工具
Spring Boot Actuator还可以与其他监控工具集成,例如Datadog、InfluxDB、New Relic等。要集成这些工具,通常需要在应用程序中添加相应的依赖并进行一些配置。具体的集成步骤和配置方式请参考官方文档或相关教程。
六、总结
在本文中,我们详细介绍了Spring Boot Actuator端点的相关内容,下面对全文进行概括总结。
6.1 Spring Boot Actuator端点的优势
- 提供丰富的内置端点,可以轻松获取应用程序的运行时信息,如健康状况、度量数据、环境信息等。
- 端点配置灵活,支持定制访问权限、路径和响应内容。
- 可以轻松创建自定义端点,满足特定业务需求。
- 支持与各种监控工具集成,便于进行数据监控与可视化。
6.2 注意事项和最佳实践
- 谨慎配置端点的访问权限,确保敏感信息不被泄露。
- 合理地暴露和定制端点,以满足实际需求,但避免不必要的开销。
- 使用自定义端点时,遵循单一职责原则,确保每个端点专注于一个特定功能。
- 结合实际业务场景选择合适的监控工具,进行可视化分析,以便于快速发现和解决问题。
6.3 对未来发展的展望
随着微服务和容器化技术的发展,对于应用程序的监控和管理需求将越来越复杂。Spring Boot Actuator的端点功能将继续完善,为开发者提供更加强大的监控工具。同时,我们期待更多的第三方监控工具与Actuator集成,帮助开发者更好地管理和优化其应用程序。
The above is the detailed content of Spring Boot Actuator Endpoint Revealed: Easily Monitor Your Application. For more information, please follow other related articles on the PHP Chinese website!

Hot AI Tools

Undresser.AI Undress
AI-powered app for creating realistic nude photos

AI Clothes Remover
Online AI tool for removing clothes from photos.

Undress AI Tool
Undress images for free

Clothoff.io
AI clothes remover

AI Hentai Generator
Generate AI Hentai for free.

Hot Article
Hot Tools

Notepad++7.3.1
Easy-to-use and free code editor

SublimeText3 Chinese version
Chinese version, very easy to use

Zend Studio 13.0.1
Powerful PHP integrated development environment

Dreamweaver CS6
Visual web development tools

SublimeText3 Mac version
God-level code editing software (SublimeText3)
Hot Topics


 Spring Boot Actuator Endpoint Revealed: Easily Monitor Your Application
Jun 09, 2023 pm 10:56 PM
Spring Boot Actuator Endpoint Revealed: Easily Monitor Your Application
Jun 09, 2023 pm 10:56 PM
1. Introduction to SpringBootActuator endpoint 1.1 What is Actuator endpoint SpringBootActuator is a sub-project used to monitor and manage SpringBoot applications. It provides a series of built-in endpoints (Endpoints) that can be used to view the status, operation status and operation indicators of the application. Actuator endpoints can be exposed to external systems in HTTP, JMX or other forms to facilitate operation and maintenance personnel to monitor, diagnose and manage applications. 1.2 The role and function of the endpoint The Actuator endpoint is mainly used to implement the following functions: providing health check of the application, including database connection, caching,
 Having worked in operation and maintenance for more than ten years, there have been countless moments when I felt like I was still a novice...
Jun 09, 2023 pm 09:53 PM
Having worked in operation and maintenance for more than ten years, there have been countless moments when I felt like I was still a novice...
Jun 09, 2023 pm 09:53 PM
Once upon a time, when I was a fresh graduate majoring in computer science, I browsed many job postings on recruitment websites. I was confused by the dazzling technical positions: R&D engineer, operation and maintenance engineer, test engineer... During college, my professional courses were so-so, not to mention having any technical vision, and I had no clear ideas about which technical direction to pursue. Until a senior student said to me: "Do operation and maintenance. You don't have to write code every day to do operation and maintenance. You just need to be able to play Liunx! It's much easier than doing development!" I chose to believe... I have been in the industry for more than ten years , I have suffered a lot, shouldered a lot of blame, killed servers, and experienced department layoffs. If someone tells me now that operation and maintenance is easier than development, then I will
 Spring Cloud microservice architecture deployment and operation
Jun 23, 2023 am 08:19 AM
Spring Cloud microservice architecture deployment and operation
Jun 23, 2023 am 08:19 AM
With the rapid development of the Internet, the complexity of enterprise-level applications is increasing day by day. In response to this situation, the microservice architecture came into being. With its modularity, independent deployment, and high scalability, it has become the first choice for enterprise-level application development today. As an excellent microservice architecture, Spring Cloud has shown great advantages in practical applications. This article will introduce the deployment and operation and maintenance of SpringCloud microservice architecture. 1. Deploy SpringCloud microservice architecture SpringCloud
 Do you need to learn golang for operation and maintenance?
Jul 17, 2023 pm 01:27 PM
Do you need to learn golang for operation and maintenance?
Jul 17, 2023 pm 01:27 PM
Don’t learn golang for operation and maintenance. The reasons are: 1. Golang is mainly used to develop applications with high performance and concurrent performance requirements; 2. The tools and scripting languages commonly used by operation and maintenance engineers can already meet most management and Maintenance requirements; 3. Learning golang requires a certain programming foundation and experience; 4. The main goal of the operation and maintenance engineer is to ensure the stability and high availability of the system, not to develop applications.
 What capabilities should PG database operation and maintenance tools cover?
Jun 08, 2023 pm 06:56 PM
What capabilities should PG database operation and maintenance tools cover?
Jun 08, 2023 pm 06:56 PM
Before the holidays, I collaborated with the PG China community to conduct an online live broadcast on how to use D-SMART to operate and maintain the PG database. It happened that one of my clients in the financial industry listened to my introduction and called over to chat. They are selecting database Xinchuang and have tried several domestic databases. Finally, they are going to choose TDSQL. I felt a little surprised at the time. They had been selecting domestic databases since 2020, but it seemed that the initial experience after using TDSQL was not very good. Later, after communication, I learned that they had just started using TDSQL's distributed database and found that the research and development requirements were too high, so they all chose TDSQL's centralized MYSQL instance. After using it, they found that it was very easy to use. The entire database cloud
 Tuyou Zou Yi: How to operate and maintain small and medium-sized companies?
Jun 09, 2023 pm 01:56 PM
Tuyou Zou Yi: How to operate and maintain small and medium-sized companies?
Jun 09, 2023 pm 01:56 PM
Through interviews and submissions, veterans in the field of operation and maintenance are invited to provide profound insights and collide together, with a view to forming some advanced consensus and promoting the industry to move forward better. In this issue, we invite Zou Yi, the operation and maintenance director of Tuyou Games. Mr. Zou often jokingly calls himself the operation and maintenance representative of the world's top 5 million companies. It can be seen that in his heart, he feels that the operation and maintenance construction ideas of small and medium-sized companies are different from those of large enterprises. There are differences. Today we have a few questions and ask Mr. Zou to share his journey of integrating research and operations for small and medium-sized companies. This is the 6th issue of the down-to-earth and high-level "Operation and Maintenance Forum", starting now! Question Preview Tuyou is a game company. What do you think are the unique features of game operation and maintenance? What are the biggest operational challenges you face? How did you solve these challenges? Game operation and maintenance people
 Uber Practice: Some experiences in operating and maintaining large-scale distributed systems
Jun 09, 2023 pm 04:53 PM
Uber Practice: Some experiences in operating and maintaining large-scale distributed systems
Jun 09, 2023 pm 04:53 PM
This article is an article by Uber engineer Gergely Orosz. The original address is: https://blog.pragmaticengineer.com/operating-a-high-scale-distributed-system/ In the past few years, I have been building and operating a large-scale Distributed systems: Uber’s payment system. During this period, I learned a lot about distributed architecture concepts and witnessed first-hand the challenges of running high-load and high-availability systems (a system is far from finished when it is developed, and the challenges of running it online are actually even greater). Building the system itself is an interesting endeavor. How planning systems handle 10x/100
 What is observability? Everything a beginner needs to know
Jun 08, 2023 pm 02:42 PM
What is observability? Everything a beginner needs to know
Jun 08, 2023 pm 02:42 PM
The term observability originates from the engineering field and has become increasingly popular in the software development field in recent years. Simply put, observability is the ability to understand the internal state of a system based on external outputs. IBM defines observability as: Generally, observability refers to the degree to which the internal state or condition of a complex system can be understood based on knowledge of its external output. The more observable the system is, the faster and more accurate the process of locating the root cause of a performance issue can be without the need for additional testing or coding. In cloud computing, observability also refers to software tools and practices that aggregate, correlate, and analyze data from distributed application systems and the infrastructure that supports their operation in order to more effectively monitor, troubleshoot, and debug application systems. , thereby achieving customer experience optimization and service level agreement
