 Operation and Maintenance
 Safety
 How to use journalctl to view and analyze systemd logs (with examples)
How to use journalctl to view and analyze systemd logs (with examples)

Introduction
Many people say that systemd is not good and that it has a great impact on the system. This is also a controversial topic. But you can't deny that it provides a complete set of tools to manage and troubleshoot your system. Imagine when you come across a broken system with no GUI, you could mess up booting and GRUB. In this case, you can boot from a live system, mount your Linux partition, and browse the systemd logs to find the problem.
systemd has three basic components, as follows:
-
systemd: The system and service manager of the Linux operating system. -
systemctl: This command is used to review and control the status of the systemd system and service manager. -
systemd-analyze: This command provides performance statistics on system startup and retrieves additional status and tracing information from the System and Service Manager.
In addition to these three services, systemd also provides other services, such as journald, logind, networkd, etc. In this guide, we will discuss systemd’s journald service.
journald - systemd log service
By design, systemd provides a centralized way to handle all operating system logs from processes, applications, etc. All these log events are handled by systemd's journald daemon. The journald daemon collects all logs from all over the Linux operating system and stores them as binary data in files.
There are many benefits of centrally recording events and system problems in binary data. For example, because system logs are stored in binary rather than text form, you can translate them in text, JSON objects, and more to meet various needs. In addition, since the logs are stored sequentially, it is super easy to track individual events through date/time operations on the logs.
Please remember that the log files collected by journald have thousands of lines and are constantly updated with every boot and every event. Therefore, if you have a long-running Linux operating system, the log size should be in GB. Since there are thousands of logs, it's best to filter them with basic commands to learn more about system issues.
journald configuration file
journald’s configuration file exists in the following path. It contains various flags on how logging should be done. You can take a look at this file and make the necessary changes. But I recommend not modifying this file unless you know what you are doing.
/etc/systemd/journald.conf
journald Where binary log files are stored
journald stores logs in binary format. They are saved in a directory under this path:
/var/log/journal
For example, in the following path, there is a directory that contains all system logs so far.
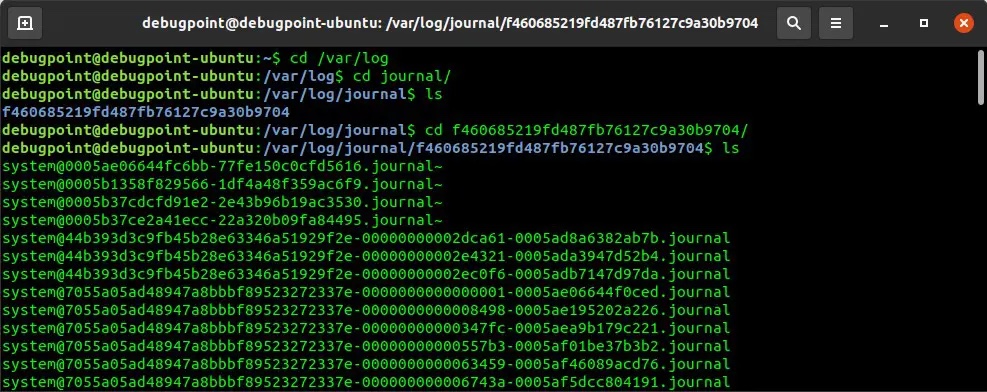
journalctl log file path
Do not use the cat command, and do not use nano or vi to open these files. They (being binary) cannot be displayed normally.
Use journalctl to view and analyze systemd logs
journald basic commands
The basic command to view journald logs is:
journalctl
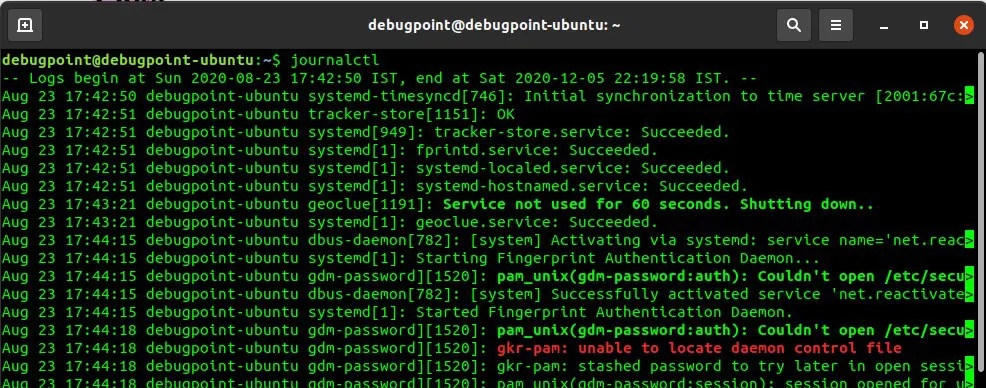
journalctl
该命令提供了所有应用程序和进程的日志条目,包括错误、警告等。它显示的列表中,最旧的日志在顶部,当前的日志在底部。你需要不断按回车键来逐行滚动浏览。你也可以使用 PAGE UP 和 PAGE DOWN 键来滚动。按 q 键可以退出这个视图。
如何以不同时区的时间查看日志条目
默认情况下,journalctl 以当前系统时区显示日志的时间。然而,你可以很容易地在命令中提供时区,将同一日志转换为不同的时区。例如,要以 UTC 查看日志,请使用以下命令:
journalctl --utc
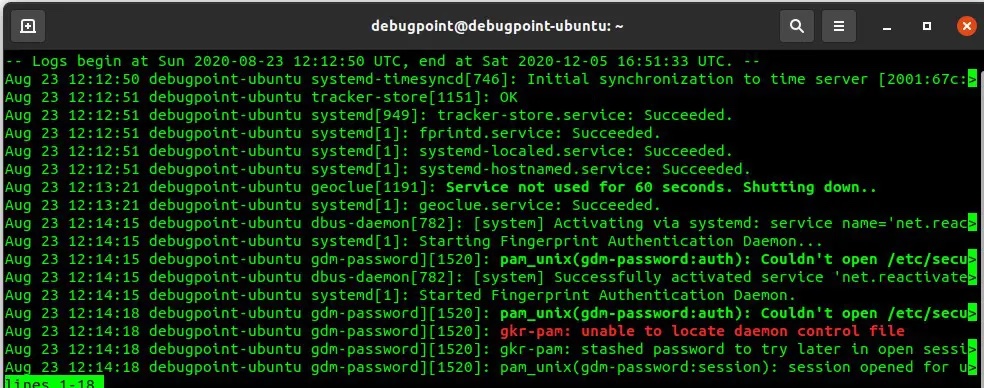
journalctl --utc
如何在日志中只查看错误、警告等信息
系统产生的日志有不同的优先级。有些日志可能是可以忽略的警告,有些可能是重要的错误。你可能想只看错误,不看警告。这也可以用下面的命令来实现。
要查看紧急系统信息,请使用:
journalctl -p 0
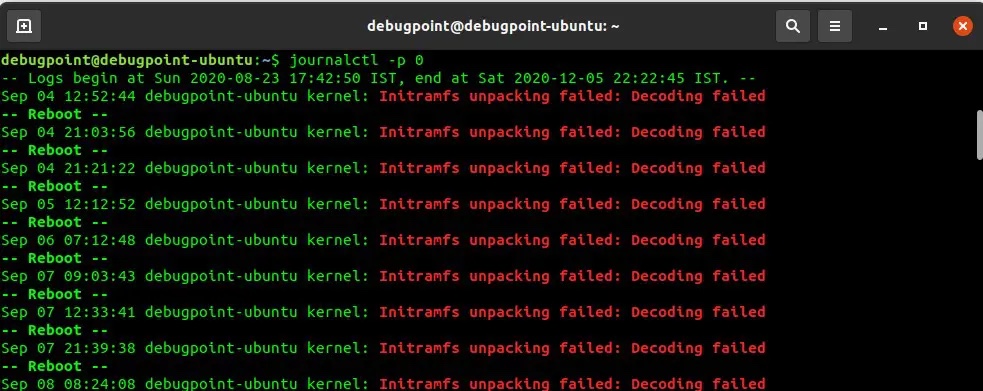
journalctl -p 0
错误代码:
0: 紧急情况
1: 警报
2: 危急
3: 错误
4: 警告
5: 通知
6: 信息
7:调试
当你指定错误代码时,它显示该等级及更高的所有信息。例如,如果你指定下面的命令,它会显示所有优先级为 2、1 和 0 的信息:
journalctl -p 2
如何查看特定启动的日志
当你运行 journalctl 命令时,它会显示当前启动的信息,即你正在运行的会话中的信息。但也可以查看过去的启动信息。
在每次重启时,日志都会持续更新。journald 会记录不同启动时的日志。要查看不同启动时的日志,请使用以下命令。
journalctl --list-boots
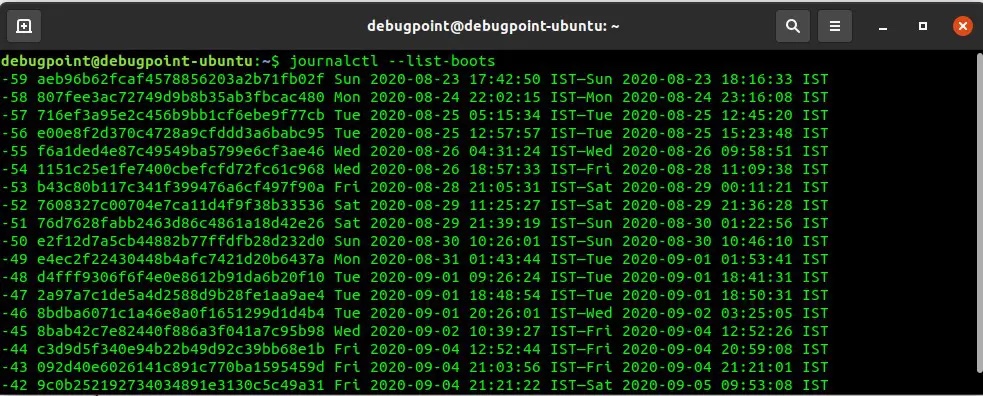
journalctl list-boots
- 第一个数字显示的是 journald 的唯一的启动跟踪号码,你可以在下一个命令中使用它来分析该特定的启动。
- 第二个数字是启动 ID,你也可以在命令中指定。
- 接下来的两个日期、时间组合是存储在相应文件中的日志的时间。如果你想找出某个特定日期、时间的日志或错误,这就非常方便了。
要查看一个特定的启动号码,你可以选择第一个启动跟踪号码或启动 ID,如下所示。
journalctl -b -45
journalctl -b 8bab42c7e82440f886a3f041a7c95b98
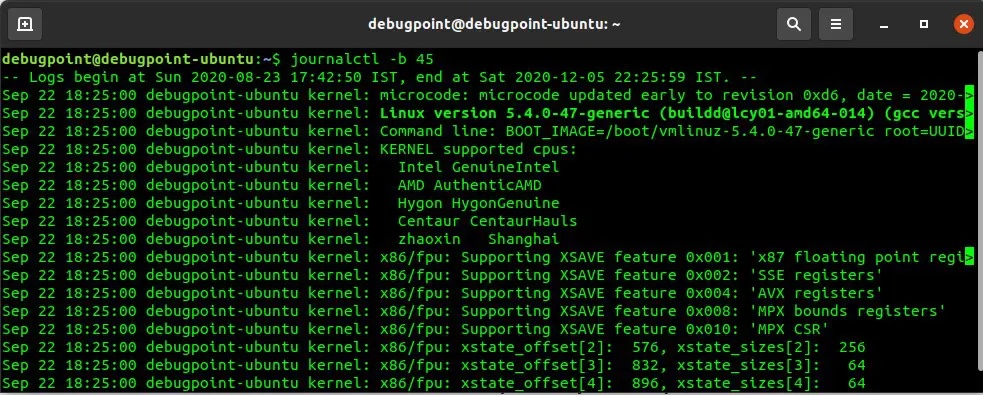
journalctl -b 45
你也可以使用 -x 选项,在显示屏上添加 systemd 错误信息的解释。在某些情况下,这是个救命稻草。
journalctl -xb -p 3
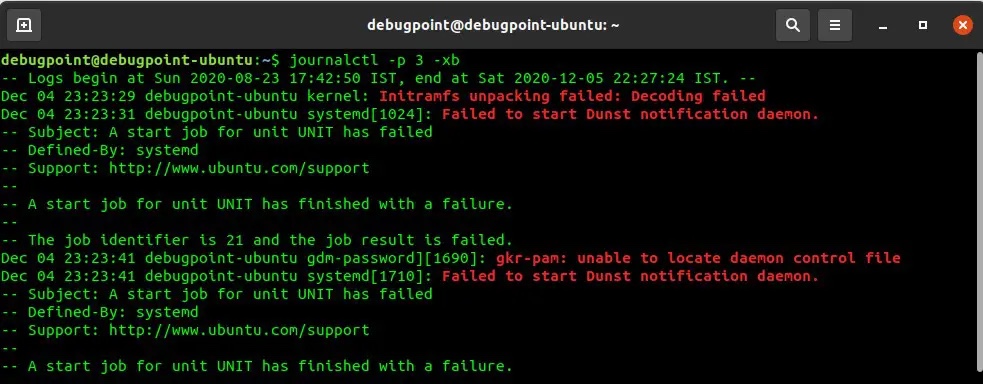
journalctl -xb
如何查看某一特定时间、日期的日志记录
journalctl 功能强大,可以在命令中提供类似英语的参数,用于时间和日期操作。
你可以使用 --since 选项与 yesterday、today、tomorrow 或 now 组合。
下面是一些不同命令的例子。你可以根据你的需要修改它们。它们是不言自明的。以下命令中的日期、时间格式为 "YYYY-MM-DD HH:MM:SS"
journalctl --since "2020-12-04 06:00:00"
journalctl --since "2020-12-03" --until "2020-12-05 03:00:00"
journalctl --since yesterday
journalctl --since 09:00 --until "1 hour ago"
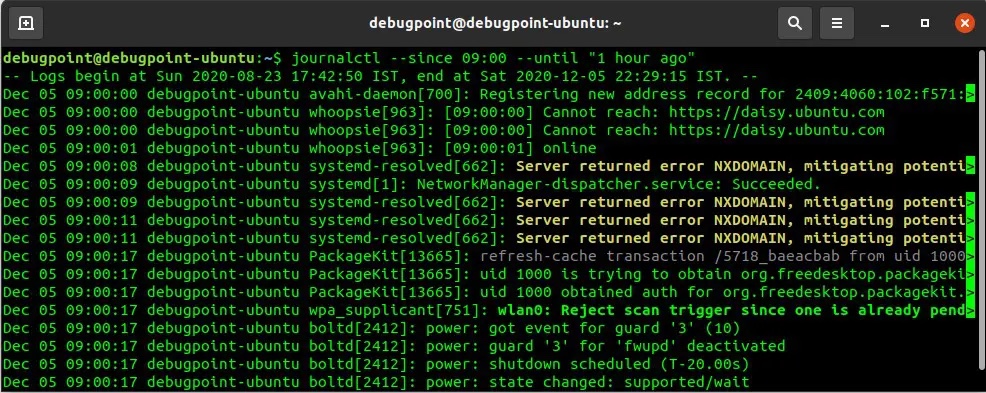
journalctl --since 09:00 --until
你也可以将上述内容与错误级别开关结合起来。
如何查看内核特定的日志记录
Linux 内核信息也可以从日志中提取出来。要查看当前启动时的内核信息,请使用以下命令:
journalctl -k
如何查看某个服务、PID 的日志
你可以从 journald 日志中过滤出某个 systemd 服务单元的特定日志。例如,如果要查看 NetworkManager 服务的日志,请使用下面的命令。
journalctl -u NetworkManager.service
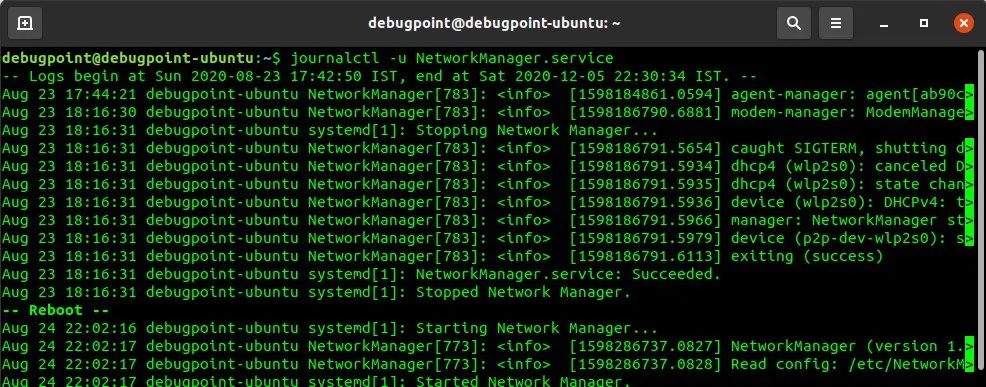
journalctl NetworkManager service
如果你不知道服务名称,可以使用下面的命令来列出系统中的 systemd 服务。
systemctl list-units --type=service
如何查看用户、组的日志
如果你正在分析服务器日志,在多个用户登录的情况下,这个命令很有帮助。你可以先用下面的命令从用户名中找出用户的 ID。例如,要找出用户 debugpoint 的 ID:
id -u debugpoint
然后使用 _UID 选项指定该 ID 与来查看该用户产生的日志。
journalctl _UID=1000 --since today
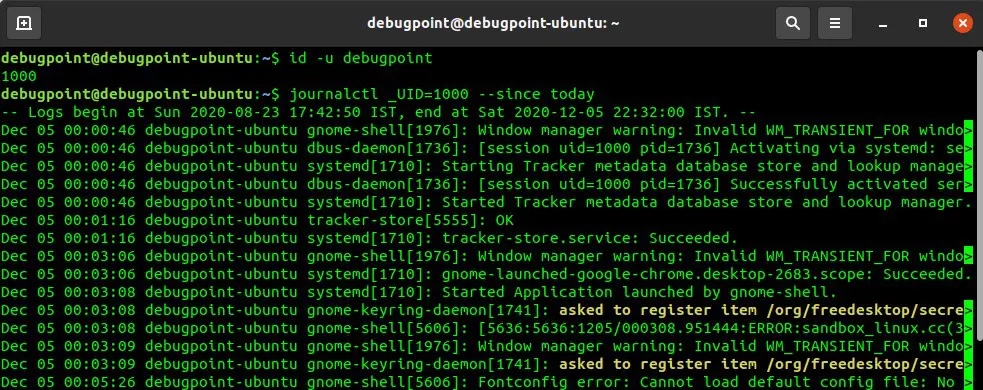
journalctl _UID
同样地,使用 _GID 选项也可以查到用户组的情况。
如何查看一个可执行文件的日志
你也可以查看某个特定程序或可执行文件的日志。例如,如果你想找出 gnome-shell 的信息,你可以运行以下命令。
journalctl /usr/bin/gnome-shell --since today
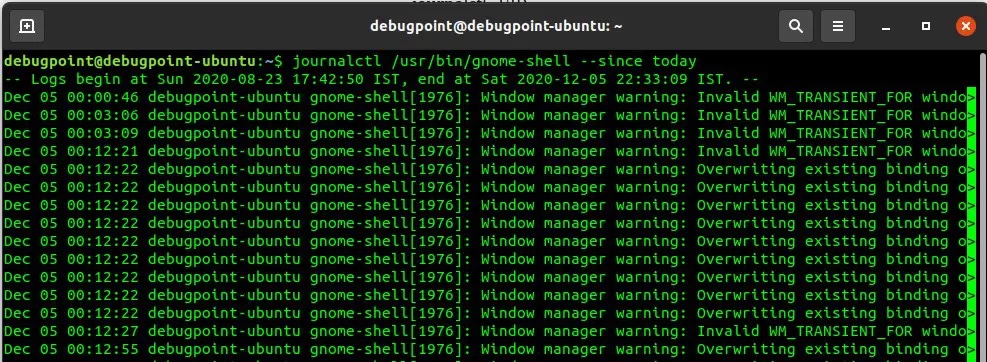
journalctl gnome-shell
Conclusion
Hope this guide can help you use journalctl to view and analyze systemd logs on your Linux desktop or server and troubleshoot. If you know how to use these commands, systemd log management is very powerful and can make your life easier when debugging. All major Linux distributions now use systemd. Ubuntu, Debian, Fedora, and Arch all use systemd as their default operating system component. If you want to know about Linux distributions that do not use systemd, you may want to look at MX-Linux, Gentoo, Slackware, Void Linux.
The above is the detailed content of How to use journalctl to view and analyze systemd logs (with examples). For more information, please follow other related articles on the PHP Chinese website!

Hot AI Tools

Undresser.AI Undress
AI-powered app for creating realistic nude photos

AI Clothes Remover
Online AI tool for removing clothes from photos.

Undress AI Tool
Undress images for free

Clothoff.io
AI clothes remover

Video Face Swap
Swap faces in any video effortlessly with our completely free AI face swap tool!

Hot Article

Hot Tools

Notepad++7.3.1
Easy-to-use and free code editor

SublimeText3 Chinese version
Chinese version, very easy to use

Zend Studio 13.0.1
Powerful PHP integrated development environment

Dreamweaver CS6
Visual web development tools

SublimeText3 Mac version
God-level code editing software (SublimeText3)

Hot Topics
 1386
1386
 52
52
 How to use docker desktop
Apr 15, 2025 am 11:45 AM
How to use Docker Desktop? Docker Desktop is a tool for running Docker containers on local machines. The steps to use include: 1. Install Docker Desktop; 2. Start Docker Desktop; 3. Create Docker image (using Dockerfile); 4. Build Docker image (using docker build); 5. Run Docker container (using docker run).
 Difference between centos and ubuntu
Apr 14, 2025 pm 09:09 PM
The key differences between CentOS and Ubuntu are: origin (CentOS originates from Red Hat, for enterprises; Ubuntu originates from Debian, for individuals), package management (CentOS uses yum, focusing on stability; Ubuntu uses apt, for high update frequency), support cycle (CentOS provides 10 years of support, Ubuntu provides 5 years of LTS support), community support (CentOS focuses on stability, Ubuntu provides a wide range of tutorials and documents), uses (CentOS is biased towards servers, Ubuntu is suitable for servers and desktops), other differences include installation simplicity (CentOS is thin)
 What to do if the docker image fails
Apr 15, 2025 am 11:21 AM
Troubleshooting steps for failed Docker image build: Check Dockerfile syntax and dependency version. Check if the build context contains the required source code and dependencies. View the build log for error details. Use the --target option to build a hierarchical phase to identify failure points. Make sure to use the latest version of Docker engine. Build the image with --t [image-name]:debug mode to debug the problem. Check disk space and make sure it is sufficient. Disable SELinux to prevent interference with the build process. Ask community platforms for help, provide Dockerfiles and build log descriptions for more specific suggestions.
 How to view the docker process
Apr 15, 2025 am 11:48 AM
Docker process viewing method: 1. Docker CLI command: docker ps; 2. Systemd CLI command: systemctl status docker; 3. Docker Compose CLI command: docker-compose ps; 4. Process Explorer (Windows); 5. /proc directory (Linux).
 What computer configuration is required for vscode
Apr 15, 2025 pm 09:48 PM
VS Code system requirements: Operating system: Windows 10 and above, macOS 10.12 and above, Linux distribution processor: minimum 1.6 GHz, recommended 2.0 GHz and above memory: minimum 512 MB, recommended 4 GB and above storage space: minimum 250 MB, recommended 1 GB and above other requirements: stable network connection, Xorg/Wayland (Linux)
 Detailed explanation of docker principle
Apr 14, 2025 pm 11:57 PM
Docker uses Linux kernel features to provide an efficient and isolated application running environment. Its working principle is as follows: 1. The mirror is used as a read-only template, which contains everything you need to run the application; 2. The Union File System (UnionFS) stacks multiple file systems, only storing the differences, saving space and speeding up; 3. The daemon manages the mirrors and containers, and the client uses them for interaction; 4. Namespaces and cgroups implement container isolation and resource limitations; 5. Multiple network modes support container interconnection. Only by understanding these core concepts can you better utilize Docker.
 What is vscode What is vscode for?
Apr 15, 2025 pm 06:45 PM
VS Code is the full name Visual Studio Code, which is a free and open source cross-platform code editor and development environment developed by Microsoft. It supports a wide range of programming languages and provides syntax highlighting, code automatic completion, code snippets and smart prompts to improve development efficiency. Through a rich extension ecosystem, users can add extensions to specific needs and languages, such as debuggers, code formatting tools, and Git integrations. VS Code also includes an intuitive debugger that helps quickly find and resolve bugs in your code.
 How to switch Chinese mode with vscode
Apr 15, 2025 pm 11:39 PM
VS Code To switch Chinese mode: Open the settings interface (Windows/Linux: Ctrl, macOS: Cmd,) Search for "Editor: Language" settings Select "Chinese" in the drop-down menu Save settings and restart VS Code


