Financial event analysis and application based on pre-trained models

1. The main tasks of financial event analysis
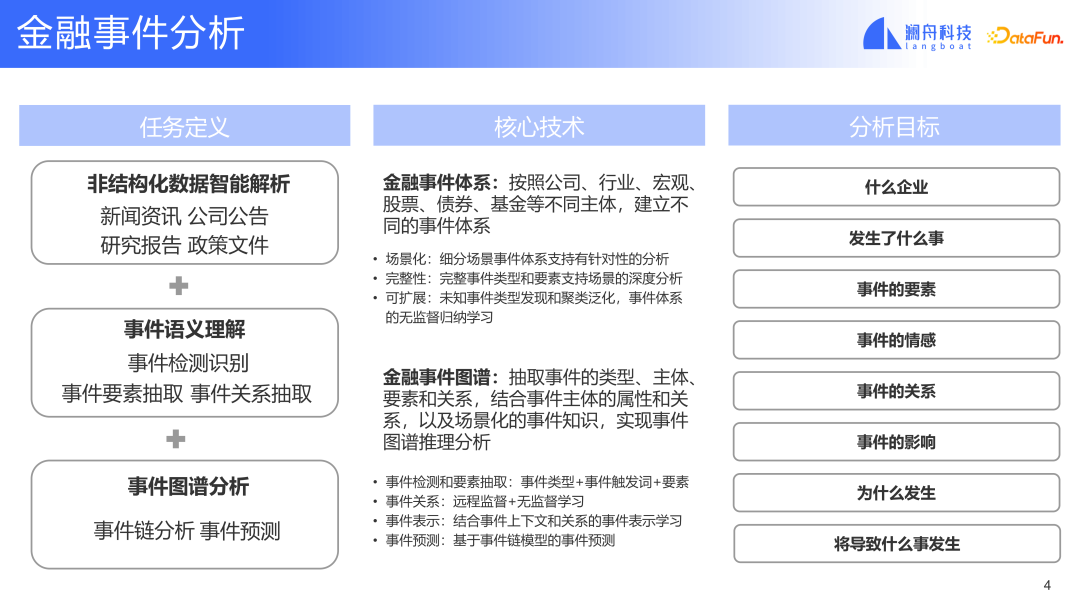
Financial event analysis The main tasks can be divided into three parts:
① The first part is the intelligent analysis of unstructured data. Information in the financial field has its own unique features compared with Internet information. Information in the financial field often exists in unstructured form, and there are some special file formats, such as PDF, which poses a greater challenge to extracting clean and accurate data from files or data. The PDF format is a typesetting and printing format and does not have as clear paragraphs as other file types. PDF is more for typesetting, so there is only some location information in the file. It is more challenging to parse accurately formatted and semantically clear text from unstructured data. Moreover, when the format semantics in the document are unclear, event analysis will bring noise, and these dirty data will cause a lot of interference in model training and inference. Therefore, in order to improve the accuracy of the model, the unstructured data should be parsed first.
② The second part is the understanding of event semantics, which is a technically important part. This mainly involves event detection, event element extraction and event relationship extraction.
③ Based on the understanding of events, the third module that is more important in the task is introduced, event graph analysis, which includes event chain analysis and event prediction.
In order to complete the above tasks, two more important systems are introduced. The first is the financial event system. A financial event system includes relevant entities in the financial field, and these entities also have different application scenarios. In order to better support these subjects and scenarios, a corresponding event system needs to be established, which involves a lot of domain knowledge and requires domain experts to provide corresponding knowledge as input. This will help us build a more complete and scientific system that can cover corresponding scenarios. Of course, in addition to expert knowledge, technology will also be needed for inductive learning, which can also provide a complete scenario-based and scalable event system.
Because the introduction of expert knowledge is mainly for the more important events in the scene. For some medium and long-tail events, it is mainly solved by some technologies based on learning. With the financial event graph, we combine event extraction technology. After event extraction, event relationship classification, and learning event representation, we can construct a graph for analysis and prediction.
With clear tasks and technical support, we can process news or documents and summarize and answer many questions. For example, what type of event occurred in which company, and what elements were involved in the event, such as common elements time, location, people, or elements related to the event type. For example, the event "company stock issuance" includes the elements issuance price, Circulation etc. In addition, we can also pay attention to this information, such as people's evaluation of this event (sentiment analysis). and predictions of what will happen to the company in the future after certain types of events occur. If you can answer the above questions, it will be valuable in many scenarios.
Let’s look at a specific example.
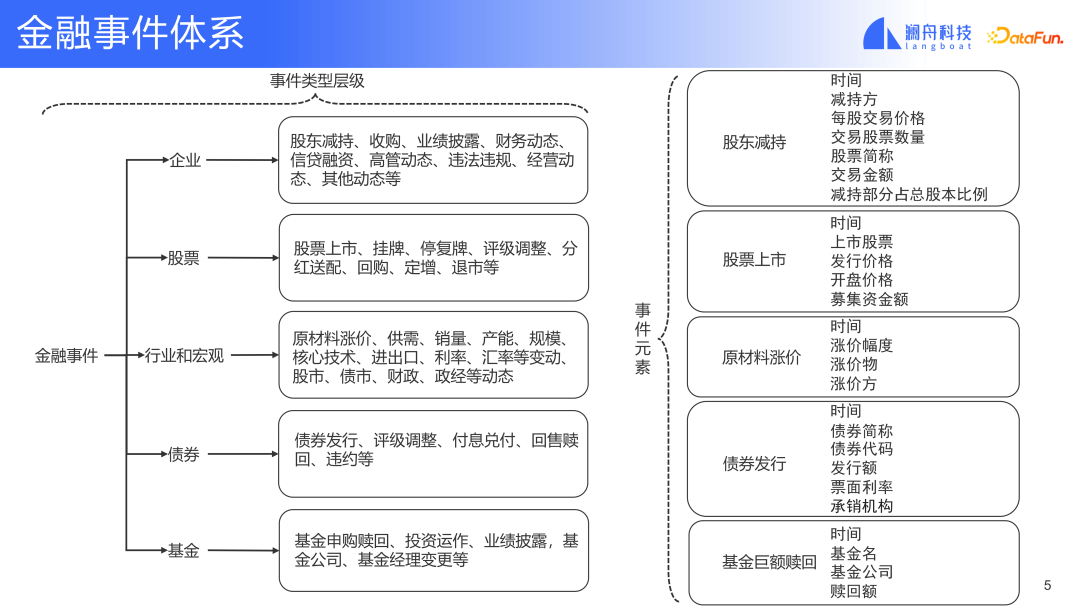
The above figure divides the financial event system into two levels. The first level has five categories, mainly based on specific objects. Distinguish, such as corporate events, stock events, industry and macro events, debt events and fund events. Different event types are defined for different event objects. These are the most common objects in finance. In the second level, we further subdivide each type of object. For example, common types of events in a company, such as shareholder reduction, etc. (refer to the picture above). Take events such as shareholders reducing their holdings as an example. The event elements it contains include the time of the reduction, the shareholders who reduced their holdings, the transaction price at the time of the reduction, and other information. Defining a complete event system that is targeted to the scenario is an important prerequisite for event analysis to achieve its goals. The degree of detail in the definition of the event system will determine the degree of fine-grained event information that the final event analysis can achieve.
#The event graph is introduced below.
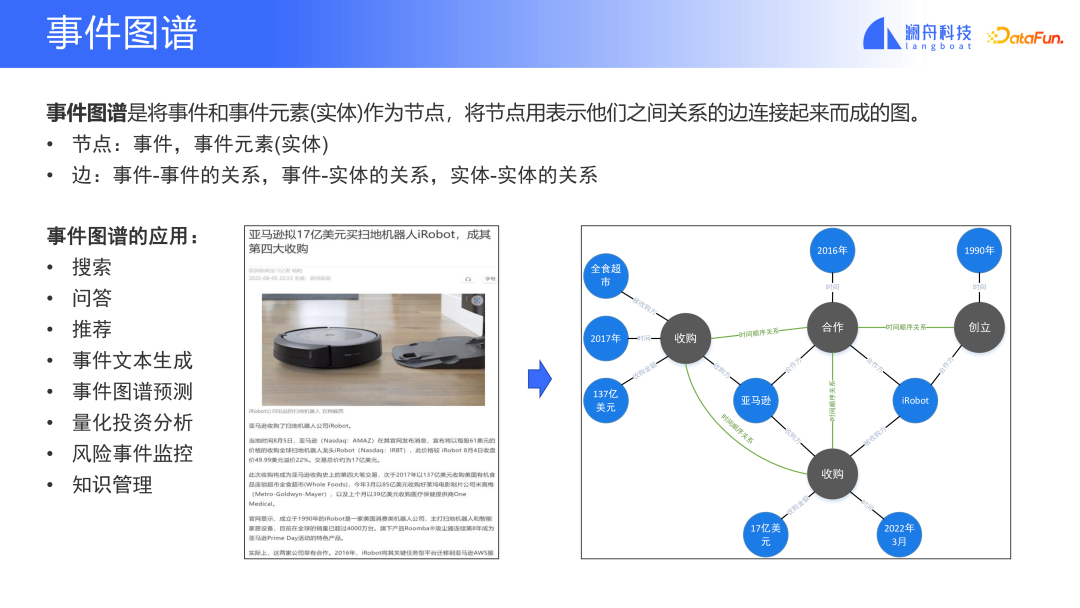
Event graphs belong to graphs and contain nodes and edges. In the event graph, event nodes can be events or entities in the events, such as companies. An edge is the relationship between events, or between events and entities, or between entities.
Let’s look at an example. The picture above is a news article introducing Amazon’s acquisition of iRobot. A total of four events were described in this news report, two of which were acquisitions, occurring at different times. The other two are the events of founding a company and the events of cooperation. These events are connected by the chronological sequence of their occurrence. In addition to events, this news also contains other entities and times, and these entities and times are also connected by corresponding relationships.
#In this way, it looks like an unstructured web page information. By parsing out the text and paragraphs in the document, performing semantic analysis on the paragraphs, and extracting event entities and relationships. , we can construct an event graph. That is to convert unstructured data into structured information. With structured information, it is easier to understand and process the information. Such information can be used in information acquisition scenarios such as search and question and answer, or in business scenarios such as risk monitoring and quantitative investment in the financial field.
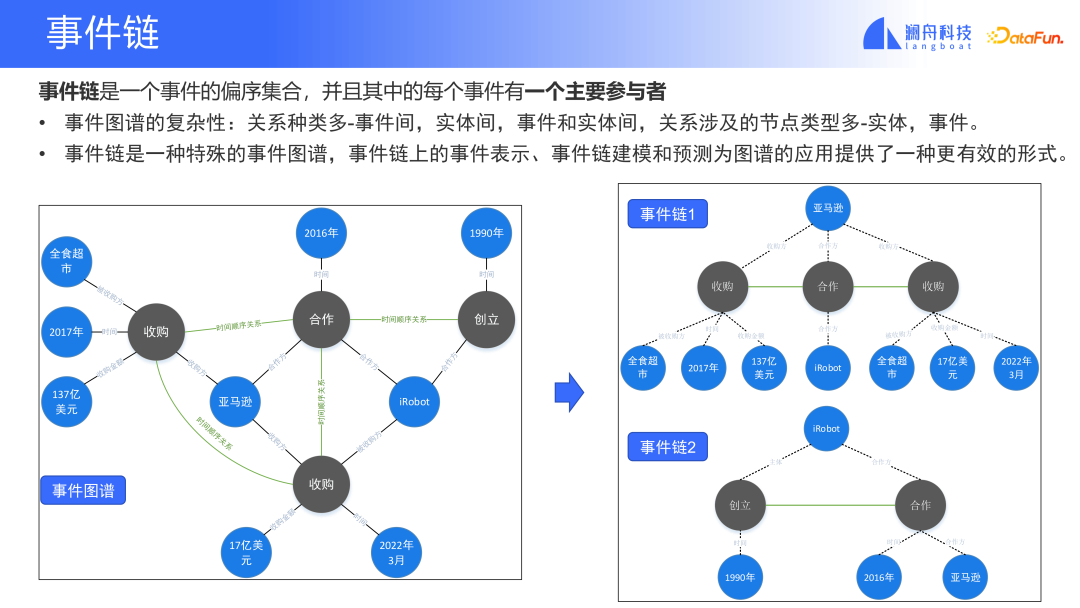
Event chain is a special event graph and a simplified mode of the event graph. It mainly focuses on a series of events that occur to a participant and the relationship between events. As can be seen from the above figure, the event graph on the left can be simplified into the two event chains on the right. The event chain only contains simplified nodes, and other elements can be regarded as attribute information of the event chain. This simplification is helpful for the practical application of event graphs. After the relationships and nodes of the event graph are simplified, the model's learning and processing of the graph only focuses on one kind of node and one kind of relationship between events, which reduces the complexity of this problem. Although simplified, the main information in the event will still be retained, such as event type, event subject and other information.
Let’s look at how an event chain is predicted.
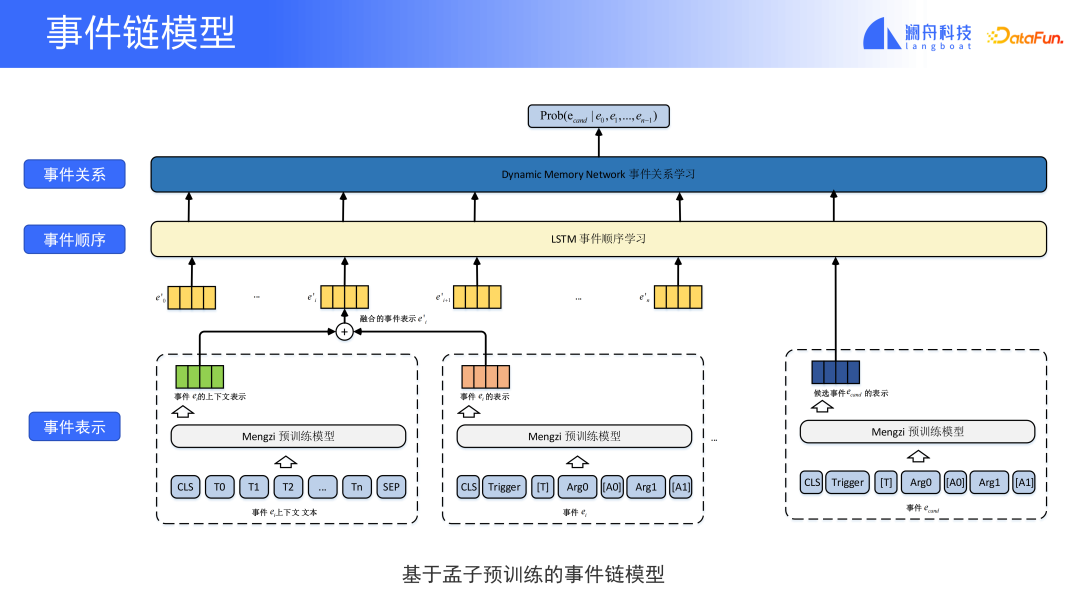
#The above picture is a prediction model of an event chain. It mainly consists of three parts. The first part is event representation, where there are current events, historical events and ultimately the events in the text that we want to predict. Historical events and events to be predicted, the trigger words and event elements they represent can be spliced together to better capture historical information. Combining the context representation and historical representation of events, we enter the second part, the sequence representation of events. Here, an LSTM network structure is used, which can capture the temporal relationship between events and integrate event sequence information into Event representation comes in. Finally, event representations containing chronological relationships are fed into a dynamic network, which can be used to predict candidate events and events in the given news. For example, if there are dozens of candidate event types, then we can predict which event may be a larger event type that will happen to this subject in the future based on the event types we have seen in the current news. The result is a distribution of event types.
What needs to be emphasized here is that the prediction results of this model are not to predict events that will definitely occur in the company in the future, but to provide such auxiliary information for analysis, prediction, Provide basis for research and judgment.
#The event chain and event prediction mentioned above are predictions and judgments about situations that have not yet occurred. Event prediction can actually provide some useful help for events that have already occurred.
Let’s look at another example. This example is based on events that have already occurred to provide some useful help.
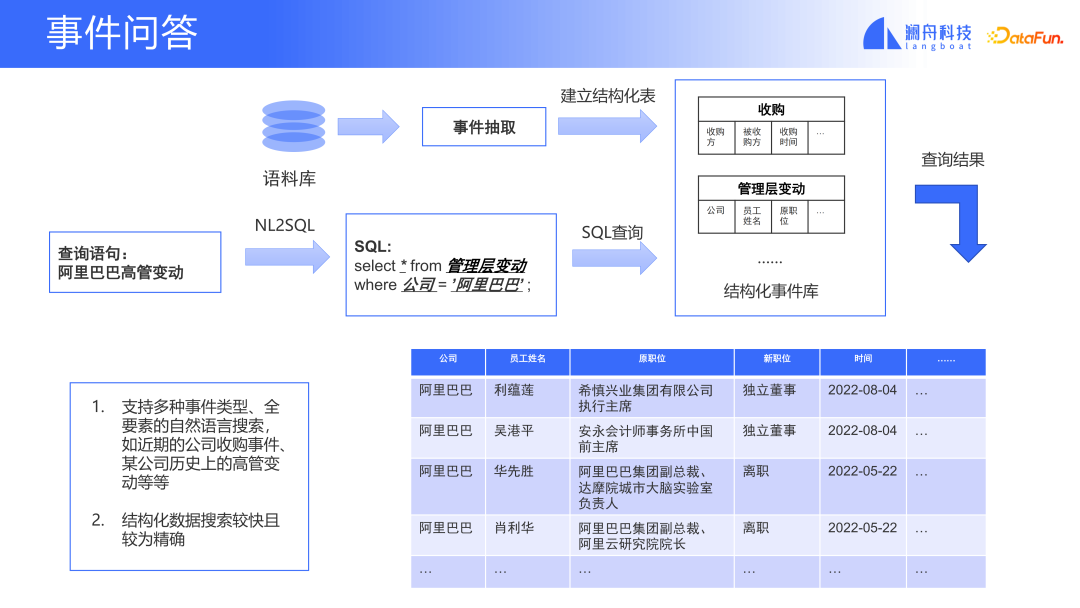
This kind of event question and answer based on the event library can support natural language search for events. We first extract from the corpus and build a structured event library. Each type of event will create a table. Each field in the table represents different event elements. Combined with NL2SQL technology, the query statement can be converted into a database query statement. In this way we can find the exact event type in the table we just created. This is different from the experience of searching for events with the general search engines currently on the market. The results returned by the search engine are many kinds of news about this event type. Even if relevant news is found, the result you see is a complete report rather than specific information about a specific event. Through event Q&A based on the event database, we can conduct Q&A searches for events more accurately.
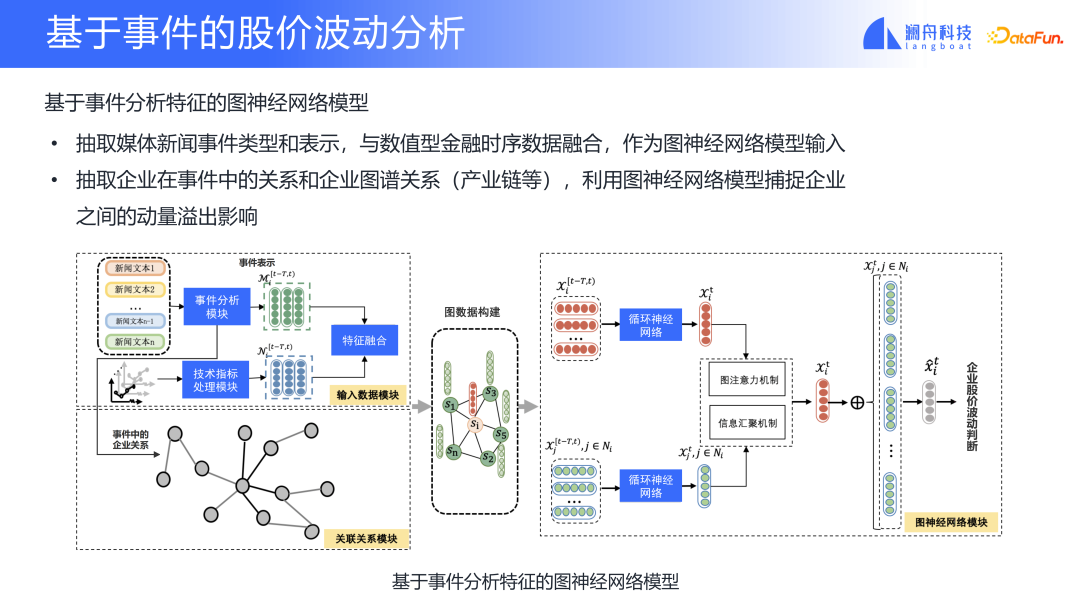
Through the example above, you can see how event analysis can be performed in specific scenarios. The stock price fluctuations of companies are the focus of the market. Event-based stock price fluctuations are also a scenario where NLP and the financial field are combined in event analysis, which can realize the transformation of market information and stock price fluctuations. The figure above shows two features in the model. One type represents a specific enterprise, and the other type represents the relationship between enterprises. We introduce event analysis to extract event types and different companies involved in the event. The extracted event types and two types of information that the company can provide, one is the representation of the event, which can become a feature and be integrated with the company's features. The relationship between enterprises and events can construct the association relationship module between enterprises. Then add existing features, such as enterprise-specific technical indicators or enterprise relationship maps. Combining the two we can construct a graph with enterprise information and relationship information. Based on this graph, we use Graph Attention Network to capture the impact of the relationship between companies on the stock price fluctuation performance of companies. Using stock price fluctuations as the target of model learning to train the model, the model network structure we obtained can achieve a judgment on the future characteristics of the company from features such as the news industry map and corporate relationship map. At the same time, through the analysis of the Attention model, we can also You can know which modules the fluctuations mainly come from, whether it is an event type module or an event relationship module. And the modeling of relationships between enterprises can also analyze how this impact is spread among related enterprises. This can also be called the utility of momentum spillover in the financial field.
#Comprehensive of the various event analysis technologies and scenarios we introduced earlier. We summarized a complete event analysis framework. (As shown below)
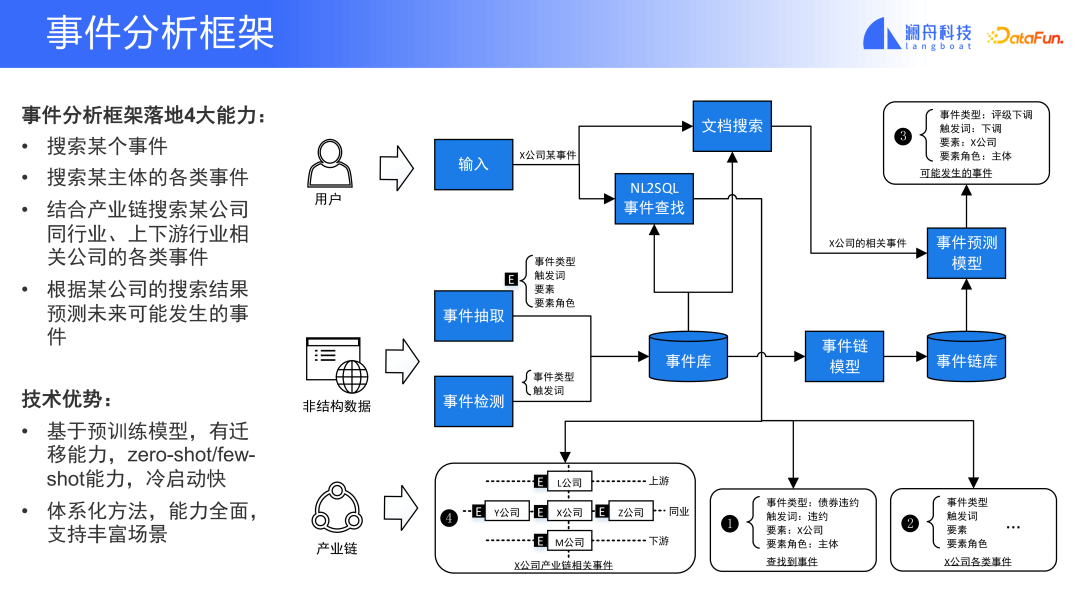
It provides several major capabilities:
① First, it can search for a certain event or various events of a certain subject.
② Secondly, it can provide search for various related events of a company in the same industry through the industrial chain, which can be an industrial chain or a company chain.
③ This framework can also predict possible future events based on a company’s search results.
The advantage of this framework is that it is based on a pre-trained model, has the ability to transfer learning, can support zero-shot/few-shot training, and has a fast cold start . Moreover, this systematic method has relatively comprehensive capabilities and can support a variety of scenarios.
#Not all scenarios require all modules in the framework, and the modules can be split out and used individually according to needs.
2. Financial event analysis technology
The two more important contents in financial event analysis technology are events. Detection and event extraction.
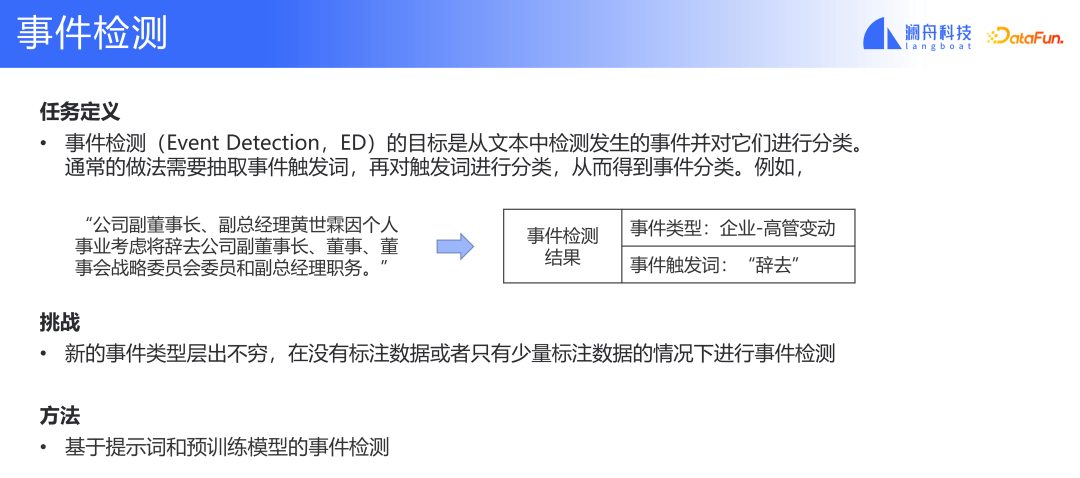
The goal of the event detection task is to extract events from text and classify them. Usually, trigger words are extracted for event detection, but there are also some methods for event detection without trigger word extraction. The challenge for this type of problem is the labeling of trigger words, or when problems such as semantic migration, event splitting, and event definition changes occur, we need to re-label the data. This type of problem often occurs in actual scenarios. Although we have our own set of event detection solutions, when applied to different fields or faced with different customer needs, their event systems are very different. How to combine existing models and data to better Supporting changes in the event system is the biggest challenge we currently face. The current approach is event detection based on cue words and pre-trained models. According to the prompt of the event type, we can better perform data migration or model training in few-shot scenarios.
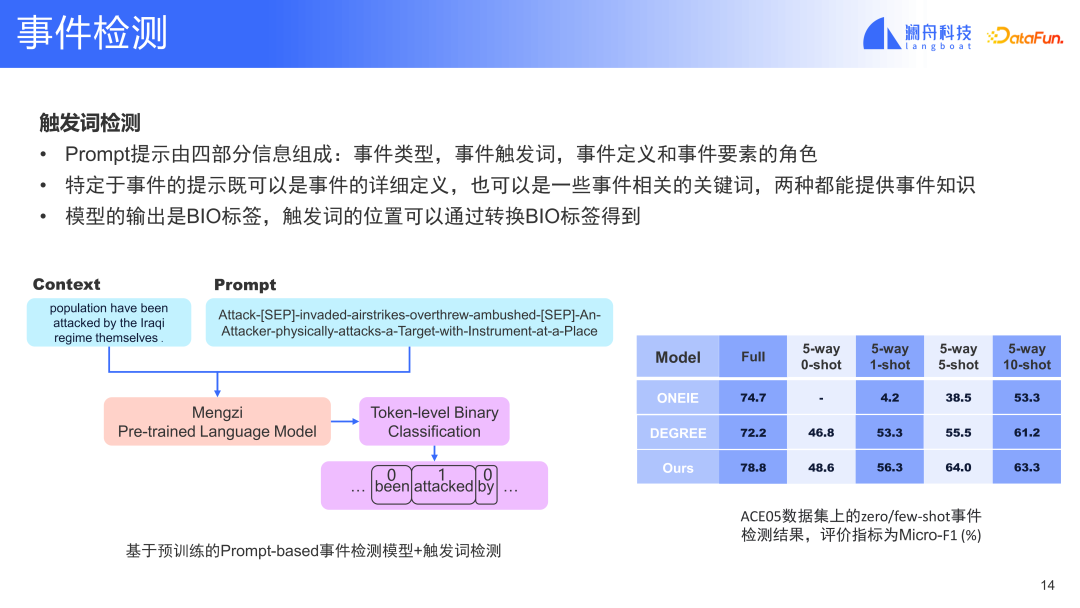
The above figure shows the model and method based on trigger words. According to the prompt of the event type, the input of the model can be annotated at the token level, so that the trigger words of the corresponding events can be extracted. If the trigger word is transformed based on the current Prompt, the corresponding event type and trigger word can be changed accordingly. Through data comparison on public data sets, it can be seen that in the full amount of data, the performance of our model has been greatly improved compared to previous methods. Even in the case of few-shot, the performance of our model is better than other models. .
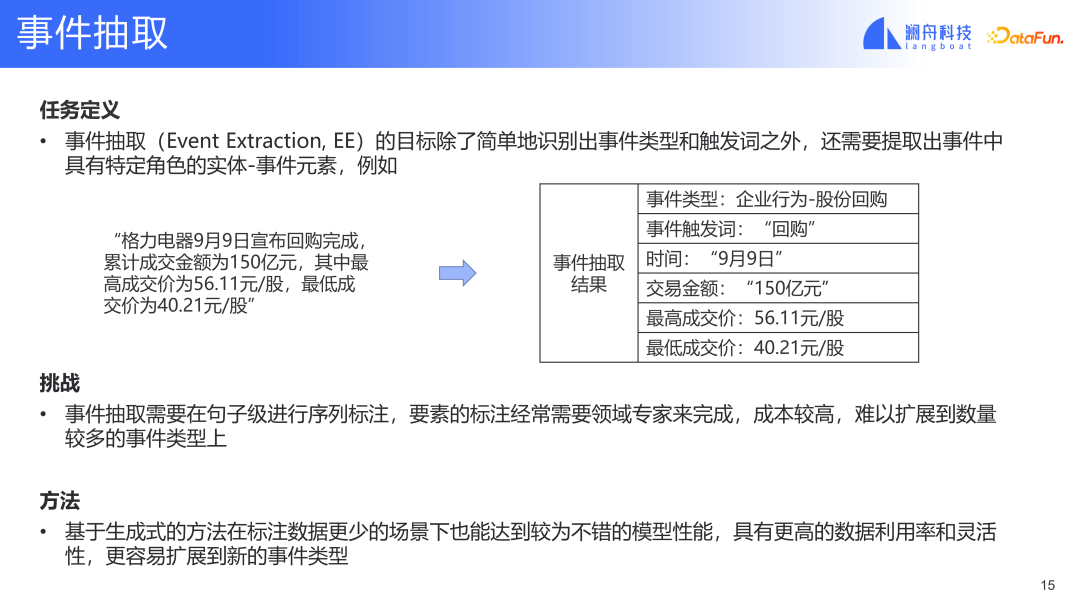 #The event extraction task is an extension of the event detection task function. It not only identifies the event type and trigger words, but also extracts the corresponding elements in the event. This has a greater effect on scenarios where event analysis requires relatively complete information. The example in the above figure can extract more fine-grained information. The challenges of event extraction include that in a complete event system, there will be many event elements, data annotation needs domain experts to complete, the cost is relatively high, and it is difficult to expand to many event types. Our current solution is to use pre-trained models and prompts. The generative method based on
can achieve good model performance in scenarios with less annotated data, and has higher data utilization and flexibility. , making it easier to extend to new event types.
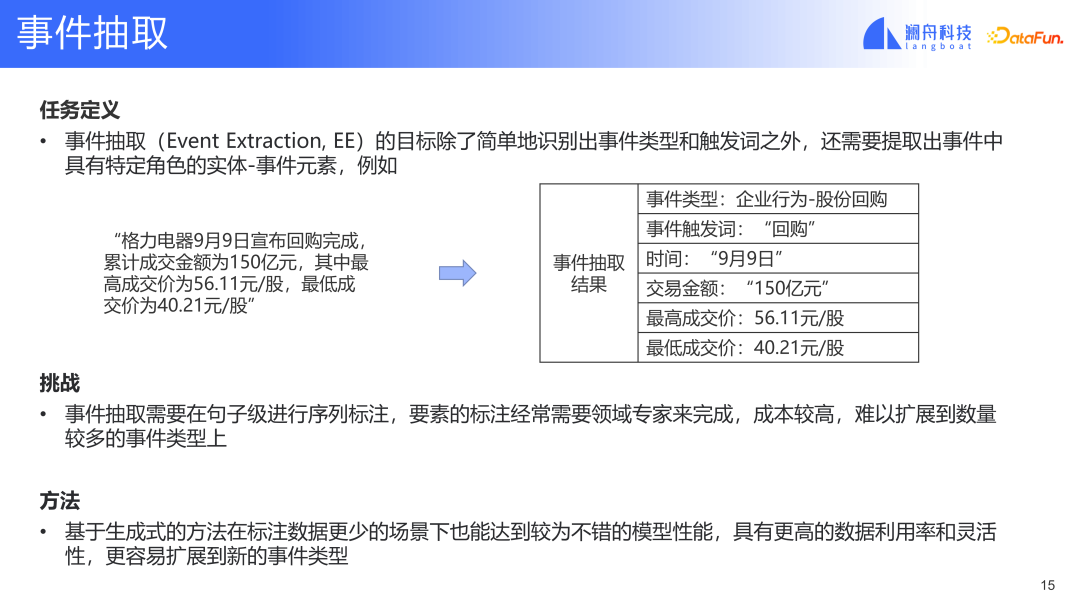 #The event extraction task is an extension of the event detection task function. It not only identifies the event type and trigger words, but also extracts the corresponding elements in the event. This has a greater effect on scenarios where event analysis requires relatively complete information. The example in the above figure can extract more fine-grained information. The challenges of event extraction include that in a complete event system, there will be many event elements, data annotation needs domain experts to complete, the cost is relatively high, and it is difficult to expand to many event types. Our current solution is to use pre-trained models and prompts. The generative method can also achieve good model performance in scenarios with less annotated data, has higher data utilization and flexibility, and is easier to expand to new event type.
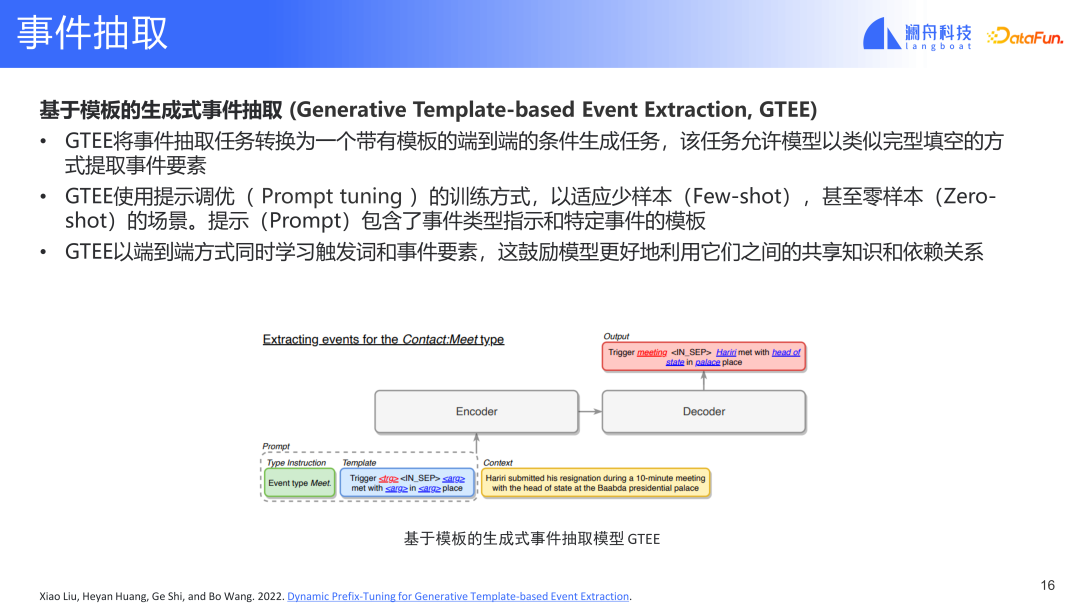
The above figure is a template-based generative event extraction method. This extraction method defines several important concepts. First of all, we need to pre-define the template before extraction. With the template, it can be provided to the model during training. When defining a new event, some elements are related to previous events. This information can also be provided to the model in advance. In this way, the model can learn new event types with a small amount of data.
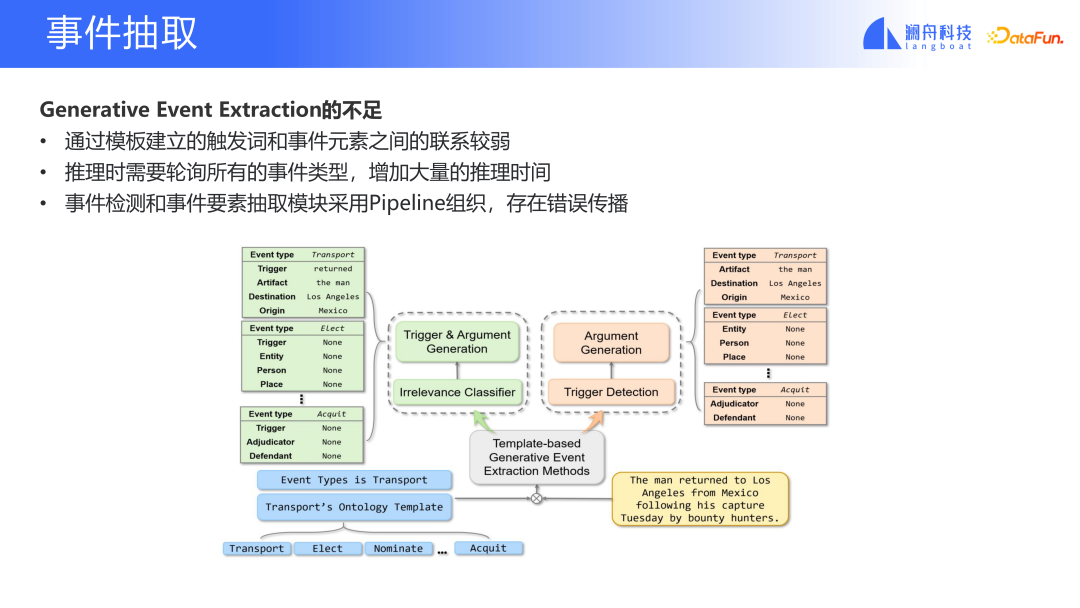
Although the above method can solve the event extraction problem to a certain extent, there is still a lot of room for improvement. For example, the connection between trigger words and event elements of the current method is weak; all event types need to be polled during inference, which requires a large amount of calculation and long inference time; the event detection and event element extraction modules are organized by Pipeline, which leads to error propagation.
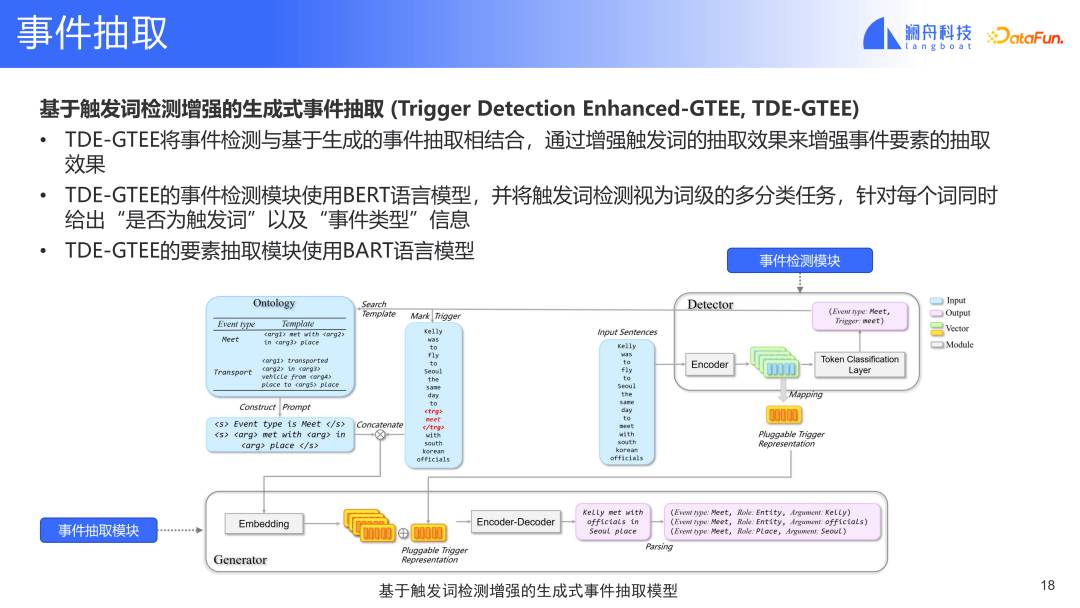
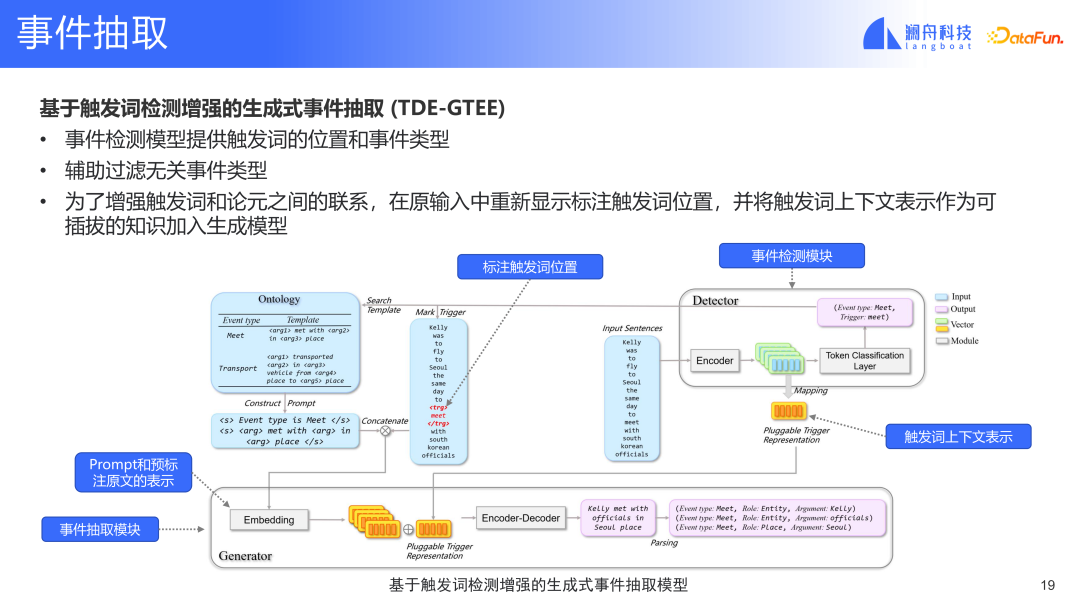
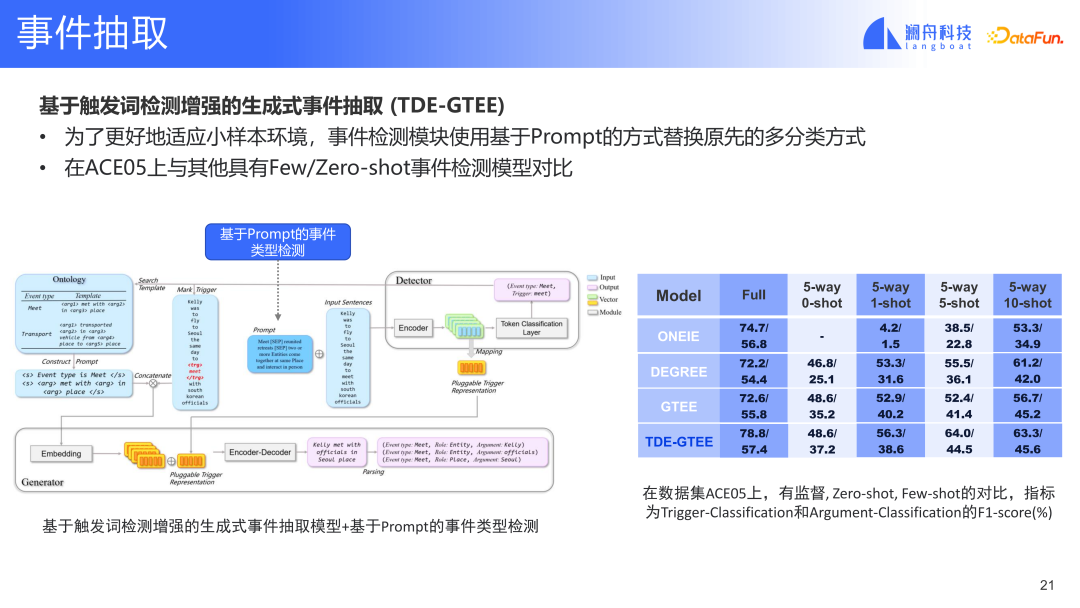
#We improved the model based on the questions raised above, Another generative event extraction method TDE-GTEE based on enhanced trigger word detection is proposed.
(Ge Shi, Yunyue Su, Yongliang Ma and Ming Zhou (2023). A Hybrid Detection and Generation Framework with Separate Encoders for Event Extraction. In Proceedings of the 17th Conference of the European Chapter of the Association for Computational Linguistics: Main Volume. Association for Computational Linguistics.)
In this method, the event detection module provides information about event trigger words. We will mark the trigger words in the input and select the corresponding template based on the event type information. This input and event template are later combined to form the representation of the event detection module. This representation is fed into the topic model and finally the filled template is obtained. The difference between this model and the previous model is that this model has an additional trigger word representation and also combines contextual information. This solves the first problem just mentioned, the problem that there are not many connections between trigger words and trigger word extraction elements. This model can construct the display relationship between the two. At the same time, through trigger word input, we can know the event type related to the trigger word. This way we can filter out irrelevant event types. The event detection module will only extract events for relevant event types. Finally, the event detection module and event extraction module can form an end-to-end joint training. This model can solve the other two problems mentioned above.
The TDE-GTEE model has reached SOTA level on both public datasets ACE and ERE. In the experiments we used the full amount of data. In order to verify the performance of this model with a small number of samples, we also made some adjustments to the event detection module, such as replacing the original multi-classification method with a Prompt-based method. Models can also achieve good results on zero-shot/few-shot. We believe that this model can be widely used in practical scenarios.
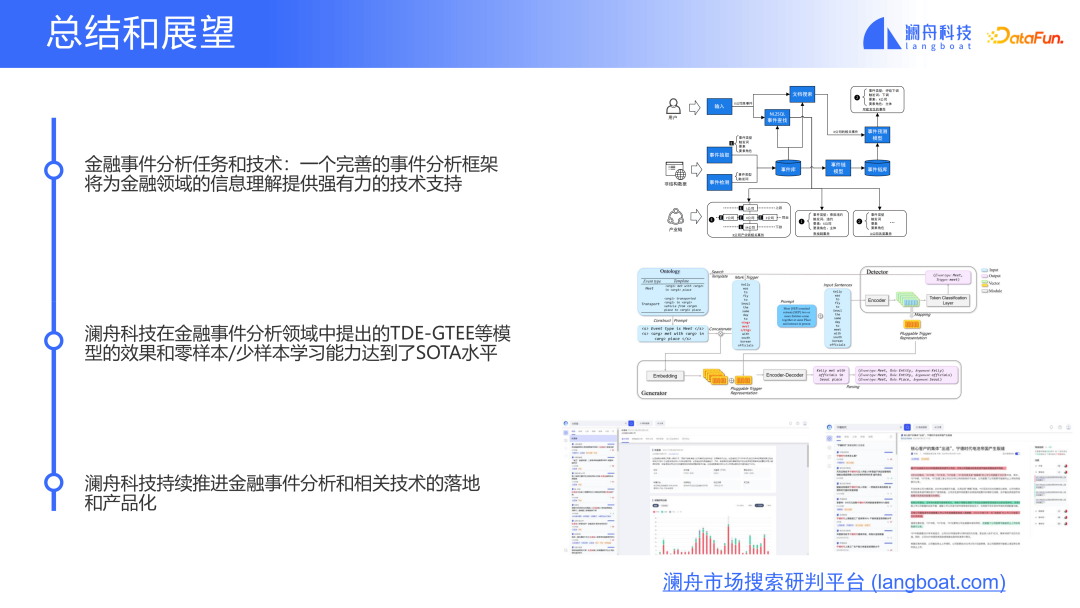
Event analysis technology is widely used in the financial field and has many scenarios. A comprehensive event analysis system framework will provide strong technical support for information understanding in the financial field.
Methods such as TDE-GTEE proposed by Lanzhou Technology in the field of financial event analysis can reach the SOTA level and are also very good in few-sample and zero-sample scenarios. Performance. We will continue to promote technological progress and productization in the field of financial event analysis.
4. Question and Answer Session#Q1: Is there a database specifically for event graphs? Is a traditional graph database such as Neo4j suitable? Store and manage event graphs?
#A1: There is a database specifically for event graphs. Some data providers provide such databases. For example, companies such as Lanzhou Technology and Ant Group will also build their own databases within their companies. Neo4j can be used to store and manage event graphs. Depending on the usage scenario, Neo4j is more suitable for storage and management in complex scenarios. If simplified into an event chain, the representation of events can be more flexible. What we do is to extract the data from the text to generate an event chain as training data for the model. There is no graph operation involved in training. A2: There are two main ways. In the process of constructing and evaluating specific models, we rely more on information from the stock market. It can be understood as backtesting in quantitative trading. We use historical data for training and evaluation. The other is that in real scenarios, we will use manual judgment, such as predicting stock price fluctuations in the next month based on corporate news and technical indicators of stock volume and price trading. We will look specifically at whether stock price fluctuations will actually occur this month. If fluctuations occur, the corresponding event type, corresponding stock price volume and price information and other elements will be analyzed to determine whether there is a strong causal relationship. Q2: How to evaluate the effect of stock fluctuation analysis?
The above is the detailed content of Financial event analysis and application based on pre-trained models. For more information, please follow other related articles on the PHP Chinese website!

Hot AI Tools

Undresser.AI Undress
AI-powered app for creating realistic nude photos

AI Clothes Remover
Online AI tool for removing clothes from photos.

Undress AI Tool
Undress images for free

Clothoff.io
AI clothes remover

AI Hentai Generator
Generate AI Hentai for free.

Hot Article

Hot Tools

Notepad++7.3.1
Easy-to-use and free code editor

SublimeText3 Chinese version
Chinese version, very easy to use

Zend Studio 13.0.1
Powerful PHP integrated development environment

Dreamweaver CS6
Visual web development tools

SublimeText3 Mac version
God-level code editing software (SublimeText3)

Hot Topics
 1378
1378
 52
52
 How to explore and visualize ML data for object detection in images
Feb 16, 2024 am 11:33 AM
In recent years, people have gained a deeper understanding of the importance of deeply understanding machine learning data (ML-data). However, since detecting large data sets usually requires a lot of human and material investment, its widespread application in the field of computer vision still requires further development. Usually, in object detection (a subset of computer vision), objects in the image are positioned by defining bounding boxes. Not only can the object be identified, but the context, size, and relationship between the object and other elements in the scene can also be understood. Relationship. At the same time, a comprehensive understanding of the distribution of classes, the diversity of object sizes, and the common environments in which classes appear will also help to discover error patterns in the training model during evaluation and debugging, thereby
 Detailed explanation of deep learning pre-training model in Python
Jun 11, 2023 am 08:12 AM
With the development of artificial intelligence and deep learning, pre-training models have become a popular technology in natural language processing (NLP), computer vision (CV), speech recognition and other fields. As one of the most popular programming languages at present, Python naturally plays an important role in the application of pre-trained models. This article will focus on the deep learning pre-training model in Python, including its definition, types, applications and how to use the pre-training model. What is a pretrained model? The main difficulty of deep learning models is to analyze a large number of high-quality
 Query intent recognition based on knowledge enhancement and pre-trained large model
May 19, 2023 pm 02:01 PM
1. Background Introduction Enterprise digitalization is a hot topic in recent years. It refers to the use of new generation digital technologies such as artificial intelligence, big data, and cloud computing to change the business model of enterprises, thereby promoting new growth in enterprise business. Enterprise digitalization generally includes the digitalization of business operations and the digitalization of enterprise management. This sharing mainly introduces the digitalization of enterprise management level. Information digitization, simply put, means reading, writing, storing and transmitting information in a digital way. From the previous paper documents to the current electronic documents and online collaborative documents, information digitization has become the new normal in today's office. Currently, Alibaba uses DingTalk Documents and Yuque Documents for business collaboration, and the number of online documents has reached more than 20 million. In addition, many companies will internally
 MIT releases enhanced version of 'Advanced Mathematics' solver: accuracy rate reaches 81% in 7 courses
Apr 12, 2023 pm 04:04 PM
Not only solving elementary school math word problems, AI has also begun to conquer advanced math! Recently, MIT researchers announced that based on the OpenAI Codex pre-training model, they successfully achieved an 81% accuracy rate on undergraduate-level mathematics problems through few-shot learning! Paper link: https://arxiv.org/abs/2112.15594 Code link: https://github.com/idrori/mathq Let’s first look at a few small questions to see the answers, such as calculating the rotation of the graph of a single variable function around the axis. Volume, calculate Lorenz attractor and projection, calculate and depict the geometry of singular value decomposition (SVD), not only can solve it correctly
 Barrier-free travel is safer! ByteDance's research results won the CVPR2022 AVA competition championship
Apr 08, 2023 pm 11:01 PM
Recently, the results of various CVPR2022 competitions have been announced. ByteDance's intelligent creation AI platform "Byte-IC-AutoML" team won the Accessibility Vision and Autonomy Challenge (hereinafter referred to as AVA) based on synthetic data, relying on its self-developed The Parallel Pre-trained Transformers (PPT) framework stood out as the winner of the only track in the competition. Paper address: https://arxiv.org/abs/2206.10845 This AVA competition is sponsored by Boston University (Bos
 Reinforcement learning guru Sergey Levine's new work: Three large models teach robots to recognize their way
Apr 12, 2023 pm 11:55 PM
A robot with a large built-in model has learned to follow language instructions to reach its destination without looking at a map. This achievement comes from the new work of reinforcement learning guru Sergey Levine. Given a destination, how difficult is it to reach it successfully without navigation tracks? This task is also very challenging for humans with poor sense of direction. But in a recent study, several academics "taught" the robot using only three pre-trained models. We all know that one of the core challenges of robot learning is to enable robots to perform a variety of tasks according to high-level human instructions. This requires robots that can understand human instructions and be equipped with a large number of different actions to carry out these instructions in the real world. For instructions in navigation
 ChatGPT PHP technical analysis: How to use pre-trained models to build intelligent chat applications
Oct 24, 2023 am 11:47 AM
ChatGPTPHP technical analysis: How to use pre-trained models to build intelligent chat applications In today's information age, intelligent chat applications have become an indispensable part of daily life and business. Smart chat applications can help users communicate in natural language and provide real-time answers to questions and suggestions. The recently open source ChatGPT project provides us with an effective way to build intelligent chat applications. This article will introduce in detail how to use the PHP programming language combined with pre-trained models to build intelligent chat applications, and provide
 Financial event analysis and application based on pre-trained models
Jun 12, 2023 am 11:15 AM
1. The main tasks of financial event analysis The main tasks of financial event analysis can be divided into three parts: ① The first part is the intelligent analysis of unstructured data. Information in the financial field has its own unique features compared with Internet information. Information in the financial field often exists in unstructured form, and there are some special file formats, such as PDF, which poses a greater challenge to extracting clean and accurate data from files or data. The PDF format is a typesetting and printing format and does not have as clear paragraphs as other file types. PDF is more for typesetting, so there is only some location information in the file. It is more challenging to parse accurately formatted and semantically clear text from unstructured data. And when the format semantics in the document are unclear, it is difficult to


