
 Backend Development
PHP Tutorial
PHP Development: Performance and Debugging Optimization with Whybug and PHPProfiler
Backend Development
PHP Tutorial
PHP Development: Performance and Debugging Optimization with Whybug and PHPProfiler
PHP Development: Performance and Debugging Optimization with Whybug and PHPProfiler

To make PHP applications more efficient, scalable, and fault-tolerant, developers need to perform performance and debugging optimizations. In this regard, the two main tools that provide excellent support for PHP are Whybug and PHPProfiler. This article will introduce these two tools and provide some useful tips and tricks to help PHP developers use them to optimize their projects.
Whybug
Whybug is a lightweight but powerful debugger that allows developers to quickly find problems and errors in their programs. It provides an interactive shell environment, making debugging easier. Here are some common features:
- Set breakpoints: Set breakpoints in your code so you can stop at a specific line while running your code. Breakpoints can be set using command line tools or through the web interface.
- Variable monitoring: You can view and monitor the values of all variables in the program. This can be viewed using the web interface or the command line.
- Backtrace: You can view the stack trace of the called function and check the return value, parameters and exceptions of each function. The traceback function is one of the most commonly used functions during debugging.
- Runtime detection: allows you to perform detection at runtime to find potential problems and defects. For example, you can check memory usage, or find infinite loops and deadlock issues in your code.
In order to use Whybug, you need to integrate it into your PHP code. To integrate Whybug, you need to install the Xdebug extension, which is an open source PHP extension. Once installed, you can start using all of Whybug’s features.
PHPProfiler
PHPProfiler is a performance profiler for PHP applications. It can help you identify performance bottlenecks in your application and optimize your code to improve performance. Here are some commonly used PHPProfiler functions:
- CPU Sampling: You can monitor the CPU usage of your application. By looking at the sampled information, you can find out which functions consume the most CPU time.
- Memory detection: can detect the memory usage of PHP scripts. This helps you figure out which functions are using too much memory and where memory leaks may occur.
- Blocking detection: Can detect blocking conditions in PHP scripts. Blocking refers to a situation where code stops executing because it is waiting for data. PHPProfiler can help you find which functions are blocking your application and why.
Before using PHPProfiler, you need to make sure you have installed the Xdebug extension. Once installed, you can run PHP scripts via the command line to collect performance data. This data can then be analyzed using PHPProfiler's graphical interface.
Optimization Tips
Now, let’s see how to optimize PHP code using Whybug and some tips from PHPProfiler.
- Reduce queries: Use caching and other techniques (such as database indexes) to avoid unnecessary database queries. During debugging, you can use Whybug to see how long each query takes and find out which queries are the slowest.
- Avoid recursion: The use of recursion (a function calling itself) can cause stack overflow and performance issues. If you must use recursion, use tail recursion, which is an optimized form of recursion.
- Use cache: Use cache to avoid repeated calculations and queries. To avoid problems caused by cache expiration, you can use a cache purging strategy to automatically purge outdated caches.
- Avoid infinite loops: Be careful when writing loops to make sure the loop will stop. You can use Whybug to view the program's traceback to check if there is an infinite loop.
- Use references: Use references instead of copies to pass variables to avoid wasting memory. By using PHPProfiler, you can check which functions are using too much memory and then optimize for those functions.
Summary
In order to improve the performance and reliability of PHP applications, it is crucial to use Whybug and PHPProfiler for debugging and performance optimization. Before you start using these tools, you need to make sure you have the necessary extensions installed. Once installed, you can use these tools to discover performance issues and debug code, and use optimization techniques to identify and resolve these issues.
The above is the detailed content of PHP Development: Performance and Debugging Optimization with Whybug and PHPProfiler. For more information, please follow other related articles on the PHP Chinese website!

Hot AI Tools

Undresser.AI Undress
AI-powered app for creating realistic nude photos

AI Clothes Remover
Online AI tool for removing clothes from photos.

Undress AI Tool
Undress images for free

Clothoff.io
AI clothes remover

AI Hentai Generator
Generate AI Hentai for free.

Hot Article
Hot Tools

Notepad++7.3.1
Easy-to-use and free code editor

SublimeText3 Chinese version
Chinese version, very easy to use

Zend Studio 13.0.1
Powerful PHP integrated development environment

Dreamweaver CS6
Visual web development tools

SublimeText3 Mac version
God-level code editing software (SublimeText3)
Hot Topics
 1376
1376
 52
52

 PHP 8.4 Installation and Upgrade guide for Ubuntu and Debian
Dec 24, 2024 pm 04:42 PM
PHP 8.4 Installation and Upgrade guide for Ubuntu and Debian
Dec 24, 2024 pm 04:42 PM
PHP 8.4 brings several new features, security improvements, and performance improvements with healthy amounts of feature deprecations and removals. This guide explains how to install PHP 8.4 or upgrade to PHP 8.4 on Ubuntu, Debian, or their derivati
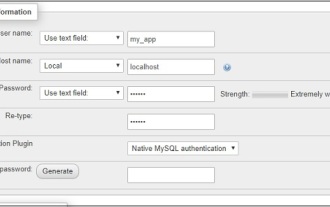 CakePHP Working with Database
Sep 10, 2024 pm 05:25 PM
CakePHP Working with Database
Sep 10, 2024 pm 05:25 PM
Working with database in CakePHP is very easy. We will understand the CRUD (Create, Read, Update, Delete) operations in this chapter.
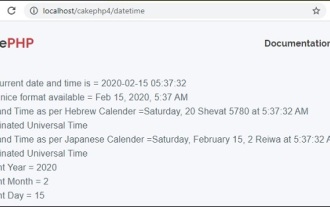 CakePHP Date and Time
Sep 10, 2024 pm 05:27 PM
CakePHP Date and Time
Sep 10, 2024 pm 05:27 PM
To work with date and time in cakephp4, we are going to make use of the available FrozenTime class.
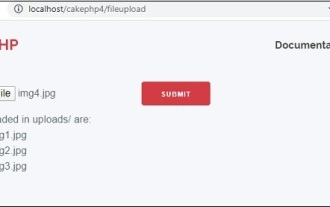 CakePHP File upload
Sep 10, 2024 pm 05:27 PM
CakePHP File upload
Sep 10, 2024 pm 05:27 PM
To work on file upload we are going to use the form helper. Here, is an example for file upload.
 Discuss CakePHP
Sep 10, 2024 pm 05:28 PM
Discuss CakePHP
Sep 10, 2024 pm 05:28 PM
CakePHP is an open-source framework for PHP. It is intended to make developing, deploying and maintaining applications much easier. CakePHP is based on a MVC-like architecture that is both powerful and easy to grasp. Models, Views, and Controllers gu
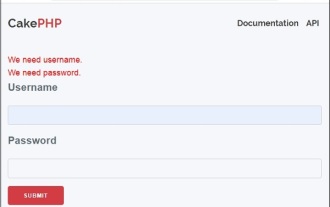 CakePHP Creating Validators
Sep 10, 2024 pm 05:26 PM
CakePHP Creating Validators
Sep 10, 2024 pm 05:26 PM
Validator can be created by adding the following two lines in the controller.
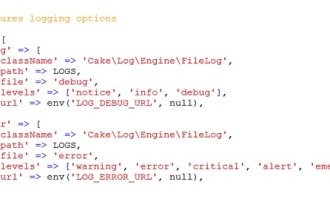 CakePHP Logging
Sep 10, 2024 pm 05:26 PM
CakePHP Logging
Sep 10, 2024 pm 05:26 PM
Logging in CakePHP is a very easy task. You just have to use one function. You can log errors, exceptions, user activities, action taken by users, for any background process like cronjob. Logging data in CakePHP is easy. The log() function is provide
 How To Set Up Visual Studio Code (VS Code) for PHP Development
Dec 20, 2024 am 11:31 AM
How To Set Up Visual Studio Code (VS Code) for PHP Development
Dec 20, 2024 am 11:31 AM
Visual Studio Code, also known as VS Code, is a free source code editor — or integrated development environment (IDE) — available for all major operating systems. With a large collection of extensions for many programming languages, VS Code can be c
