
 Operation and Maintenance
Linux Operation and Maintenance
How to configure data visualization using RStudio on Linux system
Operation and Maintenance
Linux Operation and Maintenance
How to configure data visualization using RStudio on Linux system
How to configure data visualization using RStudio on Linux system

Configuration method for using RStudio for data visualization on Linux system
Abstract:
RStudio is a powerful integrated development environment suitable for R language development and data analysis. This article will introduce how to install and configure RStudio on a Linux system and take advantage of its data visualization capabilities.
-
Installing R and RStudio
Installing R and RStudio on a Linux system is the first step to start the configuration process. Depending on your Linux distribution, you can use the following commands to complete the installation:
1.1 Ubuntu/Debian:sudo apt-get update sudo apt-get install r-base r-base-dev
Copy after login1.2 CentOS/Fedora:
sudo yum install R
Copy after loginTo install RStudio, you can download the corresponding software from the official website Install the package. Download address: https://www.rstudio.com/products/rstudio/download/
Install R package and dependencies
R package is an extension library of R language, providing Rich data processing and visualization functions. Data visualization in RStudio requires the installation of relevant R packages. After opening RStudio, use the following code to install commonly used data visualization packages:install.packages(c("ggplot2", "plotly", "leaflet", "shiny"))
This The ggplot2, plotly, leaflet and shiny packages will be installed.
RStudio configuration
3.1 Custom settings
In RStudio, users can customize settings by selecting "Tools" -> "Global Options". Under the "Appearance" tab, you can adjust the editor's font, size, and theme colors. Under the "Code" tab, you can set code indentation, automatic spell checking, automatic completion, etc.3.2 Configuring RMarkdown
RMarkdown is a powerful tool in RStudio for generating reports and documents. Under the "RMarkdown" tab, you can set the default output format and style, such as HTML, PDF, Word, etc.Data visualization examples
Next, several examples will be used to demonstrate the data visualization function of RStudio.4.1 Use ggplot2 to draw scatter plots
ggplot2 is a commonly used data visualization package that can draw many types of charts. The following is a sample code for drawing a scatter plot:
   library(ggplot2)
   data <- read.csv("data.csv")
ggplot(data, aes(x=age, y=income, color=gender)) + geom_point()This code will read the data from a file named "data.csv" and then use age and income as Horizontal and vertical coordinates, gender as color to draw a simple scatter plot.
4.2 Use plotly to draw interactive charts
Plotly is a powerful interactive data visualization package that can create various types of charts, such as line charts, pie charts, heat maps, etc. The following is a sample code for drawing a line chart:
   library(plotly)
   data <- read.csv("data.csv")
plot_ly(data, x = ~date, y = ~value, type = 'scatter', mode = 'lines')This code will read the data from the "data.csv" file and create a line chart using date and value as the x and y axes.
4.3 Use leaflet to create map visualization
Leaflet is a package that focuses on map visualization and can draw interactive maps and markers. The following is a sample code for drawing a simple map:
   library(leaflet)
   data <- read.csv("data.csv")
   map <- leaflet() %>% addTiles() %>% setView(lng = 0, lat = 0, zoom = 2)
   for (i in 1:nrow(data)) {
       map <- map %>% addMarkers(lng = data[i, "longitude"], lat = data[i, "latitude"], popup = data[i, "name"])
   }
mapThis code will read the data from the "data.csv" file and add markers on the map based on the latitude, longitude and name.
- Conclusion
This article introduces how to configure RStudio for data visualization on a Linux system, including installing R and RStudio, installing R packages and dependencies, and configuring RStudio. Through sample code, the method of using ggplot2, plotly and leaflet for data visualization is demonstrated. I hope this article can help readers better use RStudio for data analysis and visualization work.
The above is the detailed content of How to configure data visualization using RStudio on Linux system. For more information, please follow other related articles on the PHP Chinese website!

Hot AI Tools

Undresser.AI Undress
AI-powered app for creating realistic nude photos

AI Clothes Remover
Online AI tool for removing clothes from photos.

Undress AI Tool
Undress images for free

Clothoff.io
AI clothes remover

AI Hentai Generator
Generate AI Hentai for free.

Hot Article
Hot Tools

Notepad++7.3.1
Easy-to-use and free code editor

SublimeText3 Chinese version
Chinese version, very easy to use

Zend Studio 13.0.1
Powerful PHP integrated development environment

Dreamweaver CS6
Visual web development tools

SublimeText3 Mac version
God-level code editing software (SublimeText3)
Hot Topics
 1382
1382
 52
52

 Using Task Manager in Linux
Aug 15, 2024 am 07:30 AM
Using Task Manager in Linux
Aug 15, 2024 am 07:30 AM
There are many questions that Linux beginners often ask, "Does Linux have a Task Manager?", "How to open the Task Manager on Linux?" Users from Windows know that the Task Manager is very useful. You can open the Task Manager by pressing Ctrl+Alt+Del in Windows. This task manager shows you all the running processes and the memory they consume, and you can select and kill a process from the task manager program. When you first use Linux, you will also look for something that is equivalent to a task manager in Linux. A Linux expert prefers to use the command line to find processes, memory consumption, etc., but you don't have to
 Solve the problem of garbled display of graphs and charts on Zabbix Chinese monitoring server
Jul 31, 2024 pm 02:10 PM
Solve the problem of garbled display of graphs and charts on Zabbix Chinese monitoring server
Jul 31, 2024 pm 02:10 PM
Zabbix's support for Chinese is not very good, but sometimes we still choose Chinese for management purposes. In the web interface monitored by Zabbix, the Chinese under the graphic icon will display small squares. This is incorrect and requires downloading fonts. For example, "Microsoft Yahei", "Microsoft Yahei.ttf" is named "msyh.ttf", upload the downloaded font to /zabbix/fonts/fonts and modify the two characters in the /zabbix/include/defines.inc.php file at define('ZBX_GRAPH_FONT_NAME','DejaVuSans');define('ZBX_FONT_NAME'
 7 ways to help you check the registration date of Linux users
Aug 24, 2024 am 07:31 AM
7 ways to help you check the registration date of Linux users
Aug 24, 2024 am 07:31 AM
Did you know, how to check the creation date of an account on a Linux system? If you know, what can you do? Did you succeed? If yes, how to do it? Basically Linux systems don't track this information, so what are the alternative ways to get this information? You may ask why am I checking this? Yes, there are situations where you may need to review this information and it will be helpful to you at that time. You can use the following 7 methods to verify. Use /var/log/secure Use aureport tool Use .bash_logout Use chage command Use useradd command Use passwd command Use last command Method 1: Use /var/l
 Teach you how to add fonts to Fedora in 5 minutes
Jul 23, 2024 am 09:45 AM
Teach you how to add fonts to Fedora in 5 minutes
Jul 23, 2024 am 09:45 AM
System-wide installation If you install a font system-wide, it will be available to all users. The best way to do this is to use RPM packages from the official software repositories. Before starting, open the "Software" tool in Fedora Workstation, or other tools using the official repository. Select the "Add-ons" category in the selection bar. Then select "Fonts" within the category. You'll see the available fonts similar to the ones in the screenshot below: When you select a font, some details will appear. Depending on several scenarios, you may be able to preview some sample text for the font. Click the "Install" button to add it to your system. Depending on system speed and network bandwidth, this process may take some time to complete
 What should I do if the WPS missing fonts under the Linux system causes the file to be garbled?
Jul 31, 2024 am 12:41 AM
What should I do if the WPS missing fonts under the Linux system causes the file to be garbled?
Jul 31, 2024 am 12:41 AM
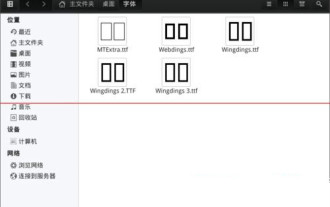
1. Find the fonts wingdings, wingdings2, wingdings3, Webdings, and MTExtra from the Internet. 2. Enter the main folder, press Ctrl+h (show hidden files), and check if there is a .fonts folder. If not, create one. 3. Copy the downloaded fonts such as wingdings, wingdings2, wingdings3, Webdings, and MTExtra to the .fonts folder in the main folder. Then start wps to see if there is still a "System missing font..." reminder dialog box. If not, just Success! Notes: wingdings, wingdin
 Centos 7 installation and configuration NTP network time synchronization server
Aug 05, 2024 pm 10:35 PM
Centos 7 installation and configuration NTP network time synchronization server
Aug 05, 2024 pm 10:35 PM
Experimental environment: OS: LinuxCentos7.4x86_641. View the current server time zone & list the time zone and set the time zone (if it is already the correct time zone, please skip it): #timedatectl#timedatectllist-timezones#timedatectlset-timezoneAsia/Shanghai2. Understanding of time zone concepts: GMT, UTC, CST, DSTUTC: The entire earth is divided into twenty-four time zones. Each time zone has its own local time. In international radio communication situations, for the sake of unification, a unified time is used, called Universal Coordinated Time (UTC). :UniversalTim
 How to connect two Ubuntu hosts to the Internet using one network cable
Aug 07, 2024 pm 01:39 PM
How to connect two Ubuntu hosts to the Internet using one network cable
Aug 07, 2024 pm 01:39 PM
How to use one network cable to connect two ubuntu hosts to the Internet 1. Prepare host A: ubuntu16.04 and host B: ubuntu16.042. Host A has two network cards, one is connected to the external network and the other is connected to host B. Use the iwconfig command to view all network cards on the host. As shown above, the network cards on the author's A host (laptop) are: wlp2s0: This is a wireless network card. enp1s0: Wired network card, the network card connected to host B. The rest has nothing to do with us, no need to care. 3. Configure the static IP of A. Edit the file #vim/etc/network/interfaces to configure a static IP address for interface enp1s0, as shown below (where #==========
 toss! Running DOS on Raspberry Pi
Jul 19, 2024 pm 05:23 PM
toss! Running DOS on Raspberry Pi
Jul 19, 2024 pm 05:23 PM
Different CPU architectures mean that running DOS on the Raspberry Pi is not easy, but it is not much trouble. FreeDOS may be familiar to everyone. It is a complete, free and well-compatible operating system for DOS. It can run some older DOS games or commercial software, and can also develop embedded applications. As long as the program can run on MS-DOS, it can run on FreeDOS. As the initiator and project coordinator of FreeDOS, many users will ask me questions as an insider. The question I get asked most often is: "Can FreeDOS run on a Raspberry Pi?" This question is not surprising. After all, Linux runs very well on the Raspberry Pi
