
 Operation and Maintenance
Linux Operation and Maintenance
How to use Linux tools for application log analysis and optimization?
Operation and Maintenance
Linux Operation and Maintenance
How to use Linux tools for application log analysis and optimization?
How to use Linux tools for application log analysis and optimization?

How to use Linux tools for application log analysis and optimization?
In the development and operation and maintenance process, application performance optimization is a key task. Potential problems can be identified through log analysis and corresponding measures can be taken for adjustment and optimization. In Linux systems, there are many powerful tools that can help us analyze and optimize application logs. This article will introduce some commonly used Linux tools and provide some code examples to illustrate how to use these tools for application log analysis and optimization.
- Text processing tools
During the log analysis process, we often need to perform operations such as searching, filtering, and statistics on a large number of log files. In Linux systems, there are many excellent text processing tools that can help us quickly complete these operations, such as grep, awk, sed, etc. The following is an example that demonstrates how to use the grep command to search for keywords from log files and count the number of occurrences:
grep -c "关键词" 日志文件路径
- Sort and Archive Tool
When performing log analysis , log files often need to be sorted and archived to better understand and analyze the data. In Linux systems, we can use tools such as sort and tar to complete these operations. Here is an example that demonstrates how to use the sort command to sort log files by time:
sort -k4,4 -k5,5n 日志文件路径
- Monitoring Tools
Monitoring tools can help us view the operation of the application in real time Status and performance indicators to detect problems in time and make adjustments and optimizations. In Linux systems, commonly used monitoring tools include top, htop, vmstat, etc. The following is an example that demonstrates how to use the top command to view CPU and memory usage:
top
In addition to the top command, we can also use other monitoring tools to view the application's network traffic, disk IO and other performance indicators, to gain a complete understanding of application health.
- Performance analysis tools
Performance analysis tools can help us deeply understand the performance bottlenecks of the application and find out the corresponding optimization strategies. In Linux systems, commonly used performance analysis tools include strace, perf, etc. The following is an example that demonstrates how to use the strace command to track the system calls of an application:
strace -p 进程ID
In addition to the strace command, we can also use the perf tool to monitor the application's function calls, memory access and other performance indicators to Help us analyze and optimize application performance.
In addition to the tools mentioned above, there are many other Linux tools that can help us analyze and optimize application logs, such as awk, sed, cut, iptables, etc. You can learn how to use these tools by consulting relevant documentation or using the man command.
To summarize, using Linux tools for application log analysis and optimization is an important and complex task. Through the proper use of text processing tools, sorting and archiving tools, monitoring tools, and performance analysis tools, we can better understand and optimize application performance and improve system stability and reliability. We hope that the code examples provided in this article can help readers better understand how to use these Linux tools for application log analysis and optimization.
The above is the detailed content of How to use Linux tools for application log analysis and optimization?. For more information, please follow other related articles on the PHP Chinese website!

Hot AI Tools

Undresser.AI Undress
AI-powered app for creating realistic nude photos

AI Clothes Remover
Online AI tool for removing clothes from photos.

Undress AI Tool
Undress images for free

Clothoff.io
AI clothes remover

AI Hentai Generator
Generate AI Hentai for free.

Hot Article
Hot Tools

Notepad++7.3.1
Easy-to-use and free code editor

SublimeText3 Chinese version
Chinese version, very easy to use

Zend Studio 13.0.1
Powerful PHP integrated development environment

Dreamweaver CS6
Visual web development tools

SublimeText3 Mac version
God-level code editing software (SublimeText3)
Hot Topics
 1378
1378
 52
52

 In-depth interpretation: Why is Laravel as slow as a snail?
Mar 07, 2024 am 09:54 AM
In-depth interpretation: Why is Laravel as slow as a snail?
Mar 07, 2024 am 09:54 AM
Laravel is a popular PHP development framework, but it is sometimes criticized for being as slow as a snail. What exactly causes Laravel's unsatisfactory speed? This article will provide an in-depth explanation of the reasons why Laravel is as slow as a snail from multiple aspects, and combine it with specific code examples to help readers gain a deeper understanding of this problem. 1. ORM query performance issues In Laravel, ORM (Object Relational Mapping) is a very powerful feature that allows
 Discussion on Golang's gc optimization strategy
Mar 06, 2024 pm 02:39 PM
Discussion on Golang's gc optimization strategy
Mar 06, 2024 pm 02:39 PM
Golang's garbage collection (GC) has always been a hot topic among developers. As a fast programming language, Golang's built-in garbage collector can manage memory very well, but as the size of the program increases, some performance problems sometimes occur. This article will explore Golang’s GC optimization strategies and provide some specific code examples. Garbage collection in Golang Golang's garbage collector is based on concurrent mark-sweep (concurrentmark-s
 C++ program optimization: time complexity reduction techniques
Jun 01, 2024 am 11:19 AM
C++ program optimization: time complexity reduction techniques
Jun 01, 2024 am 11:19 AM
Time complexity measures the execution time of an algorithm relative to the size of the input. Tips for reducing the time complexity of C++ programs include: choosing appropriate containers (such as vector, list) to optimize data storage and management. Utilize efficient algorithms such as quick sort to reduce computation time. Eliminate multiple operations to reduce double counting. Use conditional branches to avoid unnecessary calculations. Optimize linear search by using faster algorithms such as binary search.
 Decoding Laravel performance bottlenecks: Optimization techniques fully revealed!
Mar 06, 2024 pm 02:33 PM
Decoding Laravel performance bottlenecks: Optimization techniques fully revealed!
Mar 06, 2024 pm 02:33 PM
Decoding Laravel performance bottlenecks: Optimization techniques fully revealed! Laravel, as a popular PHP framework, provides developers with rich functions and a convenient development experience. However, as the size of the project increases and the number of visits increases, we may face the challenge of performance bottlenecks. This article will delve into Laravel performance optimization techniques to help developers discover and solve potential performance problems. 1. Database query optimization using Eloquent delayed loading When using Eloquent to query the database, avoid
 Laravel performance bottleneck revealed: optimization solution revealed!
Mar 07, 2024 pm 01:30 PM
Laravel performance bottleneck revealed: optimization solution revealed!
Mar 07, 2024 pm 01:30 PM
Laravel performance bottleneck revealed: optimization solution revealed! With the development of Internet technology, the performance optimization of websites and applications has become increasingly important. As a popular PHP framework, Laravel may face performance bottlenecks during the development process. This article will explore the performance problems that Laravel applications may encounter, and provide some optimization solutions and specific code examples so that developers can better solve these problems. 1. Database query optimization Database query is one of the common performance bottlenecks in Web applications. exist
 How to optimize the startup items of WIN7 system
Mar 26, 2024 pm 06:20 PM
How to optimize the startup items of WIN7 system
Mar 26, 2024 pm 06:20 PM
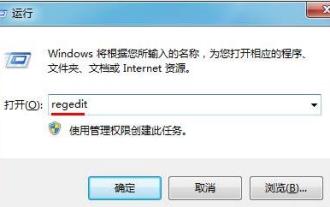
1. Press the key combination (win key + R) on the desktop to open the run window, then enter [regedit] and press Enter to confirm. 2. After opening the Registry Editor, we click to expand [HKEY_CURRENT_USERSoftwareMicrosoftWindowsCurrentVersionExplorer], and then see if there is a Serialize item in the directory. If not, we can right-click Explorer, create a new item, and name it Serialize. 3. Then click Serialize, then right-click the blank space in the right pane, create a new DWORD (32) bit value, and name it Star
 Vivox100s parameter configuration revealed: How to optimize processor performance?
Mar 24, 2024 am 10:27 AM
Vivox100s parameter configuration revealed: How to optimize processor performance?
Mar 24, 2024 am 10:27 AM
Vivox100s parameter configuration revealed: How to optimize processor performance? In today's era of rapid technological development, smartphones have become an indispensable part of our daily lives. As an important part of a smartphone, the performance optimization of the processor is directly related to the user experience of the mobile phone. As a high-profile smartphone, Vivox100s's parameter configuration has attracted much attention, especially the optimization of processor performance has attracted much attention from users. As the "brain" of the mobile phone, the processor directly affects the running speed of the mobile phone.
![[Linux Tools]-yum/gdb usage tutorial!](https://img.php.cn/upload/article/000/887/227/170978100851477.jpg?x-oss-process=image/resize,m_fill,h_207,w_330) [Linux Tools]-yum/gdb usage tutorial!
Mar 07, 2024 am 11:10 AM
[Linux Tools]-yum/gdb usage tutorial!
Mar 07, 2024 am 11:10 AM
yum is a commonly used software package management tool, and gdb is a powerful debugging tool. The following are their usage tutorials: yum usage tutorial: Install software packages: Use the yuminstall command to install software packages. For example, to install the Apache web server, you can run yuminstallhttpd. Upgrade software packages: Use the yumupdate command to upgrade installed software packages. For example, running yumupdate will upgrade all packages in the system. Delete a software package: Use the yumremove command to delete a software package. For example, to remove the Apache Web server, you can run yumremovehttpd. Search for packages: use yumsear
