 Operation and Maintenance
 Linux Operation and Maintenance
 This article is enough for monitoring systems! Common monitoring tutorials such as Zabbix and Prometheus
This article is enough for monitoring systems! Common monitoring tutorials such as Zabbix and Prometheus
Monitoring is commonly known as the "third eye". It is a system that we deal with almost every day. As the saying goes: no monitoring, no operation and maintenance. The status of monitoring is self-evident, especially in operation and maintenance. In the era of automation, traditional operation and maintenance, DevOps, or SRE, monitoring is a necessary skill.
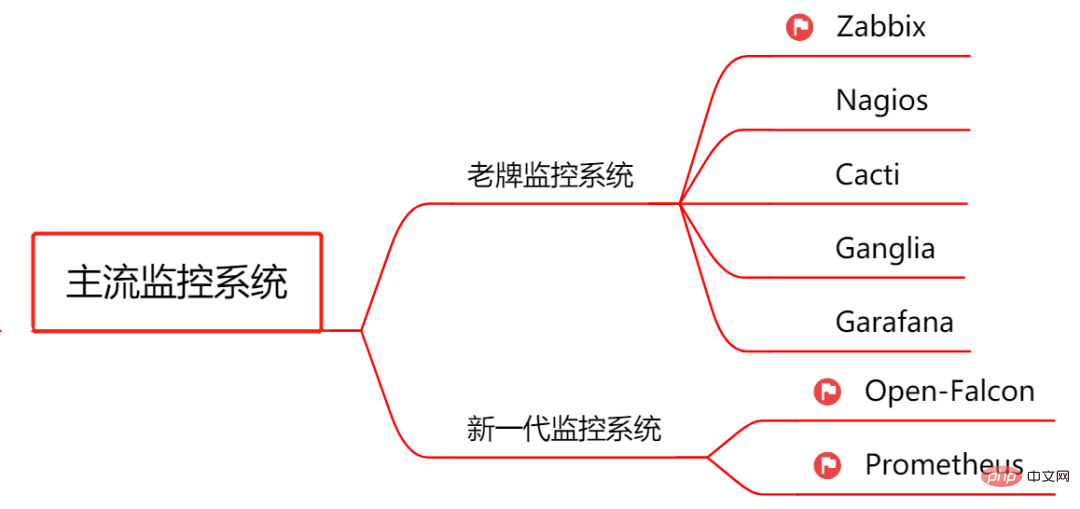
Let’s first get to know the mainstream open source monitoring systems, Zabbix, Open-Falcon, Prometheus, etc. Today we will briefly introduce them[ Zabbix] [Prometheus] [Cacti] [Nagios] [Garafana] and other 5 mainstream monitoring systems for your reference when choosing. In addition, I also share with you the learning materials for these five monitoring systems, so that you can freely learn and refer to them.
All information has been organized into compressed packages
[See the end of the article for information collection methods! 】
##

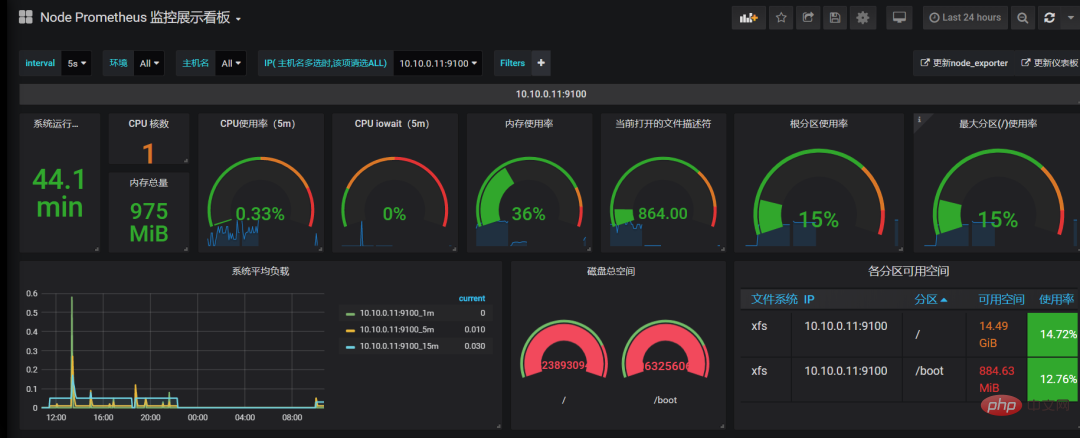
Prometheus is an open source monitoring system officially released by former Google employees in 2015. Developed using Go language. Not only does it have a cool name, but it also has strong support from Google and k8s, and the open source community is extremely popular.
This Prometheus official Chinese document is suitable for beginners to get started and for students with a certain foundation to advance. This document is divided into seven parts. It starts with the most basic introduction to the installation and startup of Prometheus, and compares the advantages and disadvantages of different monitoring systems, such as Graphite, OpenTSDB, Nagios, etc. In addition, it also includes some practical projects: Grafana combined with Prometheus for visualization, Instrumenting, writing customer libraries, pushing metrics, etc. In short, it is full of useful information!
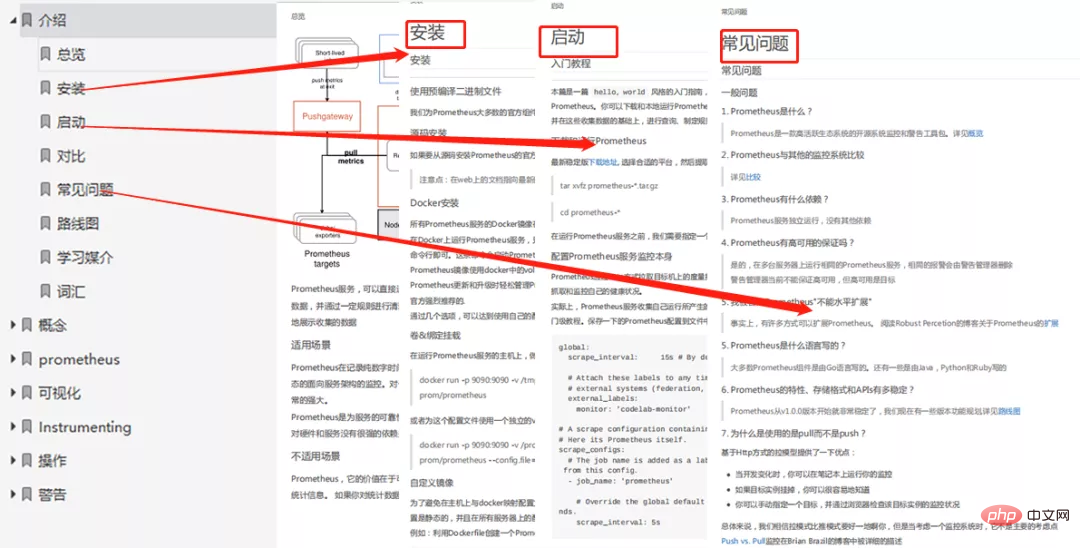
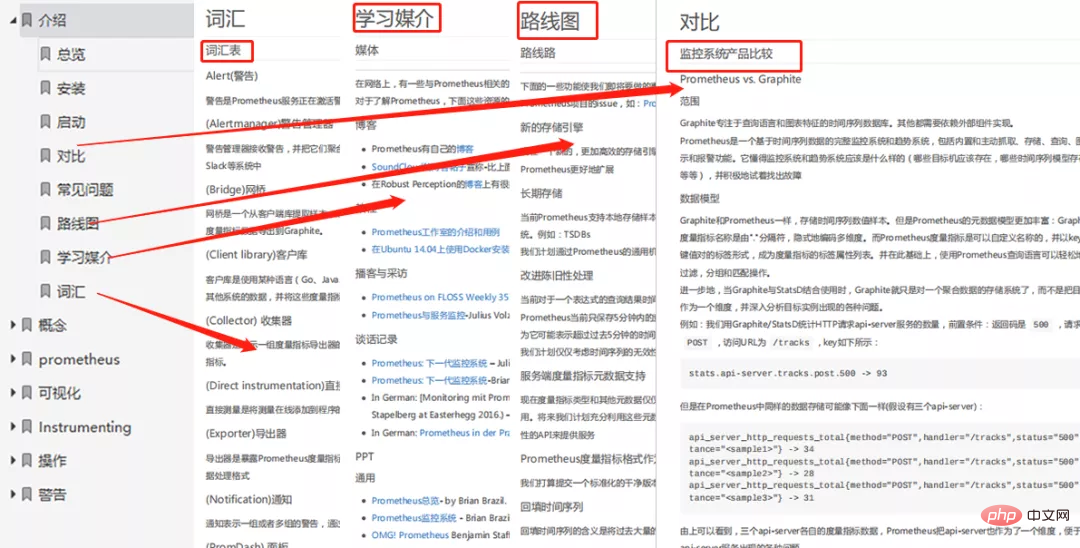
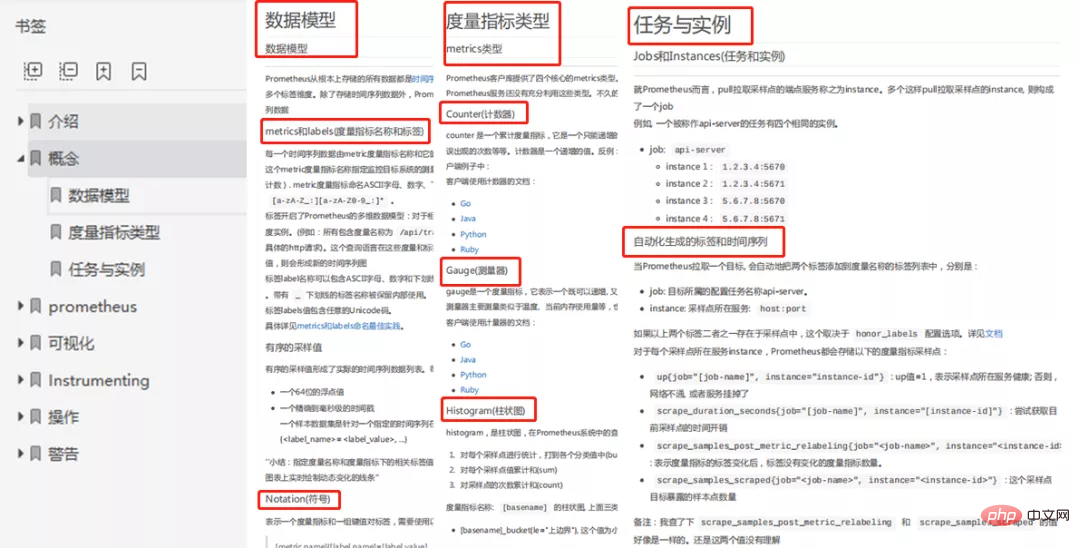
In this part, some basic concepts are introduced in detail. Only by studying this part can we truly understand the working principle of Prometheus.
metrics and labels Notation (symbol) metrics type ##Gauge(measurer) Histogram( Bar chart) - ##Jobs and Instances
Part 4: Visualization
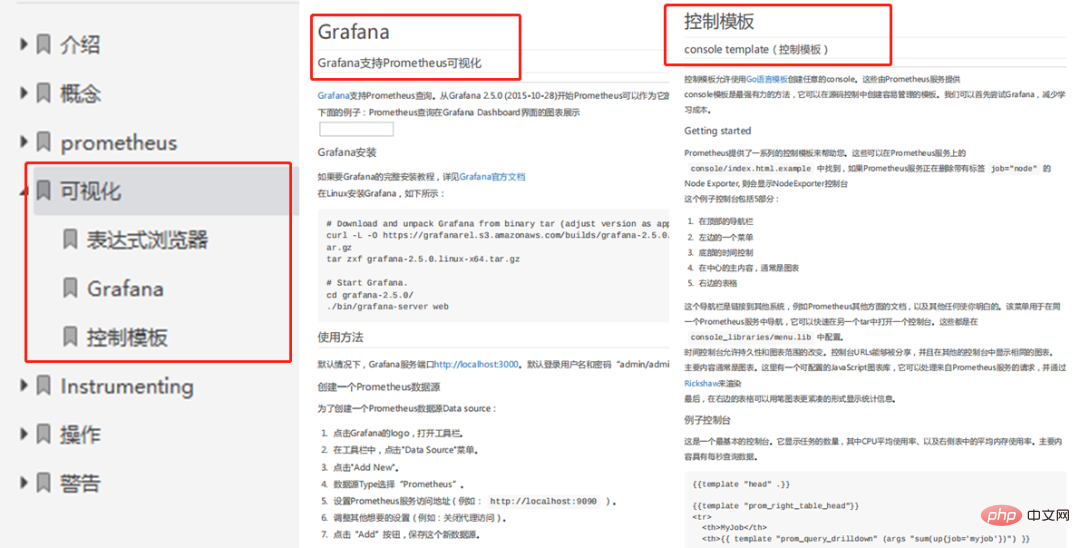
*Statement: The information comes from the Internet, for details, please see the official website https://prometheus.io/, The PDF is only for learning and communication, no infringement will be deleted


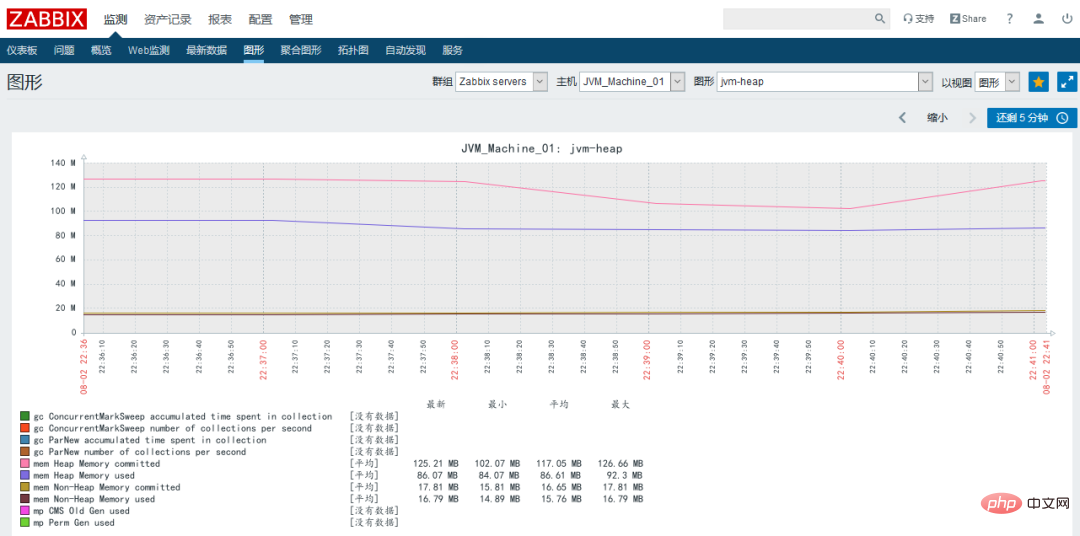
Compared with the above various monitoring systems, Zabbix stands out among the others with its powerful advantages. Its rich functions, scalable capabilities, secondary development capabilities and simple and easy-to-use features greatly enable readers to reduce costs. With no learning costs, you can easily build your own monitoring system. The Zabbix practical document shared today was compiled by Marco himself and has a total of 141 pages. The content is detailed, theoretical and practical, and full of useful information. I believe that everyone will have a deeper understanding of zabbix after reading it.
##1. Introduction to monitoring services 2. Zabbix planning and deployment 3. Basics of getting started with zabbix monitoring 4. zabbix proxy - ##5. Zabbix monitoring case practice
- 6. Zabbix event notification mechanism
- 7. Zabbix automated operation and maintenance
-
##Logical layout Overall layout Common monitoring solutions Zabbix usage scenarios and system overview
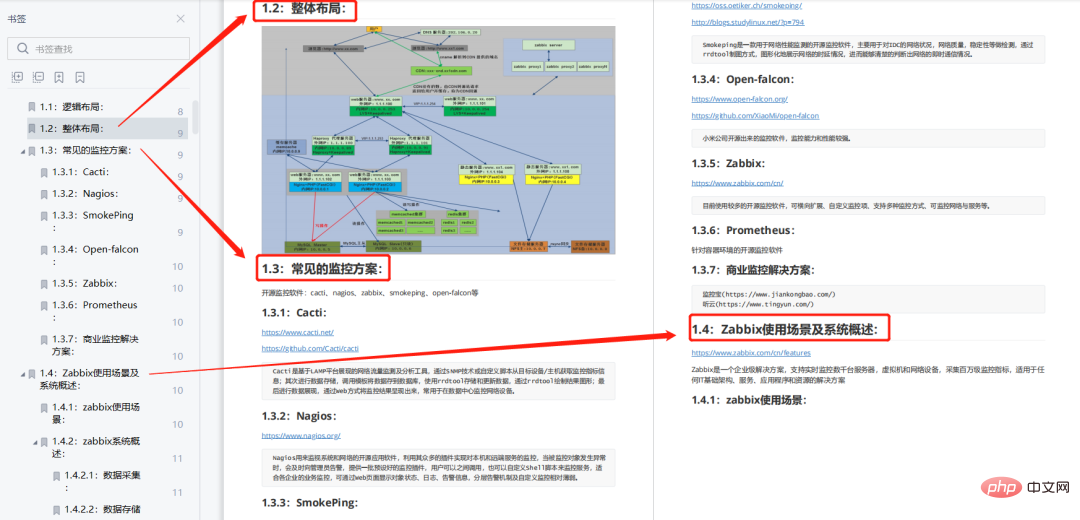
##System environment apt/yum install zabbix Compile and install zabbix Web interface Chinese menu environment Monitoring items and garbled codes zabbix Detailed explanation of server configuration file
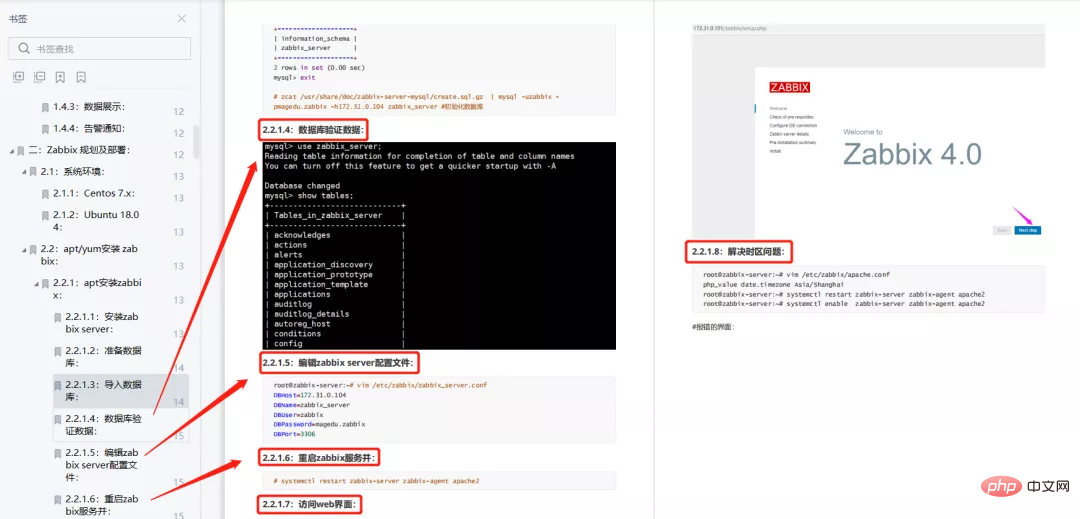
Monitoring linux system Monitoring tomcat zabbix active and passive monitoring mode
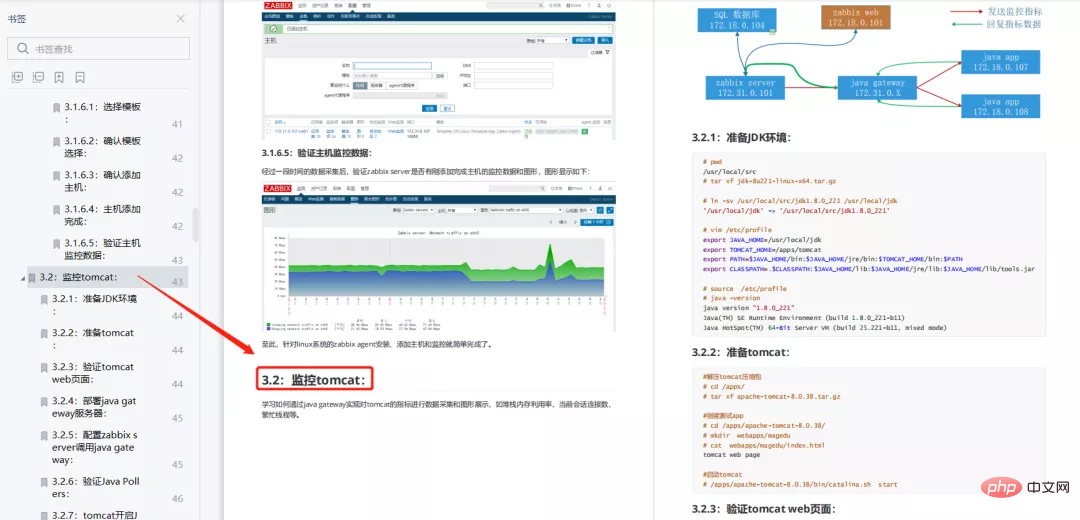
##zabbix monitoring case Actual combat
Monitoring Linux TCP connection status Monitoring memcache Monitoring Redis Monitoring Nginx SNMP monitoring Monitor MySQL Custom port and process monitoring Fault self-healing function grafana graphic display Customized basic monitoring template Combined with pyhton script monitoring case
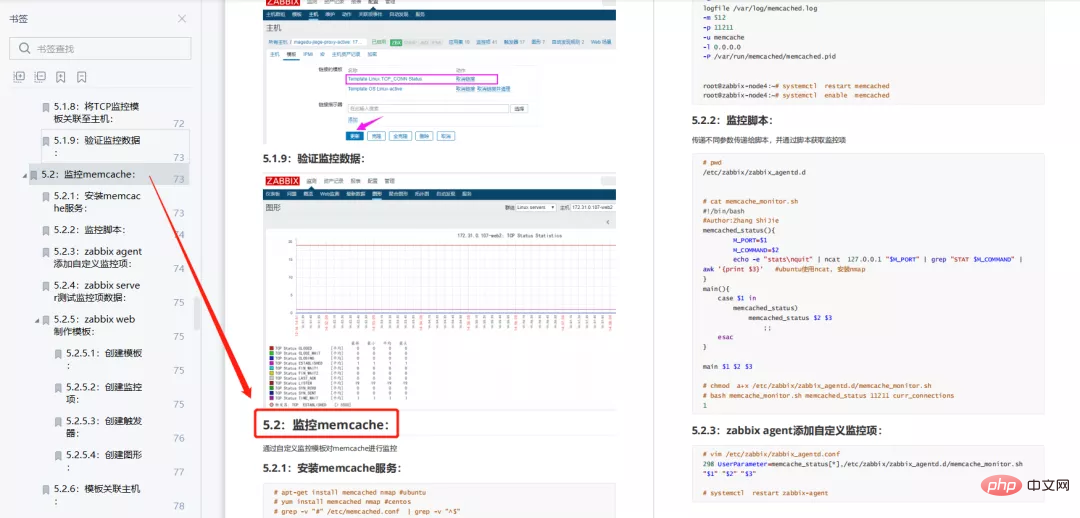
- ## Zabbix Agent batch deployment
- Zabbix API add host
- Zabbix dynamic discovery of host
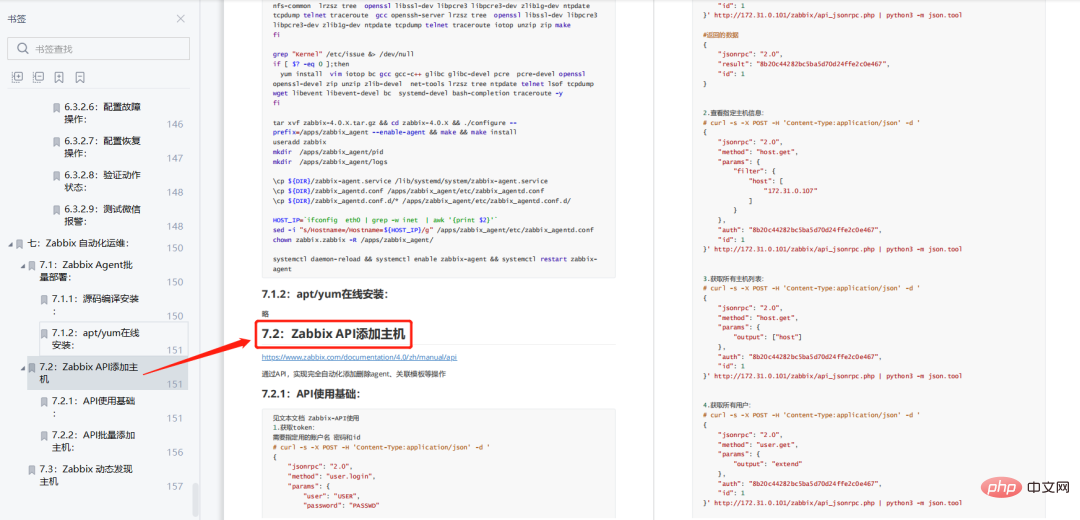


and other contents.
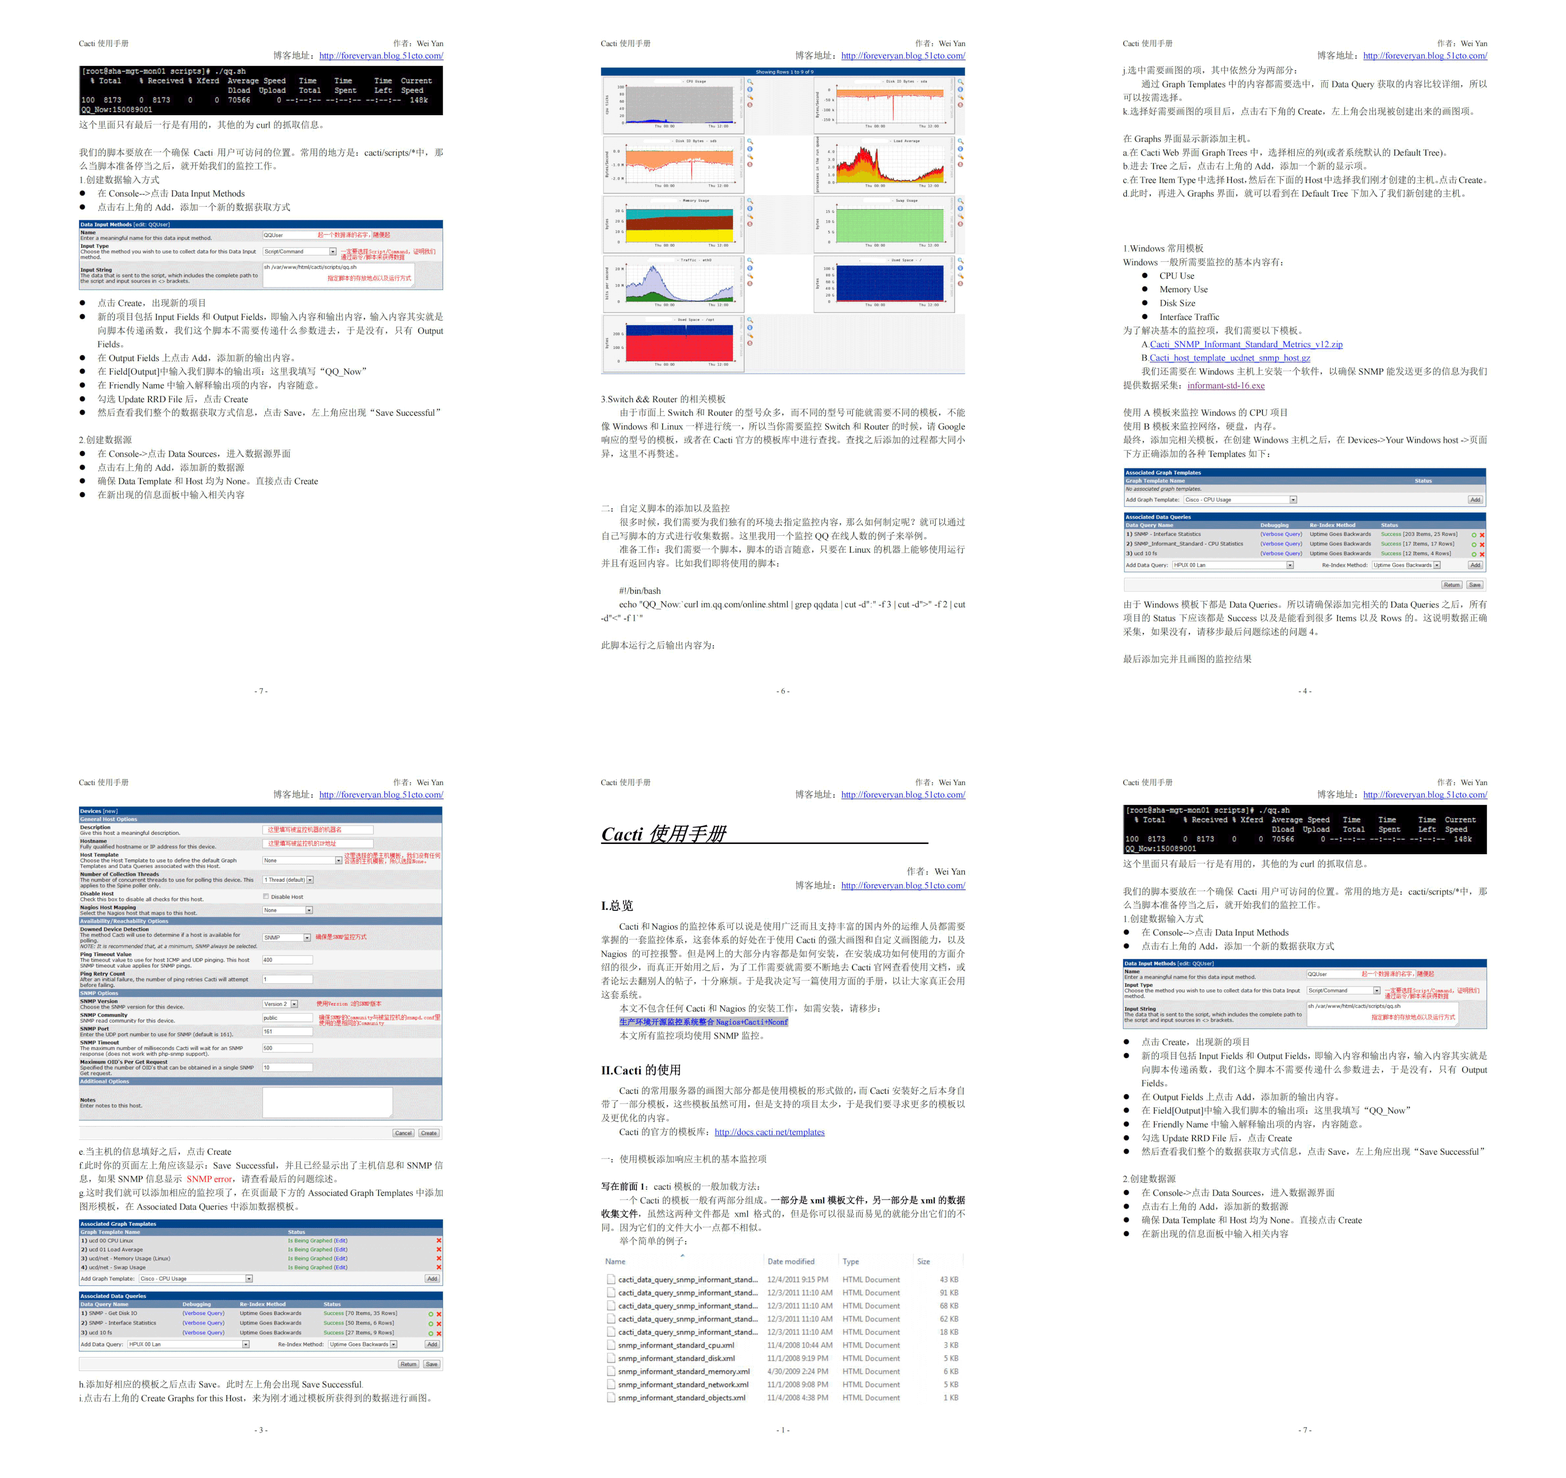


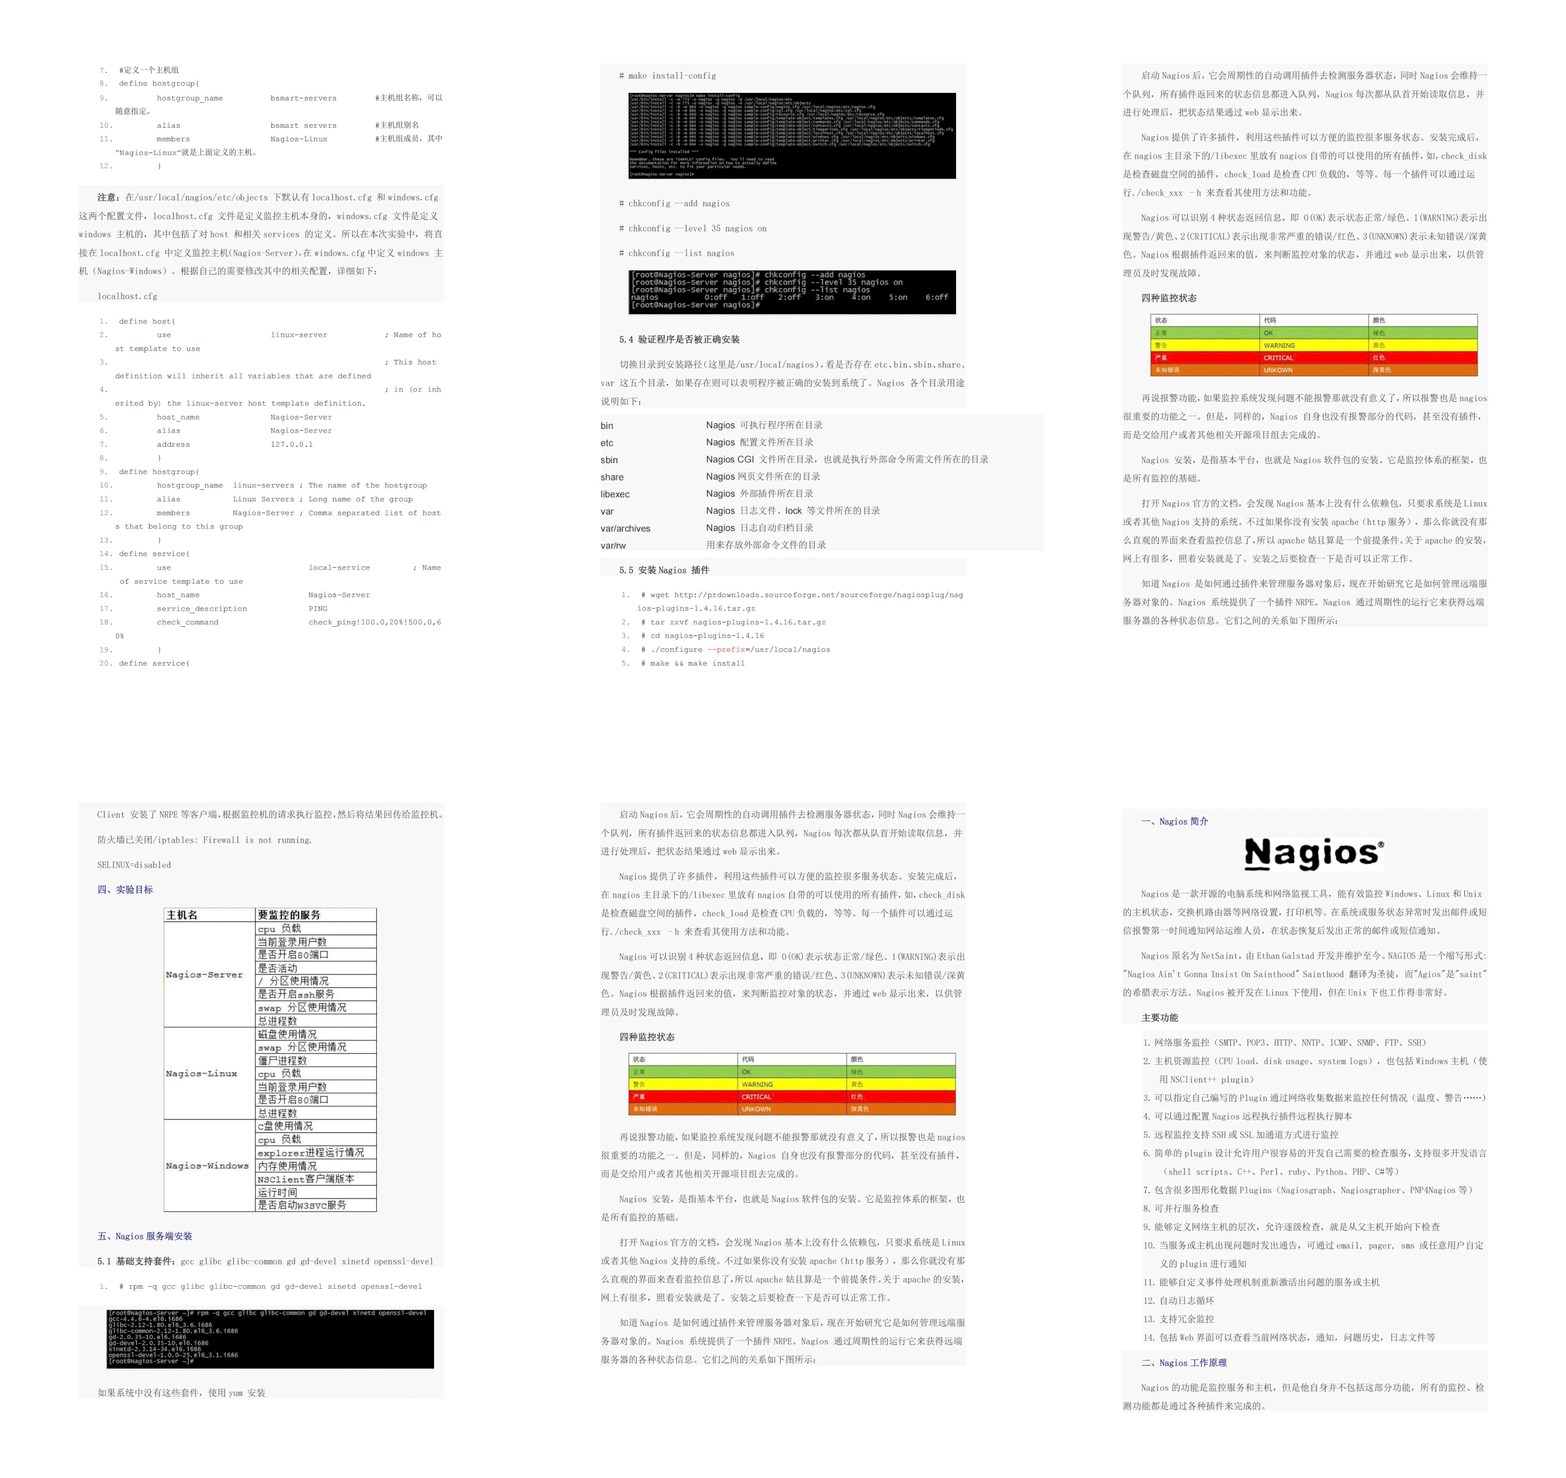


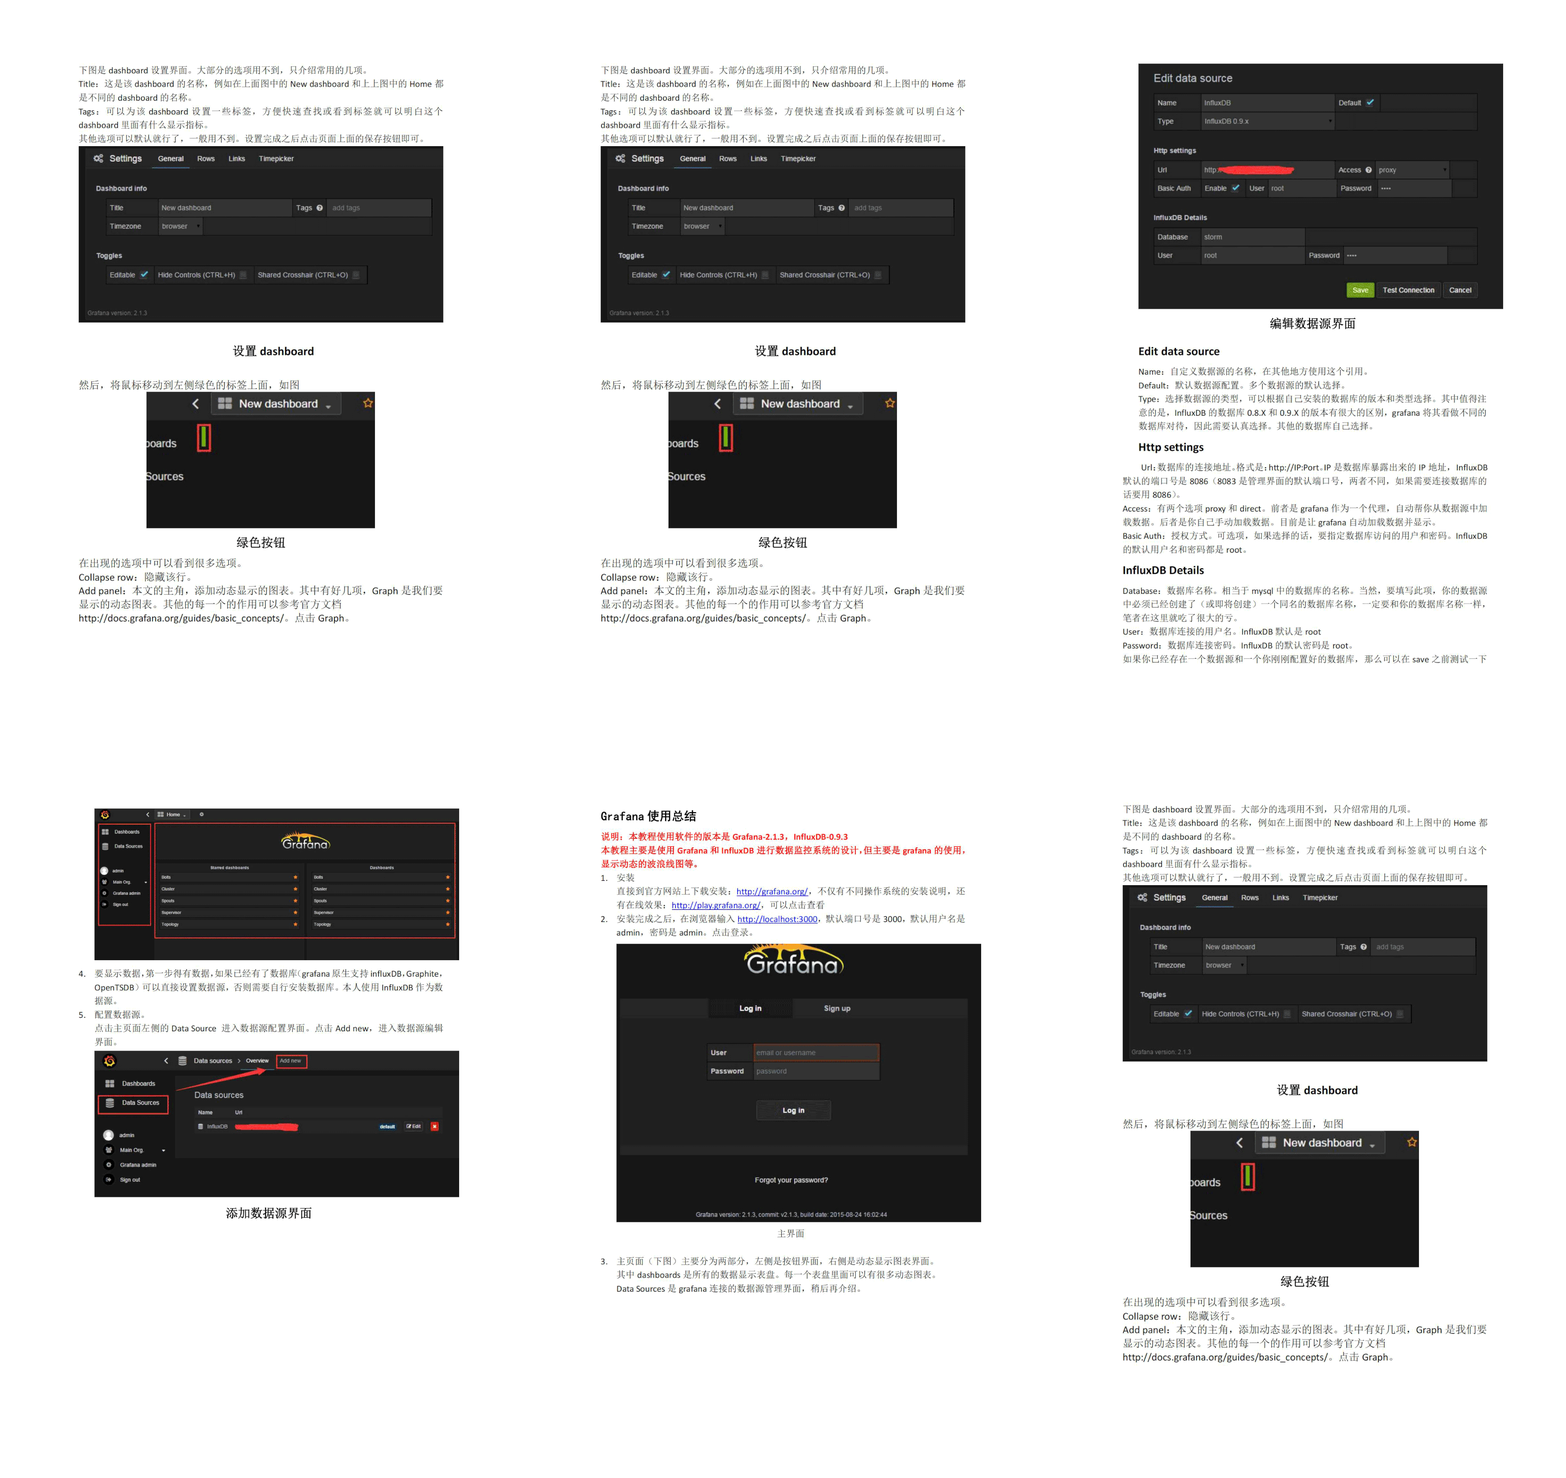
The above is the detailed content of This article is enough for monitoring systems! Common monitoring tutorials such as Zabbix and Prometheus. For more information, please follow other related articles on the PHP Chinese website!

Hot AI Tools

Undresser.AI Undress
AI-powered app for creating realistic nude photos

AI Clothes Remover
Online AI tool for removing clothes from photos.

Undress AI Tool
Undress images for free

Clothoff.io
AI clothes remover

AI Hentai Generator
Generate AI Hentai for free.

Hot Article

Hot Tools

Notepad++7.3.1
Easy-to-use and free code editor

SublimeText3 Chinese version
Chinese version, very easy to use

Zend Studio 13.0.1
Powerful PHP integrated development environment

Dreamweaver CS6
Visual web development tools

SublimeText3 Mac version
God-level code editing software (SublimeText3)

Hot Topics
 1385
1385
 52
52
 Known as the next generation monitoring system! Let's see how awesome it is
Aug 03, 2023 pm 02:53 PM
In the past two years, Prometheus has developed very rapidly, the community is also very active, and more and more people in China are studying Prometheus. With the popularity of concepts such as microservices, DevOps, cloud computing, and cloud native, more and more companies are beginning to use Docker and Kubernetes to build their own systems and applications.
 How to implement an intelligent security monitoring system through C++ development?
Aug 25, 2023 pm 02:48 PM
How to implement an intelligent security monitoring system through C++ development? Intelligent security monitoring systems play a very important role in ensuring the safety of people's lives and property in modern society. Using C++ language for development can give full play to its characteristics of efficiency, stability and flexibility. This article will introduce how to use C++ to develop and implement a simple intelligent security monitoring system, and provide corresponding code examples. First of all, we need to clarify the functional requirements of the intelligent security monitoring system. A basic intelligent security monitoring system should include video surveillance, moving target detection
 Summary of experience in building log analysis and monitoring system based on MongoDB
Nov 04, 2023 pm 01:17 PM
1. Requirements analysis and system design With the popularization of the Internet and mobile devices, the number of logs of various network applications and systems has increased dramatically. Analysis and monitoring of these massive logs can help enterprises understand the system operation in real time, discover potential problems and repair them in a timely manner, and improve the stability and reliability of the system. In order to meet this demand, our team built a log analysis and monitoring system based on MongoDB. This article will summarize our experience during the build process. 1.1 Requirements analysis in the construction of log analysis and monitoring system
 This article is enough for monitoring systems! Common monitoring tutorials such as Zabbix and Prometheus
Aug 01, 2023 pm 04:31 PM
Monitoring is commonly known as the "third eye". It is a system that we deal with almost every day. As the saying goes: no monitoring, no operation and maintenance, the status of monitoring is self-evident, especially in the era of operation and maintenance automation, traditional operation and maintenance, DevOps, Or SRE, monitoring is a necessary skill.
 How to implement a real-time vending machine monitoring system using PHP and Redis
Jun 28, 2023 am 08:31 AM
With the advancement of technology and the popularity of the Internet of Things, vending machines have become one of the common devices in people's lives. However, the monitoring and management of vending machines is a very complex task that would be very cumbersome and time-consuming if traditional methods are used. Therefore, this article will introduce how to use PHP and Redis to implement a real-time vending machine monitoring system, thereby improving the management efficiency and accuracy of vending machines. Redis is an in-memory data storage system that can be used to store and access data. It also supports a variety of data structures, such as strings, hash tables, lists, and sets.
 How to use go language to develop and implement monitoring and alarm systems
Aug 04, 2023 pm 01:10 PM
How to use Go language to develop and implement monitoring and alarm systems Introduction: With the rapid development of Internet technology, large-scale distributed systems have become the mainstream of modern software development, and one of the challenges that comes with it is system monitoring and Alert. In order to ensure the stability and performance of the system, it is very important to develop and implement an efficient and reliable monitoring and alarm system. This article will introduce how to use Go language to develop and implement monitoring and alarm systems, and provide relevant code examples. 1. Design and architecture of monitoring system The monitoring system mainly includes
 Building an efficient log analysis and monitoring system: Go language development guide
Nov 20, 2023 pm 02:48 PM
Building an Efficient Log Analysis and Monitoring System: Go Language Development Guide With the rapid development of the Internet, a large number of applications and services need to process and record massive amounts of log data. Log analysis and monitoring systems have become one of the key tools to ensure high availability and optimized performance of applications. As an efficient, easy-to-use, and concurrency-supporting programming language, the Go language is gradually becoming the language of choice for log analysis and monitoring system development. This article will introduce how to use Go language to build an efficient log analysis and monitoring system, and provide some suggestions and development guidelines.
 Known as the next generation monitoring system, let's see how powerful it is!
Aug 03, 2023 pm 03:40 PM
Prometheus is an open source monitoring and alarm system based on a time series database. Speaking of Prometheus, we have to mention SoundCloud, which is an online music sharing platform, similar to YouTube for video sharing, because they are getting more and more on the road of microservice architecture. Nowadays, hundreds or thousands of services have emerged, and there are a lot of limitations in using traditional monitoring systems StatsD and Graphite.


