
 Operation and Maintenance
Linux Operation and Maintenance
Linux operation and maintenance troubleshooting ideas, this article is enough~
Operation and Maintenance
Linux Operation and Maintenance
Linux operation and maintenance troubleshooting ideas, this article is enough~
Linux operation and maintenance troubleshooting ideas, this article is enough~
#1. Background
Sometimes you encounter some difficult and complicated diseases, and the monitoring plug-in cannot be used immediately at a glance Discover the root of the problem. At this time, you need to log in to the server to further analyze the root cause of the problem. Then analyzing problems requires a certain amount of technical experience accumulation, and some problems involve very wide areas in order to locate the problem. Therefore, analyzing problems and stepping into pitfalls is a great exercise for one's growth and self-improvement. If we have a good set of analysis tools, it will be twice the result with half the effort, helping everyone quickly locate problems and saving everyone a lot of time to do more in-depth work.

2. Description
This article The article mainly introduces various problem positioning tools and analyzes problems based on cases.
3. Methodology for analyzing problems
What-What is the phenomenon like When-When does it happen Why-Why did it happen Where-Where did the problem happen How much-how many resources were consumed How to do-how to solve the problem
4. cpu
4.1 Description
For applications, we usually focus on the kernel CPU scheduler function and performance.
Thread status analysis mainly analyzes where thread time is used, and the classification of thread status is generally divided into:
on- CPU: During execution, the time during execution is usually divided into user mode time user and system mode time sys.
off-CPU: Waiting for the next round of CPU, or waiting for I/O, lock, page change, etc., its status can be subdivided into executable , anonymous paging, sleep, lock, idle and other states.
Processor Core Hardware thread CPU memory cache Clock frequency CPI and instructions per cycle IPC CPU instructions Usage rate User time/kernel time Scheduler Run Queue Preemption Multiple processes Multiple threads Word length
##4.2 Analysis tools
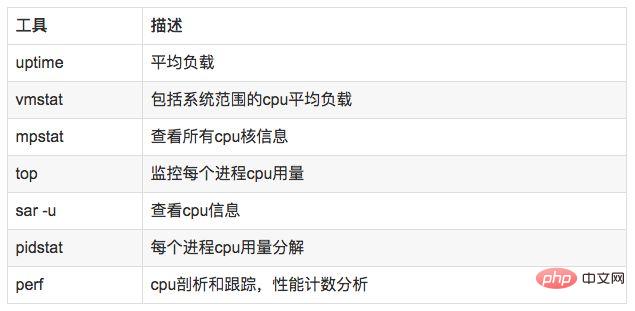
##uptime, vmstat, mpstat, top, pidstat can only query the usage of cpu and load. perf can follow the time-consuming status of specific functions within the process, and can specify kernel functions for statistics, and specify which ones to hit.
//查看系统cpu使用情况top
//查看所有cpu核信息mpstat -P ALL 1
//查看cpu使用情况以及平均负载vmstat 1
//进程cpu的统计信息pidstat -u 1 -p pid
//跟踪进程内部函数级cpu使用情况 perf top -p pid -e cpu-clock
5. Memory
5.1 Note
牛逼啊!接私活必备的 N 个开源项目!赶快收藏
主存 虚拟内存 常驻内存 地址空间 OOM 页缓存 缺页 换页 交换空间 交换 用户分配器libc、glibc、libmalloc和mtmalloc LINUX内核级SLUB分配器
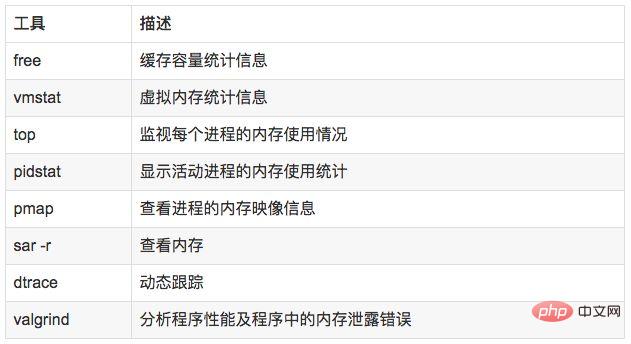
5.2 分析工具
说明:
free,vmstat,top,pidstat,pmap只能统计内存信息以及进程的内存使用情况。
valgrind 可以分析内存泄漏问题。
dtrace 动态跟踪。需要对内核函数有很深入的了解,通过D语言编写脚本完成跟踪。
5.3 使用方式
//查看系统内存使用情况free -m//虚拟内存统计信息vmstat 1//查看系统内存情况top//1s采集周期,获取内存的统计信息pidstat -p pid -r 1//查看进程的内存映像信息pmap -d pid//检测程序内存问题valgrind --tool=memcheck --leak-check=full --log-file=./log.txt ./程序名
6. 磁盘IO
6.1 说明
在理解磁盘IO之前,同样我们需要理解一些概念,例如:
File System VFS # #File system cache page cachepage cache buffer cache buffer cache Directory cache - ##inode
- inode cache
- noop calling strategy
6.3 使用方式
//查看系统io信息iotop//统计io详细信息iostat -d -x -k 1 10//查看进程级io的信息pidstat -d 1 -p pid//查看系统IO的请求,比如可以在发现系统IO异常时,可以使用该命令进行调查,就能指定到底是什么原因导致的IO异常perf record -e block:block_rq_issue -ag^Cperf report
7. 网络
7.1 说明
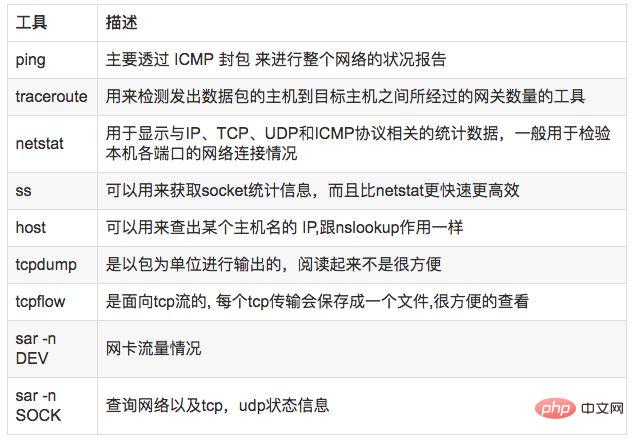
7.2 分析工具
7.3 使用方式
//显示网络统计信息netstat -s//显示当前UDP连接状况netstat -nu//显示UDP端口号的使用情况netstat -apu//统计机器中网络连接各个状态个数netstat -a | awk '/^tcp/ {++S[$NF]} END {for(a in S) print a, S[a]}'//显示TCP连接ss -t -a//显示sockets摘要信息ss -s//显示所有udp socketsss -u -a//tcp,etcp状态sar -n TCP,ETCP 1//查看网络IOsar -n DEV 1//抓包以包为单位进行输出tcpdump -i eth1 host 192.168.1.1 and port 80 //抓包以流为单位显示数据内容tcpflow -cp host 192.168.1.18. 系统负载
8.1 说明
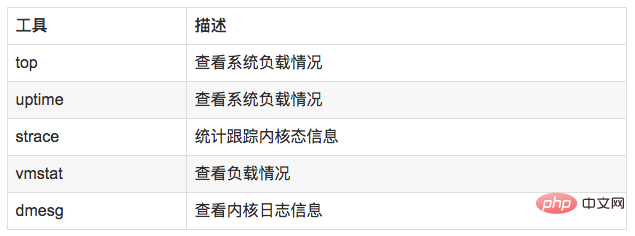
8.2 分析工具
8.3 使用方式
//查看负载情况uptimetopvmstat//统计系统调用耗时情况strace -c -p pid//跟踪指定的系统操作例如epoll_waitstrace -T -e epoll_wait -p pid//查看内核日志信息dmesg
9. 火焰图
9.1 说明
常见的火焰图类型有 On-CPU、Off-CPU、Memory、Hot/Cold、Differential等等。
9.2 安装依赖库
//安装systemtap,默认系统已安装yum install systemtap systemtap-runtime//内核调试库必须跟内核版本对应,例如:uname -r 2.6.18-308.el5kernel-debuginfo-2.6.18-308.el5.x86_64.rpmkernel-devel-2.6.18-308.el5.x86_64.rpmkernel-debuginfo-common-2.6.18-308.el5.x86_64.rpm//安装内核调试库debuginfo-install --enablerepo=debuginfo search kerneldebuginfo-install --enablerepo=debuginfo search glibc
9.3 安装
git clone https://github.com/lidaohang/quick_location.gitcd quick_location
9.4 CPU级别火焰图
cpu占用过高,或者使用率提不上来,你能快速定位到代码的哪块有问题吗?
一般的做法可能就是通过日志等方式去确定问题。现在我们有了火焰图,能够非常清晰的发现哪个函数占用cpu过高,或者过低导致的问题。另外,搜索公众号Linux就该这样学后台回复“猴子”,获取一份惊喜礼包。
9.4.1 on-CPU
//on-CPU usersh ngx_on_cpu_u.sh pid//进入结果目录 cd ngx_on_cpu_u//on-CPU kernelsh ngx_on_cpu_k.sh pid//进入结果目录 cd ngx_on_cpu_k//开一个临时端口 8088 python -m SimpleHTTPServer 8088//打开浏览器输入地址127.0.0.1:8088/pid.svg
DEMO:
#include <stdio.h>#include <stdlib.h>
void foo3(){  }
void foo2(){    int i;    for(i=0 ; i < 10; i++)           foo3();}
void foo1(){    int i;  for(i = 0; i< 1000; i++)      foo3();}
int main(void){ int i; for( i =0; i< 1000000000; i++) { foo1(); foo2(); }}DEMO火焰图:

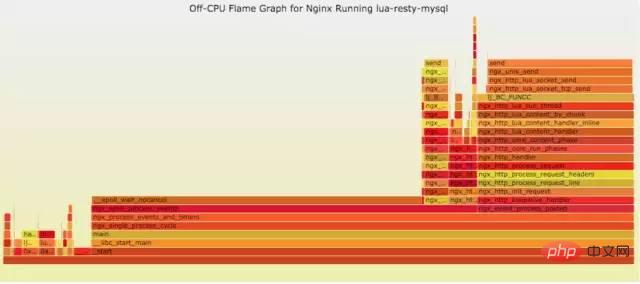
9.4.2 off-CPU
cpu过低,利用率不高。等待下一轮CPU,或者等待I/O、锁、换页等等,其状态可以细分为可执行、匿名换页、睡眠、锁、空闲等状态。
使用方式:
// off-CPU usersh ngx_off_cpu_u.sh pid//进入结果目录cd ngx_off_cpu_u//off-CPU kernelsh ngx_off_cpu_k.sh pid//进入结果目录cd ngx_off_cpu_k//开一个临时端口8088python -m SimpleHTTPServer 8088//打开浏览器输入地址127.0.0.1:8088/pid.svg
官网DEMO:
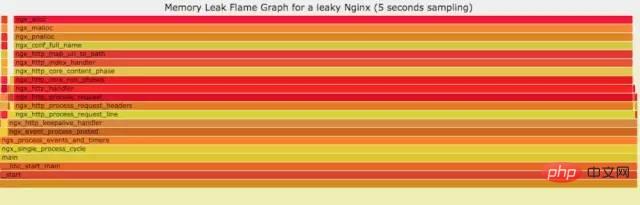
9.5 内存级别火焰图
如果线上程序出现了内存泄漏,并且只在特定的场景才会出现。这个时候我们怎么办呢?有什么好的方式和工具能快速的发现代码的问题呢?同样内存级别火焰图帮你快速分析问题的根源。
使用方式:
sh ngx_on_memory.sh pid//进入结果目录cd ngx_on_memory//开一个临时端口8088python -m SimpleHTTPServer 8088//打开浏览器输入地址127.0.0.1:8088/pid.svg
官网DEMO:
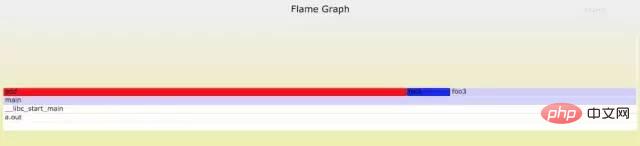
9.6 性能回退-红蓝差分火焰图
你能快速定位CPU性能回退的问题么?如果你的工作环境非常复杂且变化快速,那么使用现有的工具是来定位这类问题是很具有挑战性的。当你花掉数周时间把根因找到时,代码已经又变更了好几轮,新的性能问题又冒了出来。主要可以用到每次构建中,每次上线做对比看,如果损失严重可以立马解决修复。
通过抓取了两张普通的火焰图,然后进行对比,并对差异部分进行标色:红色表示上升,蓝色表示下降。差分火焰图是以当前(“修改后”)的profile文件作为基准,形状和大小都保持不变。因此你通过色彩的差异就能够很直观的找到差异部分,且可以看出为什么会有这样的差异。
使用方式:
cd quick_location//抓取代码修改前的profile 1文件perf record -F 99 -p pid -g -- sleep 30perf script > out.stacks1//抓取代码修改后的profile 2文件perf record -F 99 -p pid -g -- sleep 30perf script > out.stacks2//生成差分火焰图:./FlameGraph/stackcollapse-perf.pl ../out.stacks1 > out.folded1./FlameGraph/stackcollapse-perf.pl ../out.stacks2 > out.folded2./FlameGraph/difffolded.pl out.folded1 out.folded2 | ./FlameGraph/flamegraph.pl > diff2.svg
DEMO:
//test.c#include <stdio.h>#include <stdlib.h>
void foo3(){  }
void foo2(){    int i;    for(i=0 ; i < 10; i++)      foo3();}
void foo1(){    int i;    for(i = 0; i< 1000; i++)       foo3();}
int main(void){    int i;  for( i =0; i< 1000000000; i++) {      foo1();      foo2();    }}
//test1.c#include <stdio.h>#include <stdlib.h>
void foo3(){
}
void foo2(){  int i;  for(i=0 ; i < 10; i++)         foo3();}
void foo1(){    int i;    for(i = 0; i< 1000; i++)         foo3();}
void add(){    int i;    for(i = 0; i< 10000; i++)       foo3();}
int main(void){ int i; for( i =0; i< 1000000000; i++) { foo1(); foo2(); add(); }}DEMO红蓝差分火焰图:
10. Case Analysis
10.1 Access layer nginx cluster anomaly
10.2 Analyze nginx related indicators
a) **Analyze nginx request traffic:
Conclusion:
From the above figure, we find that the traffic did not increase suddenly, but decreased, which has nothing to do with the sudden increase in request traffic.
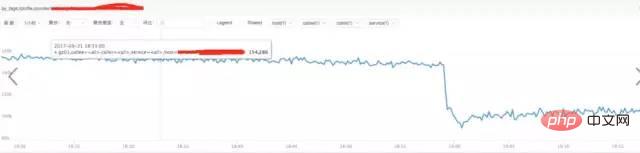
b) **Analysis of nginx response time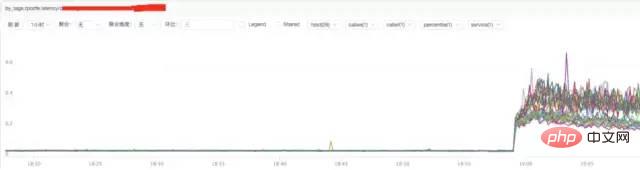
Conclusion:
Through the above figure, we find that the increase in nginx response time may be related to nginx itself or to the backend upstream response time.
c) **Analysis of nginx upstream response time

##Conclusion:
It is found from the above figure that the nginx upstream response time has increased. It is currently speculated that the backend upstream response time may be holding back nginx, causing nginx to experience abnormal request traffic.
10.3 Analyze system CPU situation
a) **Observe system indicators through top
top
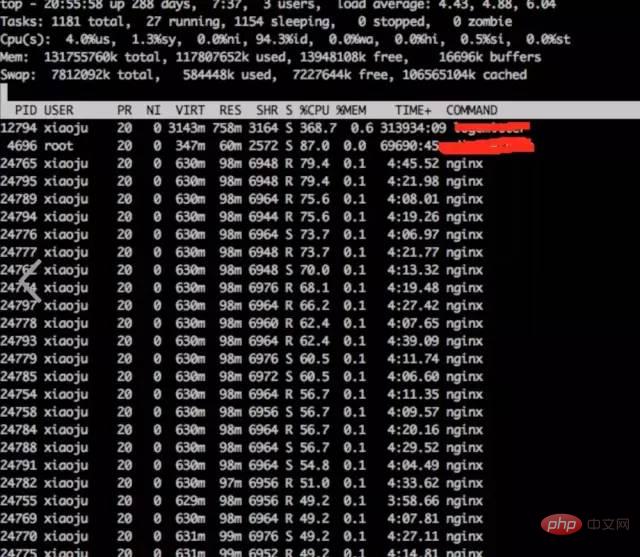
Conclusion:
It is found that nginx worker cpu is relatively high
b) **Analyze the internal cpu situation of nginx process
perf top -p pid
结论:
发现主要开销在free,malloc,json解析上面
10.4 火焰图分析cpu
a) **生成用户态cpu火焰图
//on-CPU usersh ngx_on_cpu_u.sh pid//进入结果目录cd ngx_on_cpu_u//开一个临时端口8088python -m SimpleHTTPServer 8088//打开浏览器输入地址127.0.0.1:8088/pid.svg

结论:
发现代码里面有频繁的解析json操作,并且发现这个json库性能不高,占用cpu挺高。
10.5 案例总结
a) 分析请求流量异常,得出nginx upstream后端机器响应时间拉长
b) Analyzing the high cpu of the nginx process, it is concluded that the nginx internal module code has time-consuming json parsing and memory allocation and recycling operations
10.5 .1 In-depth analysis
Based on the conclusions of the above two points of analysis, we will further analyze in depth.
The backend upstream response is lengthened, which may affect nginx's processing capabilities at most. But it is unlikely to affect nginx internal modules taking up too much CPU operations. And the modules that occupied a lot of CPU at that time were only executed when requested. It is unlikely that the upstram backend is holding nginx back, thereby triggering the time-consuming operation of this CPU.
10.5.2 Solution
When encountering this kind of problem, we give priority to solving known and very clear problems. That's the problem with high CPU. The solution is to downgrade and close the module that consumes too much CPU, and then observe. After downgrading and shutting down the module, the CPU dropped, and nginx request traffic became normal. The reason why upstream time is lengthened is because the interface called by the upstream backend service may be a loop and go back to nginx again.
11.参考资料
http://www.brendangregg.com/index.html
http://www.brendangregg.com/FlameGraphs/cpuflamegraphs.html
http://www.brendangregg.com/FlameGraphs/memoryflamegraphs.html
http://www.brendangregg.com/FlameGraphs/offcpuflamegraphs.html
http://www.brendangregg.com/blog/2014-11-09/differential-flame-graphs.html
https://github.com/openresty/openresty-systemtap-toolkit
https://github.com/brendangregg/FlameGraph
https://www.slideshare.net/brendangregg/blazing-performance-with-flame-graphs
The above is the detailed content of Linux operation and maintenance troubleshooting ideas, this article is enough~. For more information, please follow other related articles on the PHP Chinese website!

Hot AI Tools

Undresser.AI Undress
AI-powered app for creating realistic nude photos

AI Clothes Remover
Online AI tool for removing clothes from photos.

Undress AI Tool
Undress images for free

Clothoff.io
AI clothes remover

AI Hentai Generator
Generate AI Hentai for free.

Hot Article
Hot Tools

Notepad++7.3.1
Easy-to-use and free code editor

SublimeText3 Chinese version
Chinese version, very easy to use

Zend Studio 13.0.1
Powerful PHP integrated development environment

Dreamweaver CS6
Visual web development tools

SublimeText3 Mac version
God-level code editing software (SublimeText3)
Hot Topics
 1376
1376
 52
52

 How to solve permission issues when using python --version command in Linux terminal?
Apr 02, 2025 am 06:36 AM
How to solve permission issues when using python --version command in Linux terminal?
Apr 02, 2025 am 06:36 AM
Using python in Linux terminal...
 Four ways to implement multithreading in C language
Apr 03, 2025 pm 03:00 PM
Four ways to implement multithreading in C language
Apr 03, 2025 pm 03:00 PM
Multithreading in the language can greatly improve program efficiency. There are four main ways to implement multithreading in C language: Create independent processes: Create multiple independently running processes, each process has its own memory space. Pseudo-multithreading: Create multiple execution streams in a process that share the same memory space and execute alternately. Multi-threaded library: Use multi-threaded libraries such as pthreads to create and manage threads, providing rich thread operation functions. Coroutine: A lightweight multi-threaded implementation that divides tasks into small subtasks and executes them in turn.
 How to open web.xml
Apr 03, 2025 am 06:51 AM
How to open web.xml
Apr 03, 2025 am 06:51 AM
To open a web.xml file, you can use the following methods: Use a text editor (such as Notepad or TextEdit) to edit commands using an integrated development environment (such as Eclipse or NetBeans) (Windows: notepad web.xml; Mac/Linux: open -a TextEdit web.xml)
 Can the Python interpreter be deleted in Linux system?
Apr 02, 2025 am 07:00 AM
Can the Python interpreter be deleted in Linux system?
Apr 02, 2025 am 07:00 AM
Regarding the problem of removing the Python interpreter that comes with Linux systems, many Linux distributions will preinstall the Python interpreter when installed, and it does not use the package manager...
 What is the Linux best used for?
Apr 03, 2025 am 12:11 AM
What is the Linux best used for?
Apr 03, 2025 am 12:11 AM
Linux is best used as server management, embedded systems and desktop environments. 1) In server management, Linux is used to host websites, databases, and applications, providing stability and reliability. 2) In embedded systems, Linux is widely used in smart home and automotive electronic systems because of its flexibility and stability. 3) In the desktop environment, Linux provides rich applications and efficient performance.
 How is Debian Hadoop compatibility
Apr 02, 2025 am 08:42 AM
How is Debian Hadoop compatibility
Apr 02, 2025 am 08:42 AM
DebianLinux is known for its stability and security and is widely used in server, development and desktop environments. While there is currently a lack of official instructions on direct compatibility with Debian and Hadoop, this article will guide you on how to deploy Hadoop on your Debian system. Debian system requirements: Before starting Hadoop configuration, please make sure that your Debian system meets the minimum operating requirements of Hadoop, which includes installing the necessary Java Runtime Environment (JRE) and Hadoop packages. Hadoop deployment steps: Download and unzip Hadoop: Download the Hadoop version you need from the official ApacheHadoop website and solve it
 Is Debian Strings compatible with multiple browsers
Apr 02, 2025 am 08:30 AM
Is Debian Strings compatible with multiple browsers
Apr 02, 2025 am 08:30 AM
"DebianStrings" is not a standard term, and its specific meaning is still unclear. This article cannot directly comment on its browser compatibility. However, if "DebianStrings" refers to a web application running on a Debian system, its browser compatibility depends on the technical architecture of the application itself. Most modern web applications are committed to cross-browser compatibility. This relies on following web standards and using well-compatible front-end technologies (such as HTML, CSS, JavaScript) and back-end technologies (such as PHP, Python, Node.js, etc.). To ensure that the application is compatible with multiple browsers, developers often need to conduct cross-browser testing and use responsiveness
 Do I need to install an Oracle client when connecting to an Oracle database using Go?
Apr 02, 2025 pm 03:48 PM
Do I need to install an Oracle client when connecting to an Oracle database using Go?
Apr 02, 2025 pm 03:48 PM
Do I need to install an Oracle client when connecting to an Oracle database using Go? When developing in Go, connecting to Oracle databases is a common requirement...
