
 Operation and Maintenance
Linux Operation and Maintenance
Summary of Linux performance optimization knowledge points · Practice + Collection Edition
Operation and Maintenance
Linux Operation and Maintenance
Summary of Linux performance optimization knowledge points · Practice + Collection Edition
Summary of Linux performance optimization knowledge points · Practice + Collection Edition

Part1Linux performance optimization
##1 Performance optimization
Performance indicators
High concurrency and fast response correspond to the two cores of performance optimization Metrics:Throughput and Latency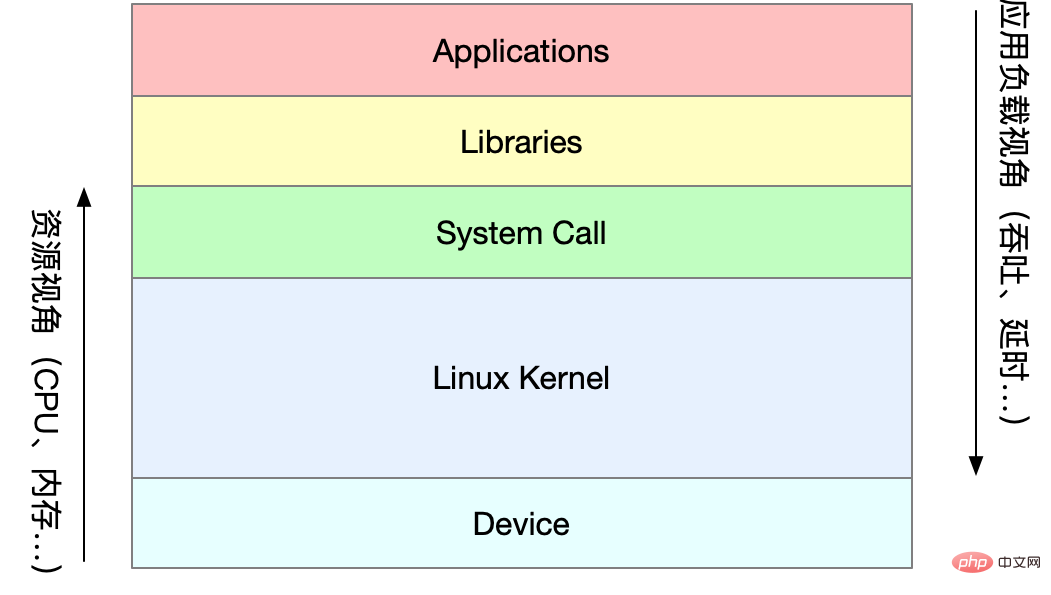
##Application loadAngle: Directly affects the user experience of the product terminal System resourcesPerspective: resource usage, saturation, etc.
The essence of performance problemsThat is, the system resources have reached the bottleneck, but the request processing is not fast enough to support more requests. Performance analysis is actually to find the bottlenecks of the application or system and try to avoid or alleviate them.
Select metrics to evaluate application and system performance Set performance goals for applications and systems Proceed Performance benchmark test Performance analysis to locate bottlenecks Performance monitoring and alarm
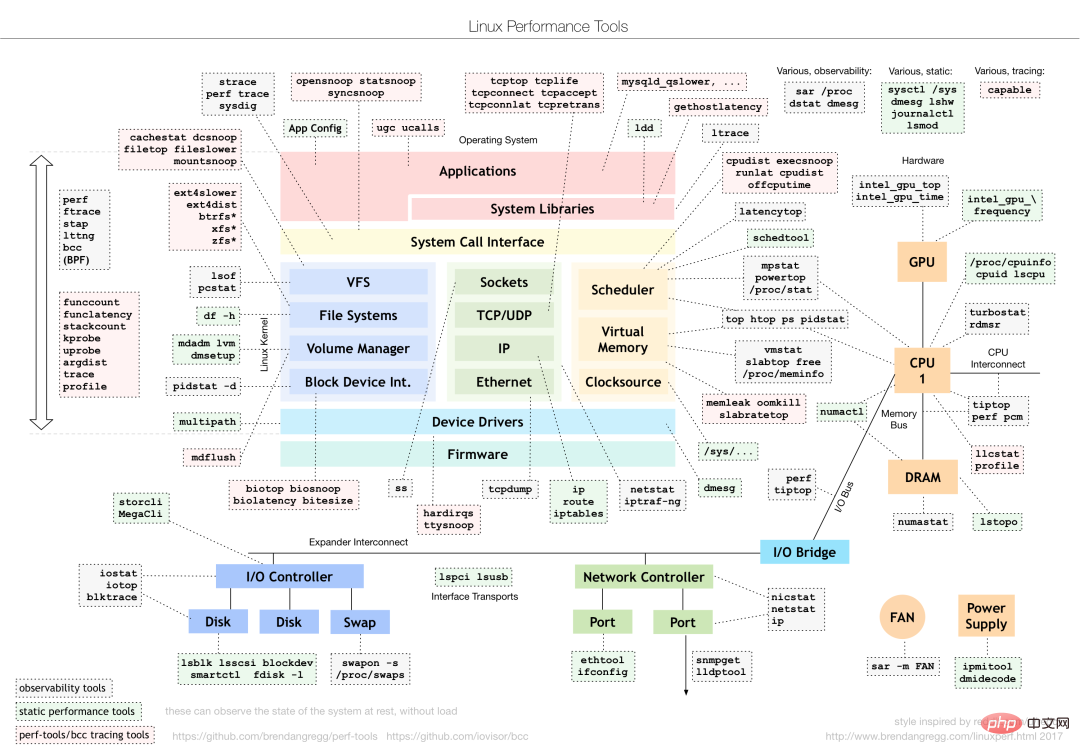
For different Performance issues require the selection of different performance analysis tools. The following are commonly used Linux Performance Tools and the corresponding types of performance problems analyzed.
##How should we understand "average load"
Average load: The average number of processes in the system's runnable and uninterruptible states per unit time, that is, the average number of active processes. It is not directly related to CPU usage as we traditionally understand it.
The uninterruptible process is a process that is in a critical process in the kernel state (such as a common I/O response waiting for a device).The uninterruptible state is actually a protection mechanism of the system for processes and hardware devices.
What is the reasonable average load?
In the actual production environment, monitor the average load of the system and determine the load change trend based on historical data. When there is an obvious upward trend in load, conduct timely analysis and investigation. Of course, you can also set a threshold (such as when the average load is higher than 70% of the number of CPUs)
In real work, we often confuse the concepts of average load and CPU usage. In fact, the two are not completely equivalent. :
CPU-intensive process, a large amount of CPU usage will cause the average load to increase, at this time the two are consistent I/O-intensive Processes, waiting for I/O will also cause the average load to increase. At this time, the CPU usage is not necessarily high. A large number of process scheduling waiting for the CPU will cause the average load to increase. At this time, The CPU usage will also be relatively high
#When the average load is high, it may be caused by CPU-intensive processes or busy I/O. During specific analysis, you can combine the mpstat/pidstat tool to assist in analyzing the load source
2CPU
##CPU context switching (Part 1)
CPU context switching is to save the CPU context (CPU registers and PC) of the previous task, then load the context of the new task into these registers and program counter, and finally Then jump to the location pointed by the program counter and run the new task. Among them, the saved context will be stored in the system kernel and loaded again when the task is rescheduled for execution to ensure that the original task status is not affected. Follow the Linux Chinese community
According to task type, CPU context switching is divided into:Process context switching Thread context switching Interrupt context switching
Process context switching
Linux process divides the running space of the process into kernel space and user space according to the level of permissions. The transition from user mode to kernel mode needs to be completed through system calls.
A system call process actually performs two CPU context switches:
The user mode instruction position in the CPU register is saved first, the CPU register is updated to the kernel mode instruction position, and jumps to the kernel mode to run the kernel task; After the system call is completed, the CPU register restores the originally saved user state data, and then switches to user space to continue running.
The system call process does not involve process user-mode resources such as virtual memory, nor does it switch processes. It is different from process context switching in the traditional sense. Therefore system calls are often called privileged mode switches.
The process is managed and scheduled by the kernel, and process context switching can only occur in the kernel state. Therefore, compared with system calls, before saving the kernel state and CPU registers of the current process, the virtual memory and stack of the process need to be saved first. After loading the kernel state of the new process, the virtual memory and user stack of the process must be refreshed.
The process only needs to switch context when it is scheduled to run on the CPU. There are the following scenarios: CPU time slices are allocated in turns, insufficient system resources cause the process to hang, the process actively hangs through the sleep function, high priority The first-level process seizes the time slice. When the hardware interrupts, the process on the CPU is suspended and instead executes the interrupt service in the kernel.
Thread context switching
Thread context switching is divided into two types:
The front and rear threads belong to the same process. The virtual memory resources remain unchanged when switching. You only need to switch the thread's private data, registers, etc.; The front and rear threads belong to the same process. Different processes, the same as process context switching.
Thread switching in the same process consumes less resources, which is also the advantage of multi-threading.
Interrupt context switching
Interrupt context switching does not involve the user mode of the process, so the interrupt context only includes the state necessary for the execution of the kernel mode interrupt service program (CPU registers, kernel stack, hardware interrupt parameters, etc.).
Interrupt processing priority is higher than that of the process, so interrupt context switching and process context switching will not occur at the same time
CPU context switching (Part 2)
You can view the overall context switching situation of the system through vmstat
vmstat 5         #每隔5s输出一组数据
procs -----------memory---------- ---swap-- -----io---- -system-- ------cpu-----
 r  b   swpd   free   buff  cache   si   so    bi    bo   in   cs us sy id wa st
 1  0      0 103388 145412 511056    0    0    18    60    1    1  2  1 96  0  0
 0  0      0 103388 145412 511076    0    0     0     2  450 1176  1  1 99  0  0
 0  0      0 103388 145412 511076    0    0     0     8  429 1135  1  1 98  0  0
 0  0      0 103388 145412 511076    0    0     0     0  431 1132  1  1 98  0  0
 0  0      0 103388 145412 511076    0    0     0    10  467 1195  1  1 98  0  0
 1  0      0 103388 145412 511076    0    0     0     2  426 1139  1  0 99  0  0
 4  0      0  95184 145412 511108    0    0     0    74  500 1228  4  1 94  0  0
 0  0      0 103512 145416 511076    0    0     0   455  723 1573 12  3 83  2  0
cs (context switch) Number of context switches per second in (interrupt) Number of interrupts per second r (running or runnable) ready queue The length of For detailed information about each process, you need to use pidstat to view the context switching of each process pidstat -w 5 14时51分16秒 UID PID cswch/s nvcswch/s Command 14时51分21秒 0 1 0.80 0.00 systemd 14时51分21秒 0 6 1.40 0.00 ksoftirqd/0 14时51分21秒 0 9 32.67 0.00 rcu_sched 14时51分21秒 0 11 0.40 0.00 watchdog/0 14时51分21秒 0 32 0.20 0.00 khugepaged 14时51分21秒 0 271 0.20 0.00 jbd2/vda1-8 14时51分21秒 0 1332 0.20 0.00 argusagent 14时51分21秒 0 5265 10.02 0.00 AliSecGuard 14时51分21秒 0 7439 7.82 0.00 kworker/0:2 14时51分21秒 0 7906 0.20 0.00 pidstat 14时51分21秒 0 8346 0.20 0.00 sshd 14时51分21秒 0 20654 9.82 0.00 AliYunDun 14时51分21秒 0 25766 0.20 0.00 kworker/u2:1 14时51分21秒 0 28603 1.00 0.00 python3
Copy after logincswch 每秒自愿上下文切换次数 (进程无法获取所需资源导致的上下文切换) nvcswch 每秒非自愿上下文切换次数 (时间片轮流等系统强制调度)
vmstat 1 1    #首先获取空闲系统的上下文切换次数
sysbench --threads=10 --max-time=300 threads run #模拟多线程切换问题

vmstat 1 1    #新终端观察上下文切换情况
此时发现cs数据明显升高,同时观察其他指标:
r列: 远超系统CPU个数,说明存在大量CPU竞争
us和sy列:sy列占比80%,说明CPU主要被内核占用
in列: 中断次数明显上升,说明中断处理也是潜在问题
Copy after login说明运行/等待CPU的进程过多,导致大量的上下文切换,上下文切换导致系统的CPU占用率高
pidstat -w -u 1 #查看到底哪个进程导致的问题
Copy after login从结果中看出是sysbench导致CPU使用率过高,但是pidstat输出的上下文次数加起来也并不多。分析sysbench模拟的是线程的切换,因此需要在pidstat后加-t参数查看线程指标。
另外对于中断次数过多,我们可以通过/proc/interrupts文件读取
watch -d cat /proc/interrupts
Copy after login发现次数变化速度最快的是重调度中断(RES),该中断用来唤醒空闲状态的CPU来调度新的任务运行。分析还是因为过多任务的调度问题,和上下文切换分析一致。
The CPU usage of an application reaches 100%, what should I do?
Linux, as a multi-tasking operating system, divides the CPU time into short time slices and allocates them to each task in turn through the scheduler. In order to maintain CPU time, Linux triggers time interrupts through pre-defined beat rates and uses global jiffies to record the number of beats since booting. Time interrupt occurs once. This value is 1.
CPU usage, the percentage of total CPU time other than idle time. CPU usage can be calculated from the data in /proc/stat. Because the cumulative value of the number of beats since booting in /proc/stat is calculated as the average CPU usage since booting, which is generally of little significance. You can calculate the average CPU usage during that period by taking the difference between two values taken at intervals of a period of time. The performance analysis tool gives the average CPU usage over a period of time. Pay attention to the setting of the interval.
CPU usage can be viewed through top or ps. You can analyze the CPU problems of the process through perf, which is based on performance event sampling. It can not only analyze various events of the system and kernel performance, but also can be used to analyze the performance problems of specified applications.
perf top / perf record / perf report (-g turns on the sampling of calling relationships)
sudo docker run --name nginx -p 10000:80 -itd feisky/nginx
sudo docker run --name phpfpm -itd --network container:nginx feisky/php-fpm

ab -c 10 -n 100 http://XXX.XXX.XXX.XXX:10000/ #测试Nginx服务性能
Copy after login发现此时每秒可承受请求给长少,此时将测试的请求数从100增加到10000。在另外一个终端运行top查看每个CPU的使用率。发现系统中几个php-fpm进程导致CPU使用率骤升。
接着用perf来分析具体是php-fpm中哪个函数导致该问题。
perf top -g -p XXXX #对某一个php-fpm进程进行分析
Copy after login发现其中sqrt和add_function占用CPU过多, 此时查看源码找到原来是sqrt中在发布前没有删除测试代码段,存在一个百万次的循环导致。将该无用代码删除后发现nginx负载能力明显提升
系统的CPU使用率很高,为什么找不到高CPU的应用?
sudo docker run --name nginx -p 10000:80 -itd feisky/nginx:sp
sudo docker run --name phpfpm -itd --network container:nginx feisky/php-fpm:sp
ab -c 100 -n 1000 http://XXX.XXX.XXX.XXX:10000/ #并发100个请求测试
Copy after login实验结果中每秒请求数依旧不高,我们将并发请求数降为5后,nginx负载能力依旧很低。
此时用top和pidstat发现系统CPU使用率过高,但是并没有发现CPU使用率高的进程。
出现这种情况一般时我们分析时遗漏的什么信息,重新运行top命令并观察一会。发现就绪队列中处于Running状态的进行过多,超过了我们的并发请求次数5. 再仔细查看进程运行数据,发现nginx和php-fpm都处于sleep状态,真正处于运行的却是几个stress进程。
下一步就利用pidstat分析这几个stress进程,发现没有任何输出。用ps aux交叉验证发现依旧不存在该进程。说明不是工具的问题。再top查看发现stress进程的进程号变化了,此时有可能时以下两种原因导致:
进程不停的崩溃重启(如段错误/配置错误等),此时进程退出后可能又被监控系统重启; 短时进程导致,即其他应用内部通过exec调用的外面命令,这些命令一般只运行很短时间就结束,很难用top这种间隔较长的工具来发现
可以通过pstree来查找 stress的父进程,找出调用关系。
pstree | grep stress
Copy after login发现是php-fpm调用的该子进程,此时去查看源码可以看出每个请求都会调用一个stress命令来模拟I/O压力。之前top显示的结果是CPU使用率升高,是否真的是由该stress命令导致的,还需要继续分析。代码中给每个请求加了verbose=1的参数后可以查看stress命令的输出,在中断测试该命令结果显示stress命令运行时存在因权限问题导致的文件创建失败的bug。
This is still just a guess. The next step is to continue analyzing it through the perf tool. The performance report shows that stress actually takes up a lot of CPU. It can be optimized and solved by fixing the permission problem.
What should I do if there are a large number of uninterruptible processes and zombie processes in the system?
Process status
R Running/Runnable, indicating that the process is in the ready queue of the CPU and is running or waiting to be run; D Disk Sleep, uninterruptible state sleep, generally indicates that the process is interacting with the hardware, and is not allowed to be interrupted by other processes during the interaction; Z Zombie, a zombie process, means that the process has actually ended, but the parent process has not reclaimed its resources; S Interruptible Sleep, which can interrupt the sleep state, means that the process is waiting for something Suspended by the system for an event, when the waiting event occurs, it will be awakened and enter the R state; I Idle, idle state, used on kernel threads that cannot interrupt sleep. This state will not cause the average load to increase; T Stop/Traced, indicating that the process is suspended or traced (SIGSTOP/SIGCONT, GDB debugging); X Dead, the process has died and will not be seen in top/ps.
对于不可中断状态,一般都是在很短时间内结束,可忽略。但是如果系统或硬件发生故障,进程可能会保持不可中断状态很久,甚至系统中出现大量不可中断状态,此时需注意是否出现了I/O性能问题。
僵尸进程一般多进程应用容易遇到,父进程来不及处理子进程状态时子进程就提前退出,此时子进程就变成了僵尸进程。大量的僵尸进程会用尽PID进程号,导致新进程无法建立。
磁盘O_DIRECT问题
sudo docker run --privileged --name=app -itd feisky/app:iowait
ps aux | grep '/app'
Copy after login可以看到此时有多个app进程运行,状态分别时Ss+和D+。其中后面s表示进程是一个会话的领导进程,+号表示前台进程组。
其中进程组表示一组相互关联的进程,子进程是父进程所在组的组员。会话指共享同一个控制终端的一个或多个进程组。
用top查看系统资源发现:1)平均负载在逐渐增加,且1分钟内平均负载达到了CPU个数,说明系统可能已经有了性能瓶颈;2)僵尸进程比较多且在不停增加;3)us和sys CPU使用率都不高,iowait却比较高;4)每个进程CPU使用率也不高,但有两个进程处于D状态,可能在等待IO。
分析目前数据可知:iowait过高导致系统平均负载升高,僵尸进程不断增长说明有程序没能正确清理子进程资源。
用dstat来分析,因为它可以同时查看CPU和I/O两种资源的使用情况,便于对比分析。
dstat 1 10 #间隔1秒输出10组数据
Copy after login可以看到当wai(iowait)升高时磁盘请求read都会很大,说明iowait的升高和磁盘的读请求有关。接下来分析到底时哪个进程在读磁盘。
之前top查看的处于D状态的进程号,用pidstat -d -p XXX 展示进程的I/O统计数据。发现处于D状态的进程都没有任何读写操作。在用pidstat -d 查看所有进程的I/O统计数据,看到app进程在进行磁盘读操作,每秒读取32MB的数据。进程访问磁盘必须使用系统调用处于内核态,接下来重点就是找到app进程的系统调用。
sudo strace -p XXX #对app进程调用进行跟踪
Copy after login报错没有权限,因为已经时root权限了。所以遇到这种情况,首先要检查进程状态是否正常。ps命令查找该进程已经处于Z状态,即僵尸进程。
这种情况下top pidstat之类的工具无法给出更多的信息,此时像第5篇一样,用perf record -d和perf report进行分析,查看app进程调用栈。
看到app确实在通过系统调用sys_read()读取数据,并且从new_sync_read和blkdev_direct_IO看出进程时进行直接读操作,请求直接从磁盘读,没有通过缓存导致iowait升高。
After layer-by-layer analysis, the root cause is direct disk I/O inside the app. Then locate the specific code location for optimization.
Zombie Process
After the above optimization, iowait has dropped significantly, but the number of zombie processes is still increasing. First, locate the parent process of the zombie process. Use pstree -aps XXX to print out the call tree of the zombie process and find that the parent process is the app process.
Check the app code to see if the child process end is handled correctly (whether wait()/waitpid() is called, whether there is a SIGCHILD signal processing function registered, etc.).
When encountering an increase in iowait, first use tools such as dstat pidstat to confirm whether there is a disk I/O problem, and then find out which processes are causing the I/O. If you cannot use strace to directly analyze process calls, you can Analyzed by perf tool.
For the zombie problem, use pstree to find the parent process, and then look at the source code to check the processing logic for the end of the child process.
CPU performance indicators
CPU usage
User CPU usage, including user mode (user) and low-priority user mode (nice). If this indicator is too high, it indicates that the application is busy. System CPU usage Rate, the percentage of time the CPU is running in kernel mode (excluding interrupts). A high indicator indicates that the kernel is relatively busy. CPU usage waiting for I/O, iowait, a high indicator It shows that the I/O interaction time between the system and the hardware device is relatively long. Soft/hard interrupt CPU usage. A high indicator indicates that a large number of interrupts occur in the system. steal CPU / guest CPU, indicates the percentage of CPU occupied by the virtual machine. ##Average loadIdeally average load Equal to the number of logical CPUs, it means that each CPU is fully utilized. If it is greater than the number, it means that the system load is heavy. Process context switching Includes voluntary switching when resources cannot be obtained and involuntary switching when the system forces scheduling. Context switching itself is a core function to ensure the normal operation of Linux. Excessive switching will consume the CPU time of the original running process in the register , kernel occupancy and virtual memory and other data saving and recovery
CPU cache hit rate
CPU cache reuse situation, the higher the hit rate The higher the performance, the better. L1/L2 is commonly used in single-core, and L3 is used in multi-core
Performance Tools
Load Average Case First use uptime to check the average load of the system After judging that the load has increased, use mpstat and pidstat to check the CPU usage of each CPU and each process respectively. Find There are processes that lead to higher load average. In addition, search the public account Linux and reply "git books" in the background to get a surprise gift package. Context switching case First use vmstat to check the system context switching and interrupt times Use pidstat to observe the voluntary and involuntary context switching of the process Finally, use pidstat to observe the context switching of the thread Case of high CPU usage of process First use top to check the CPU usage of the system and process, and locate the process Use perf top to observe the process call chain and locate the specific function Case of high system CPU usage - # #First use top to check the CPU usage of the system and process. Neither top/pidstat can find the process with high CPU usage
- Re-examine the top output
- Start with processes that have low CPU usage but are in the Running state
- perf record/report found that short-term processes caused (execsnoop tool)
- Case of uninterruptible and zombie processes
- First use top to observe the increase of iowait and find a large number of uninterruptible and zombie processes
- strace cannot trace process system calls
perf analysis call chain found that the root cause comes from disk direct I/O Soft interrupt case topObserve the high CPU usage of system soft interrupts Check /proc/softirqs to find several soft interrupts with fast changing rates sar The command found that it was a network packet problem tcpdump found out the type and source of the network frame, and determined that the SYN FLOOD attack caused
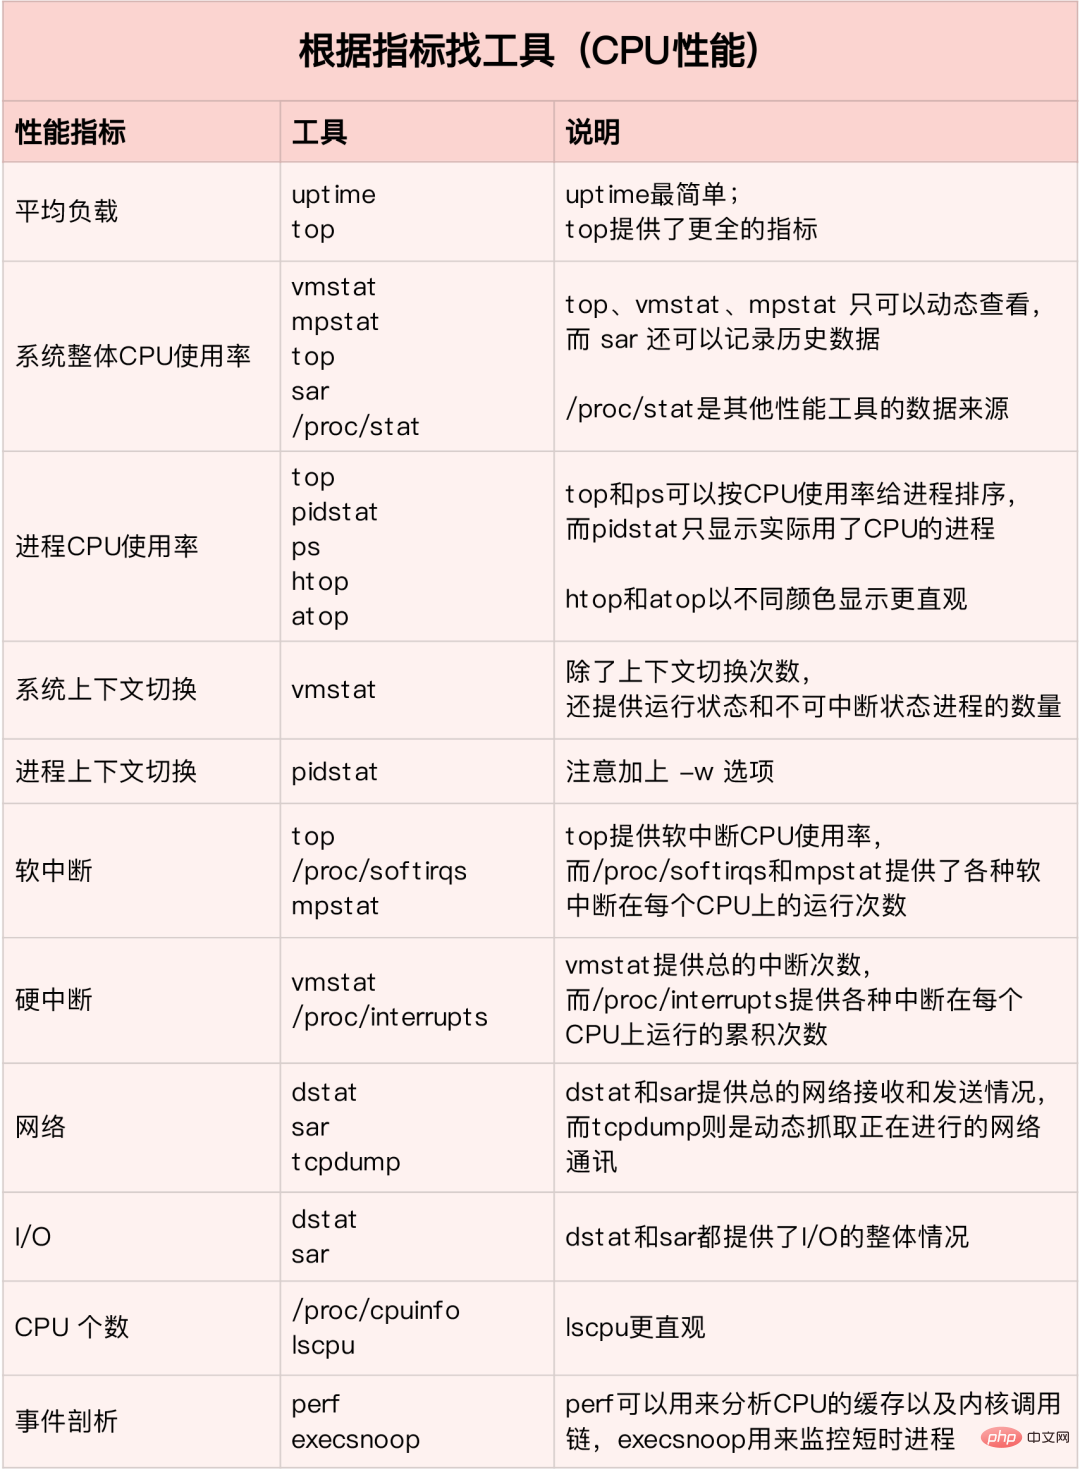
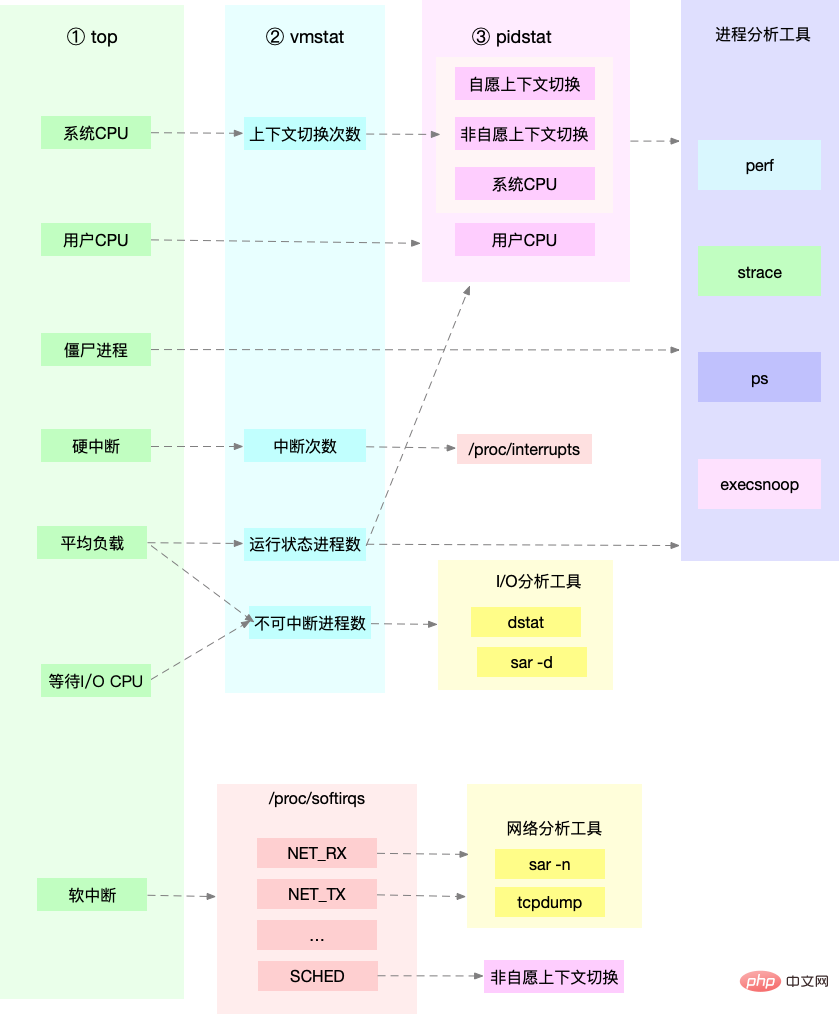
According to different Use the performance indicators to find the appropriate tool:

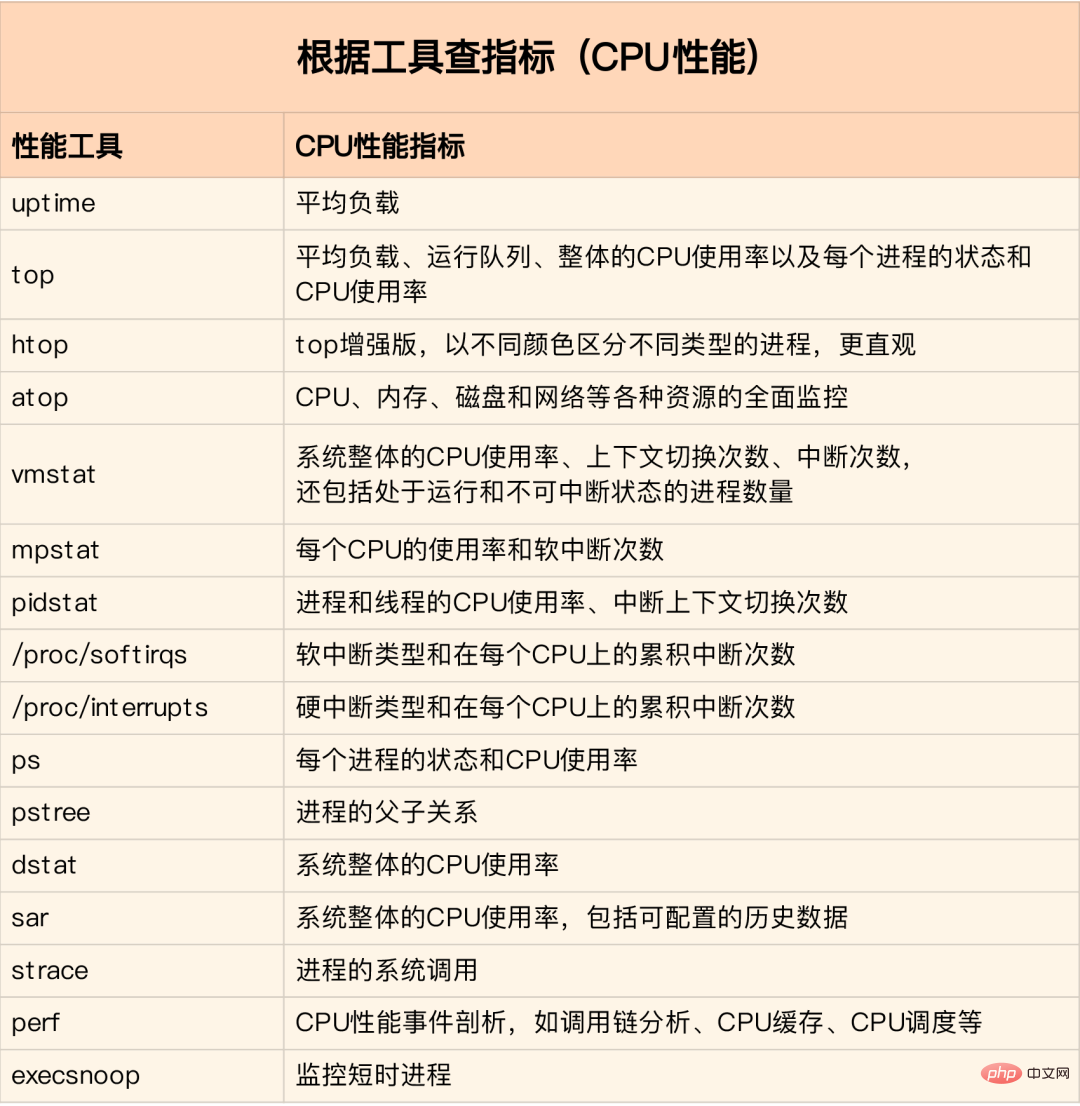
Picture from: www.ctq6.cn In a production environment, developers often do not have permission to install new tools. Toolkits can only make the most of the tools already installed in the system. Therefore, it is necessary to understand what indicator analysis some mainstream tools can provide.
Pictures from: www.ctq6.cn First run a few tools that support more indicators, such as top/vmstat/pidstat. Based on their output, you can get Find out what type of performance problem it is. After locating the process, use strace/perf to analyze the calling situation for further analysis. If it is caused by soft interrupt, use /proc/softirqs
Picture from: www .ctq6.cn CPU Optimization
##Application Optimization Compiler optimization: Enable optimization options during the compilation phase, such as gcc -O2 Algorithm optimization Asynchronous processing: Avoid the program from being blocked waiting for a certain resource, and improve the concurrent processing capability of the program. (Replace polling with event notification) Multi-thread replacement Multi-process: Reduce context switching costs Make good use of cache: Speed up program processing System optimization
CPU binding: Bind the process to one/multiple CPUs to improve the CPU cache hit rate and reduce context switching caused by CPU scheduling CPU exclusive: CPU affinity mechanism to allocate processes Priority adjustment: Use nice to appropriately reduce the priority of non-core applications Set resource display for the process: cgroups sets the usage limit to prevent an application from exhausting system resources NUMA optimization: CPU accesses local memory as much as possible Interrupt load balancing: irpbalance, automatically load balance the interrupt processing process to each CPU ##TPS, QPS , The difference and understanding of system throughput - ##QPS(TPS)
Number of concurrencies
Response time
QPS(TPS)=Number of concurrencies /Average response time
User request server
Server internal processing
The server returns to the client
QPS is similar to TPS, but a visit to a page forms a TPS, but a page request may include multiple requests to the server , may be counted multiple times QPS
QPS (Queries Per Second) query rate per second, the number of queries a server can respond to per second.
TPS (Transactions Per Second) number of transactions per second, software test results.
System Throughput, including several important parameters:
3Memory
How Linux memory works
Memory mapping
The main memory used by most computers is dynamic random access memory (DRAM) ), only the kernel can directly access physical memory. The Linux kernel provides an independent virtual address space for each process, and this address space is continuous. In this way, the process can easily access memory (virtual memory).
The interior of the virtual address space is divided into two parts: kernel space and user space. The range of the address space of processors with different word lengths is different. The 32-bit system kernel space occupies 1G and the user space occupies 3G. The kernel space and user space of 64-bit systems are both 128T, occupying the highest and lowest parts of the memory space respectively, and the middle part is undefined.
Not all virtual memory will allocate physical memory, only the actual use will. The allocated physical memory is managed through memory mapping. In order to complete memory mapping, the kernel maintains a page table for each process to record the mapping relationship between virtual addresses and physical addresses. The page table is actually stored in the CPU's memory management unit MMU, and the processor can directly find out the memory to be accessed through hardware.
When the virtual address accessed by the process cannot be found in the page table, the system will generate a page fault exception, enter the kernel space to allocate physical memory, update the process page table, and then return to user space to resume the operation of the process.
MMU manages memory in units of pages, with a page size of 4KB. In order to solve the problem of too many page table entries, Linux provides the Multi-level page table and HugePage mechanisms.
Virtual memory space distribution
User space memory has five different memory segments from low to high:
Read-only segment Code and constants, etc. ##Data segment Global variables, etc. Heap Dynamically allocated memory starts from low address and grows upward File mapping Dynamic library, shared memory Wait, starting from the high address and growing downward Stack Including local variables and the context of function calls, etc., the size of the stack is fixed. Generally 8MB
Memory allocation and recycling
Allocation
malloc corresponds to the system call Two implementation methods:brk() For small blocks of memory (<128K), allocate by moving the top position of the heap. The memory is not returned immediately after it is released, but is cached. **mmap()**For large blocks of memory (>128K), allocate directly using memory mapping, that is, find a free memory allocation in the file mapping segment.
The former cache can reduce the occurrence of page fault exceptions and improve memory access efficiency. However, because the memory is not returned to the system, frequent memory allocation/release will cause memory fragmentation when the memory is busy.
The latter is directly returned to the system when released, so a page fault exception will occur every time mmap occurs. When memory work is busy, frequent memory allocation will cause a large number of page fault exceptions, increasing the kernel management burden.
The above two calls do not actually allocate memory. These memories only enter the kernel through page fault exceptions when they are accessed for the first time, and are allocated by the kernel.
Recycling
When memory is tight, the system reclaims memory in the following ways:
回收缓存:LRU算法回收最近最少使用的内存页面;
回收不常访问内存:把不常用的内存通过交换分区写入磁盘
杀死进程:OOM内核保护机制 (进程消耗内存越大oom_score越大,占用CPU越多oom_score越小,可以通过/proc手动调整oom_adj)
echo -16 > /proc/$(pidof XXX)/oom_adj
Copy after login
如何查看内存使用情况
free来查看整个系统的内存使用情况
top/ps来查看某个进程的内存使用情况
VIRT The virtual memory size of the process RES The size of the resident memory, that is, the actual use of the process The physical memory size, excluding swap and shared memory SHR Shared memory size, memory shared with other processes, loaded dynamic link libraries and program code segments %MEM The percentage of physical memory used by the process to the total system memory
How to understand Buffer and Cache in memory?
buffer is a cache of disk data, cache is a cache of file data, they will be used in both read requests and write requests
How to use the system cache to optimize the running efficiency of the program
Cache hit rate
Cache hit Rate refers to the number of requests to obtain data directly through the cache, accounting for the percentage of all requests. The higher the hit rate, the higher the benefits brought by the cache and the better the performance of the application.
After installing the bcc package, you can monitor cache read and write hits through cachestat and cachetop.
After installing pcstat, you can view the cache size and cache ratio of files in memory
#首先安装Go
export GOPATH=~/go
export PATH=~/go/bin:$PATH
go get golang.org/x/sys/unix
go ge github.com/tobert/pcstat/pcstat
Copy after logindd缓存加速
dd if=/dev/sda1 of=file bs=1M count=512 #生产一个512MB的临时文件
echo 3 > /proc/sys/vm/drop_caches #清理缓存
pcstat file #确定刚才生成文件不在系统缓存中,此时cached和percent都是0
cachetop 5
dd if=file of=/dev/null bs=1M #测试文件读取速度
#此时文件读取性能为30+MB/s,查看cachetop结果发现并不是所有的读都落在磁盘上,读缓存命中率只有50%。
dd if=file of=/dev/null bs=1M #重复上述读文件测试
#此时文件读取性能为4+GB/s,读缓存命中率为100%
pcstat file #查看文件file的缓存情况,100%全部缓存
Copy after loginO_DIRECT选项绕过系统缓存
cachetop 5
sudo docker run --privileged --name=app -itd feisky/app:io-direct
sudo docker logs app #确认案例启动成功
#实验结果表明每读32MB数据都要花0.9s,且cachetop输出中显示1024次缓存全部命中
Copy after login但是凭感觉可知如果缓存命中读速度不应如此慢,读次数时1024,页大小为4K,五秒的时间内读取了1024*4KB数据,即每秒0.8MB,和结果中32MB相差较大。说明该案例没有充分利用缓存,怀疑系统调用设置了直接I/O标志绕过系统缓存。因此接下来观察系统调用.
strace -p $(pgrep app)
#strace 结果可以看到openat打开磁盘分区/dev/sdb1,传入参数为O_RDONLY|O_DIRECT
Copy after login这就解释了为什么读32MB数据那么慢,直接从磁盘读写肯定远远慢于缓存。找出问题后我们再看案例的源代码发现flags中指定了直接IO标志。删除该选项后重跑,验证性能变化。
内存泄漏,如何定位和处理?
对应用程序来说,动态内存的分配和回收是核心又复杂的一个逻辑功能模块。管理内存的过程中会发生各种各样的“事故”:
The allocated memory is not properly reclaimed, resulting in leakage The address outside the allocated memory boundary is accessed, causing the program to exit abnormally
Memory allocation and recycling
Virtual memory distribution from low to high is read-only segment, data segment, heap, memory mapping segment, StackFive parts. Among them, the ones that can cause memory leaks are:
Heap: allocated and managed by the application itself. Unless the program exits, these heap memories will not be automatically released by the system. Memory mapping segment: including dynamic link libraries and shared memory, where shared memory is automatically allocated and managed by the program
Memory leak The harm is greater. Not only can the application itself not access the memory that is forgotten to be released, but the system cannot allocate it to other applications again. Memory leaks accumulate and may even exhaust system memory.
如何检测内存泄漏
预先安装systat,docker,bcc
sudo docker run --name=app -itd feisky/app:mem-leak
sudo docker logs app
vmstat 3
Copy after login可以看到free在不断下降,buffer和cache基本保持不变。说明系统的内存一致在升高。但并不能说明存在内存泄漏。此时可以通过memleak工具来跟踪系统或进程的内存分配/释放请求
/usr/share/bcc/tools/memleak -a -p $(pidof app)
Copy after login从memleak输出可以看到,应用在不停地分配内存,并且这些分配的地址并没有被回收。通过调用栈看到是fibonacci函数分配的内存没有释放。定位到源码后查看源码来修复增加内存释放函数即可.
为什么系统的Swap变高
系统内存资源紧张时通过内存回收和OOM杀死进程来解决。其中可回收内存包括:
Cache/buffer is a recyclable resource, usually called a file page in file management In the application, fsync is used to remove dirty files The pages are synchronized to the disk and handed over to the system. The kernel thread pdflush is responsible for refreshing these dirty pages. has been modified by the application and has not been written yet. Disk data (dirty pages) must be written to the disk first before the memory can be released. The file mapping page obtained by memory mapping can also be released the next time it is accessed. Re-read from the file
For the heap memory automatically allocated by the program, which is our anonymous page in memory management, although this memory cannot be released directly, Linux provides the Swap mechanism to The memory that is not frequently accessed is written to the disk to free up the memory, and the memory can be read from the disk when accessed again.
Swap principle
The essence of Swap is to use a piece of disk space or a local file as memory, including two processes of swapping in and swapping out:
Swapping out: Store the memory data temporarily unused by the process to disk and release the memory Swapping in: When the process accesses the memory again, They are read from disk into memory
How does Linux measure whether memory resources are tight?
Direct Memory Recycling New large block memory allocation request, but insufficient remaining memory. At this time, the system will reclaim a part of the memory;
kswapd0 The kernel thread periodically reclaims the memory. In order to measure memory usage, three thresholds of pages_min, pages_low, and pages_high are defined, and memory recycling operations are performed based on them.
Remaining memory
pages_min < remaining memory < pages_low, the memory pressure is large, kswapd0 performs memory recycling until the remaining memory > pages_high
pages_low < 剩余内存 < pages_high,内存有一定压力,但可以满足新内存请求
剩余内存 > pages_high,说明剩余内存较多,无内存压力
pages_low = pages_min 5 / 4 pages_high = pages_min 3 / 2
NUMA 与 SWAP
很多情况下系统剩余内存较多,但SWAP依旧升高,这是由于处理器的NUMA架构。
在NUMA架构下多个处理器划分到不同的Node,每个Node都拥有自己的本地内存空间。在分析内存的使用时应该针对每个Node单独分析
numactl --hardware #查看处理器在Node的分布情况,以及每个Node的内存使用情况
Copy after login内存三个阈值可以通过/proc/zoneinfo来查看,该文件中还包括活跃和非活跃的匿名页/文件页数。
当某个Node内存不足时,系统可以从其他Node寻找空闲资源,也可以从本地内存中回收内存。通过/proc/sys/vm/zone_raclaim_mode来调整。
0表示既可以从其他Node寻找空闲资源,也可以从本地回收内存 1,2,4表示只回收本地内存,2表示可以会回脏数据回收内存,4表示可以用Swap方式回收内存。
swappiness
在实际回收过程中Linux根据/proc/sys/vm/swapiness选项来调整使用Swap的积极程度,从0-100,数值越大越积极使用Swap,即更倾向于回收匿名页;数值越小越消极使用Swap,即更倾向于回收文件页。
注意:这只是调整Swap积极程度的权重,即使设置为0,当剩余内存+文件页小于页高阈值时,还是会发生Swap。
Swap升高时如何定位分析
free #首先通过free查看swap使用情况,若swap=0表示未配置Swap
#先创建并开启swap
fallocate -l 8G /mnt/swapfile
chmod 600 /mnt/swapfile
mkswap /mnt/swapfile
swapon /mnt/swapfile

free #再次执行free确保Swap配置成功

dd if=/dev/sda1 of=/dev/null bs=1G count=2048 #模拟大文件读取
sar -r -S 1  #查看内存各个指标变化 -r内存 -S swap
#根据结果可以看出,%memused在不断增长,剩余内存kbmemfress不断减少,缓冲区kbbuffers不断增大,由此可知剩余内存不断分配给了缓冲区
#一段时间之后,剩余内存很小,而缓冲区占用了大部分内存。此时Swap使用之间增大,缓冲区和剩余内存只在小范围波动

停下sar命令
cachetop5 #观察缓存
#可以看到dd进程读写只有50%的命中率,未命中数为4w+页,说明正式dd进程导致缓冲区使用升高
watch -d grep -A 15 ‘Normal’ /proc/zoneinfo #观察内存指标变化
#发现升级内存在一个小范围不停的波动,低于页低阈值时会突然增大到一个大于页高阈值的值
Copy after login说明剩余内存和缓冲区的波动变化正是由于内存回收和缓存再次分配的循环往复。有时候Swap用的多,有时候缓冲区波动更多。此时查看swappiness值为60,是一个相对中和的配置,系统会根据实际运行情况来选去合适的回收类型.
How to find system memory problems quickly and accurately
Memory performance indicators
System memory indicators
Used memory/remaining memory Shared memory (tmpfs implementation) Available memory: including remaining memory and recyclable memory Cache: page cache of disk read files, recyclable part in slab allocator Buffer: temporary storage of raw disk blocks, cache of data to be written to disk
Process memory indicators
Virtual memory: 5 most Resident memory: the physical memory actually used by the process, excluding Swap and shared memory Shared memory: memory shared with other processes, as well as code segments of dynamic link libraries and programs In addition, search the public account technical community background to reply "algorithm", Get a surprise gift package. Swap memory: memory swapped out to disk through Swap
Page fault exception
Can be allocated directly from physical memory. Secondary page fault exception requires disk IO intervention (such as Swap), primary page fault exception. At this time, memory access will be much slower
Memory performance tool
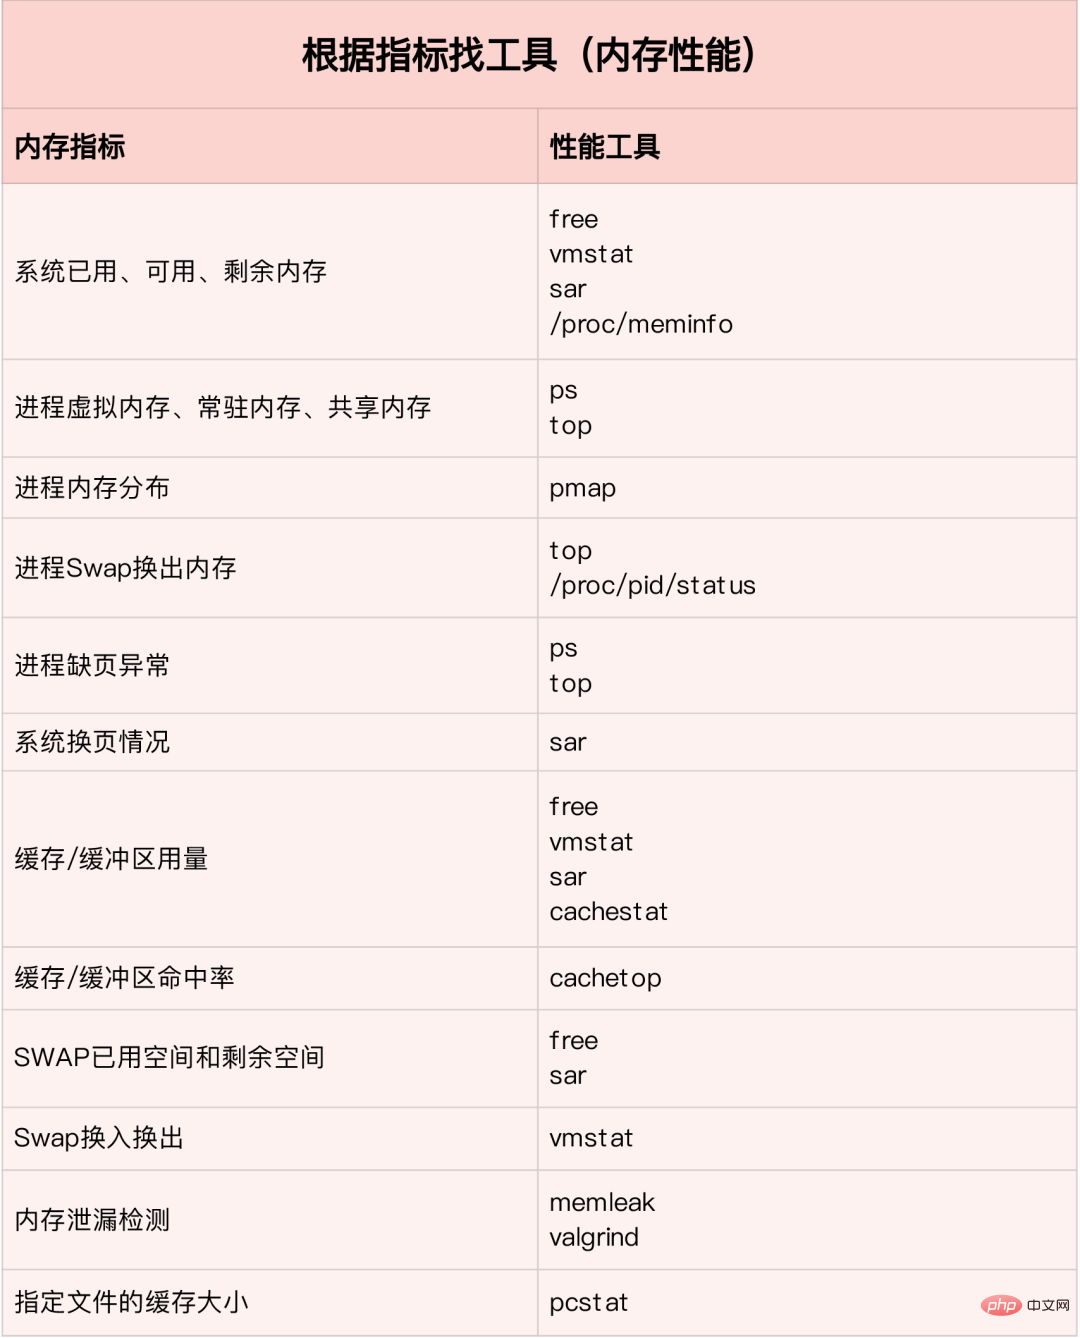
Find the appropriate tool based on different performance indicators:
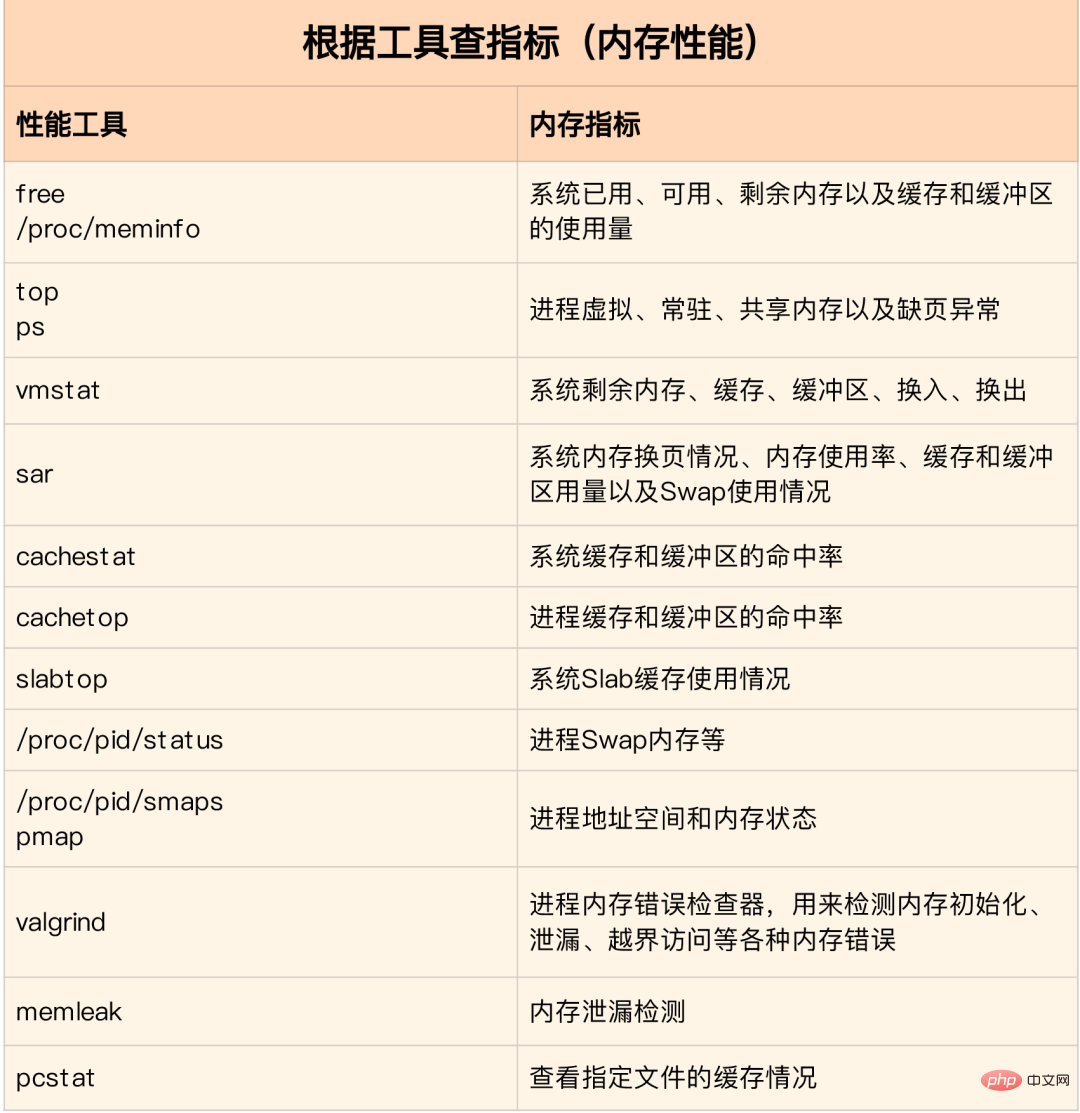
Pictures from: www.ctq6.cn Performance indicators included in the memory analysis tool:
Pictures from: www .ctq6.cn How to quickly analyze memory performance bottlenecks
Usually run several performance tools with relatively large coverage first, such as free, top, vmstat , pidstat, etc.
First use free and top to check the overall memory usage of the system Then use vmstat and pidstat to check the trend over a period of time to determine the type of memory problem Finally perform detailed analysis, such as memory allocation analysis, cache/buffer analysis, memory usage analysis of specific processes, etc.
Common optimizations Idea:
最好禁止Swap,若必须开启则尽量降低swappiness的值 减少内存的动态分配,如可以用内存池,HugePage等 尽量使用缓存和缓冲区来访问数据。如用堆栈明确声明内存空间来存储需要缓存的数据,或者用Redis外部缓存组件来优化数据的访问 cgroups等方式来限制进程的内存使用情况,确保系统内存不被异常进程耗尽 /proc/pid/oom_adj调整核心应用的oom_score,保证即使内存紧张核心应用也不会被OOM杀死
vmstat使用详解
vmstat命令是最常见的Linux/Unix监控工具,可以展现给定时间间隔的服务器的状态值,包括服务器的CPU使用率,内存使用,虚拟内存交换情况,IO读写情况。可以看到整个机器的CPU,内存,IO的使用情况,而不是单单看到各个进程的CPU使用率和内存使用率(使用场景不一样)。
vmstat 2
procs -----------memory---------- ---swap-- -----io---- -system-- ------cpu-----
 r  b   swpd   free   buff  cache   si   so    bi    bo   in   cs us sy id wa st
 1  0      0 1379064 282244 11537528    0    0     3   104    0    0  3  0 97  0  0
 0  0      0 1372716 282244 11537544    0    0     0    24 4893 8947  1  0 98  0  0
 0  0      0 1373404 282248 11537544    0    0     0    96 5105 9278  2  0 98  0  0
 0  0      0 1374168 282248 11537556    0    0     0     0 5001 9208  1  0 99  0  0
 0  0      0 1376948 282248 11537564    0    0     0    80 5176 9388  2  0 98  0  0
 0  0      0 1379356 282256 11537580    0    0     0   202 5474 9519  2  0 98  0  0
 1  0      0 1368376 282256 11543696    0    0     0     0 5894 8940 12  0 88  0  0
 1  0      0 1371936 282256 11539240    0    0     0 10554 6176 9481 14  1 85  1  0
 1  0      0 1366184 282260 11542292    0    0     0  7456 6102 9983  7  1 91  0  0
 1  0      0 1353040 282260 11556176    0    0     0 16924 7233 9578 18  1 80  1  0
 0  0      0 1359432 282260 11549124    0    0     0 12576 5495 9271  7  0 92  1  0
 0  0      0 1361744 282264 11549132    0    0     0    58 8606 15079  4  2 95  0  0
 1  0      0 1367120 282264 11549140    0    0     0     2 5716 9205  8  0 92  0  0
 0  0      0 1346580 282264 11562644    0    0     0    70 6416 9944 12  0 88  0  0
 0  0      0 1359164 282264 11550108    0    0     0  2922 4941 8969  3  0 97  0  0
 1  0      0 1353992 282264 11557044    0    0     0     0 6023 8917 15  0 84  0  0

# 结果说明
- r 表示运行队列(就是说多少个进程真的分配到CPU),我测试的服务器目前CPU比较空闲,没什么程序在跑,当这个值超过了CPU数目,就会出现CPU瓶颈了。这个也和top的负载有关系,一般负载超过了3就比较高,超过了5就高,超过了10就不正常了,服务器的状态很危险。top的负载类似每秒的运行队列。如果运行队列过大,表示你的CPU很繁忙,一般会造成CPU使用率很高。

- b 表示阻塞的进程,这个不多说,进程阻塞,大家懂的。

- swpd 虚拟内存已使用的大小,如果大于0,表示你的机器物理内存不足了,如果不是程序内存泄露的原因,那么你该升级内存了或者把耗内存的任务迁移到其他机器。

- free   空闲的物理内存的大小,我的机器内存总共8G,剩余3415M。

- buff   Linux/Unix系统是用来存储,目录里面有什么内容,权限等的缓存,我本机大概占用300多M

- cache cache直接用来记忆我们打开的文件,给文件做缓冲,我本机大概占用300多M(这里是Linux/Unix的聪明之处,把空闲的物理内存的一部分拿来做文件和目录的缓存,是为了提高 程序执行的性能,当程序使用内存时,buffer/cached会很快地被使用。)

- si  每秒从磁盘读入虚拟内存的大小,如果这个值大于0,表示物理内存不够用或者内存泄露了,要查找耗内存进程解决掉。我的机器内存充裕,一切正常。

- so  每秒虚拟内存写入磁盘的大小,如果这个值大于0,同上。

- bi  块设备每秒接收的块数量,这里的块设备是指系统上所有的磁盘和其他块设备,默认块大小是1024byte,我本机上没什么IO操作,所以一直是0,但是我曾在处理拷贝大量数据(2-3T)的机器上看过可以达到140000/s,磁盘写入速度差不多140M每秒

- bo 块设备每秒发送的块数量,例如我们读取文件,bo就要大于0。bi和bo一般都要接近0,不然就是IO过于频繁,需要调整。

- in 每秒CPU的中断次数,包括时间中断

- cs 每秒上下文切换次数,例如我们调用系统函数,就要进行上下文切换,线程的切换,也要进程上下文切换,这个值要越小越好,太大了,要考虑调低线程或者进程的数目,例如在apache和nginx这种web服务器中,我们一般做性能测试时会进行几千并发甚至几万并发的测试,选择web服务器的进程可以由进程或者线程的峰值一直下调,压测,直到cs到一个比较小的值,这个进程和线程数就是比较合适的值了。系统调用也是,每次调用系统函数,我们的代码就会进入内核空间,导致上下文切换,这个是很耗资源,也要尽量避免频繁调用系统函数。上下文切换次数过多表示你的CPU大部分浪费在上下文切换,导致CPU干正经事的时间少了,CPU没有充分利用,是不可取的。

- us 用户CPU时间,我曾经在一个做加密解密很频繁的服务器上,可以看到us接近100,r运行队列达到80(机器在做压力测试,性能表现不佳)。

- sy 系统CPU时间,如果太高,表示系统调用时间长,例如是IO操作频繁。

- id 空闲CPU时间,一般来说,id + us + sy = 100,一般我认为id是空闲CPU使用率,us是用户CPU使用率,sy是系统CPU使用率。

- wt 等待IO CPU时间
Copy after loginpidstat 使用详解
pidstat主要用于监控全部或指定进程占用系统资源的情况,如CPU,内存、设备IO、任务切换、线程等。
Usage:
pidstat –d interval times counts the IO usage of each process pidstat –u interval times counts each process CPU statistical information pidstat -r interval times counts the memory usage information of each process pidstat -w interval times counts the context of each process Switch p PID Specify PID
1. Statistics IO usage
pidstat -d 1 10

03:02:02 PM   UID       PID   kB_rd/s   kB_wr/s kB_ccwr/s  Command
03:02:03 PM     0       816      0.00    918.81      0.00  jbd2/vda1-8
03:02:03 PM     0      1007      0.00      3.96      0.00  AliYunDun
03:02:03 PM   997      7326      0.00   1904.95    918.81  java
03:02:03 PM   997      8539      0.00      3.96      0.00  java
03:02:03 PM     0     16066      0.00     35.64      0.00  cmagent

03:02:03 PM   UID       PID   kB_rd/s   kB_wr/s kB_ccwr/s  Command
03:02:04 PM     0       816      0.00   1924.00      0.00  jbd2/vda1-8
03:02:04 PM   997      7326      0.00  11156.00   1888.00  java
03:02:04 PM   997      8539      0.00      4.00      0.00  java
Copy after loginUID PID kB_rd/s: 每秒进程从磁盘读取的数据量 KB 单位 read from disk each second KB kB_wr/s: 每秒进程向磁盘写的数据量 KB 单位 write to disk each second KB kB_ccwr/s: 每秒进程向磁盘写入,但是被取消的数据量,This may occur when the task truncates some dirty pagecache. iodelay: Block I/O delay, measured in clock ticks Command: 进程名 task name
2、统计CPU使用情况
# 统计CPU
pidstat -u 1 10
03:03:33 PM   UID       PID    %usr %system  %guest    %CPU   CPU  Command
03:03:34 PM     0      2321    3.96    0.00    0.00    3.96     0  ansible
03:03:34 PM     0      7110    0.00    0.99    0.00    0.99     4  pidstat
03:03:34 PM   997      8539    0.99    0.00    0.00    0.99     5  java
03:03:34 PM   984     15517    0.99    0.00    0.00    0.99     5  java
03:03:34 PM     0     24406    0.99    0.00    0.00    0.99     5  java
03:03:34 PM     0     32158    3.96    0.00    0.00    3.96     2  ansible
Copy after loginUID PID %usr: 进程在用户空间占用 cpu 的百分比 %system: 进程在内核空间占用 CPU 百分比 %guest: 进程在虚拟机占用 CPU 百分比 %wait: 进程等待运行的百分比 %CPU: 进程占用 CPU 百分比 CPU: 处理进程的 CPU 编号 Command: 进程名
3、统计内存使用情况
# 统计内存
pidstat -r 1 10
Average:      UID       PID  minflt/s  majflt/s     VSZ    RSS   %MEM  Command
Average:        0         1      0.20      0.00  191256   3064   0.01  systemd
Average:        0      1007      1.30      0.00  143256  22720   0.07  AliYunDun
Average:        0      6642      0.10      0.00 6301904 107680   0.33  java
Average:      997      7326     10.89      0.00 13468904 8395848  26.04  java
Average:        0      7795    348.15      0.00  108376   1233   0.00  pidstat
Average:      997      8539      0.50      0.00 8242256 2062228   6.40  java
Average:      987      9518      0.20      0.00 6300944 1242924   3.85  java
Average:        0     10280      3.70      0.00  807372   8344   0.03  aliyun-service
Average:      984     15517      0.40      0.00 6386464 1464572   4.54  java
Average:        0     16066    236.46      0.00 2678332  71020   0.22  cmagent
Average:      995     20955      0.30      0.00 6312520 1408040   4.37  java
Average:      995     20956      0.20      0.00 6093764 1505028   4.67  java
Average:        0     23936      0.10      0.00 5302416 110804   0.34  java
Average:        0     24406      0.70      0.00 10211672 2361304   7.32  java
Average:        0     26870      1.40      0.00 1470212  36084   0.11  promtail
Copy after loginUID PID Minflt/s : 每秒次缺页错误次数 (minor page faults),虚拟内存地址映射成物理内存地址产生的 page fault 次数 Majflt/s : 每秒主缺页错误次数 (major page faults), 虚拟内存地址映射成物理内存地址时,相应 page 在 swap 中 VSZ virtual memory usage : 该进程使用的虚拟内存 KB 单位 RSS : 该进程使用的物理内存 KB 单位 %MEM : 内存使用率 Command : 该进程的命令 task name
4、查看具体进程使用情况
pidstat -T ALL -r -p 20955 1 10
03:12:16 PM   UID       PID  minflt/s  majflt/s     VSZ    RSS   %MEM  Command
03:12:17 PM   995     20955      0.00      0.00 6312520 1408040   4.37  java

03:12:16 PM   UID       PID minflt-nr majflt-nr  Command
03:12:17 PM   995     20955         0         0  java
Copy after login
The above is the detailed content of Summary of Linux performance optimization knowledge points · Practice + Collection Edition. For more information, please follow other related articles on the PHP Chinese website!

Hot AI Tools

Undresser.AI Undress
AI-powered app for creating realistic nude photos

AI Clothes Remover
Online AI tool for removing clothes from photos.

Undress AI Tool
Undress images for free

Clothoff.io
AI clothes remover

AI Hentai Generator
Generate AI Hentai for free.

Hot Article
Hot Tools

Notepad++7.3.1
Easy-to-use and free code editor

SublimeText3 Chinese version
Chinese version, very easy to use

Zend Studio 13.0.1
Powerful PHP integrated development environment

Dreamweaver CS6
Visual web development tools

SublimeText3 Mac version
God-level code editing software (SublimeText3)
Hot Topics
 1376
1376
 52
52

 How to solve permission issues when using python --version command in Linux terminal?
Apr 02, 2025 am 06:36 AM
How to solve permission issues when using python --version command in Linux terminal?
Apr 02, 2025 am 06:36 AM
Using python in Linux terminal...
 How to configure apscheduler timing task as a service on macOS?
Apr 01, 2025 pm 06:09 PM
How to configure apscheduler timing task as a service on macOS?
Apr 01, 2025 pm 06:09 PM
Configure the apscheduler timing task as a service on macOS platform, if you want to configure the apscheduler timing task as a service, similar to ngin...
 Four ways to implement multithreading in C language
Apr 03, 2025 pm 03:00 PM
Four ways to implement multithreading in C language
Apr 03, 2025 pm 03:00 PM
Multithreading in the language can greatly improve program efficiency. There are four main ways to implement multithreading in C language: Create independent processes: Create multiple independently running processes, each process has its own memory space. Pseudo-multithreading: Create multiple execution streams in a process that share the same memory space and execute alternately. Multi-threaded library: Use multi-threaded libraries such as pthreads to create and manage threads, providing rich thread operation functions. Coroutine: A lightweight multi-threaded implementation that divides tasks into small subtasks and executes them in turn.
 How to open web.xml
Apr 03, 2025 am 06:51 AM
How to open web.xml
Apr 03, 2025 am 06:51 AM
To open a web.xml file, you can use the following methods: Use a text editor (such as Notepad or TextEdit) to edit commands using an integrated development environment (such as Eclipse or NetBeans) (Windows: notepad web.xml; Mac/Linux: open -a TextEdit web.xml)
 Can the Python interpreter be deleted in Linux system?
Apr 02, 2025 am 07:00 AM
Can the Python interpreter be deleted in Linux system?
Apr 02, 2025 am 07:00 AM
Regarding the problem of removing the Python interpreter that comes with Linux systems, many Linux distributions will preinstall the Python interpreter when installed, and it does not use the package manager...
 What is the Linux best used for?
Apr 03, 2025 am 12:11 AM
What is the Linux best used for?
Apr 03, 2025 am 12:11 AM
Linux is best used as server management, embedded systems and desktop environments. 1) In server management, Linux is used to host websites, databases, and applications, providing stability and reliability. 2) In embedded systems, Linux is widely used in smart home and automotive electronic systems because of its flexibility and stability. 3) In the desktop environment, Linux provides rich applications and efficient performance.
 How is Debian Hadoop compatibility
Apr 02, 2025 am 08:42 AM
How is Debian Hadoop compatibility
Apr 02, 2025 am 08:42 AM
DebianLinux is known for its stability and security and is widely used in server, development and desktop environments. While there is currently a lack of official instructions on direct compatibility with Debian and Hadoop, this article will guide you on how to deploy Hadoop on your Debian system. Debian system requirements: Before starting Hadoop configuration, please make sure that your Debian system meets the minimum operating requirements of Hadoop, which includes installing the necessary Java Runtime Environment (JRE) and Hadoop packages. Hadoop deployment steps: Download and unzip Hadoop: Download the Hadoop version you need from the official ApacheHadoop website and solve it
 Is Debian Strings compatible with multiple browsers
Apr 02, 2025 am 08:30 AM
Is Debian Strings compatible with multiple browsers
Apr 02, 2025 am 08:30 AM
"DebianStrings" is not a standard term, and its specific meaning is still unclear. This article cannot directly comment on its browser compatibility. However, if "DebianStrings" refers to a web application running on a Debian system, its browser compatibility depends on the technical architecture of the application itself. Most modern web applications are committed to cross-browser compatibility. This relies on following web standards and using well-compatible front-end technologies (such as HTML, CSS, JavaScript) and back-end technologies (such as PHP, Python, Node.js, etc.). To ensure that the application is compatible with multiple browsers, developers often need to conduct cross-browser testing and use responsiveness
