
 Operation and Maintenance
Linux Operation and Maintenance
Ultra-Comprehensive Collection - Summary Collection of Linux Performance Analysis Tools
Operation and Maintenance
Linux Operation and Maintenance
Ultra-Comprehensive Collection - Summary Collection of Linux Performance Analysis Tools
Ultra-Comprehensive Collection - Summary Collection of Linux Performance Analysis Tools
Out of interest in the Linux operating system and a strong desire for underlying knowledge, I organized This article. This article can also be used as an indicator to test basic knowledge. In addition, the article covers all aspects of a system. Without complete computer system knowledge, network knowledge and operating system knowledge, it is impossible to fully master the tools in the document. In addition, system performance analysis and optimization is a long-term series.
This document is mainly based on Linux expert Brendan Gregg, Netflix senior performance architect’s blog post updating Linux performance tuning tools to collect Linux system performance This is a comprehensive article compiled from optimization-related articles. It mainly explains the principles and performance testing tools involved in combination with blog posts.
Background knowledge: Having background knowledge is what you need to know when analyzing performance problems. For example, hardware cache; another example is the operating system kernel. The behavioral details of the application are often intertwined with these things. These low-level things can affect the performance of the application in unexpected ways. For example, some programs cannot fully utilize the cache, resulting in performance degradation. For example, too many system calls are called unnecessarily, causing frequent kernel/user switching, etc. This is just to pave the way for the follow-up content of this article. There are still many things about tuning. I don’t know much more than I know. I hope everyone can learn and make progress together.
【Performance Analysis Tool】
First look at a picture:
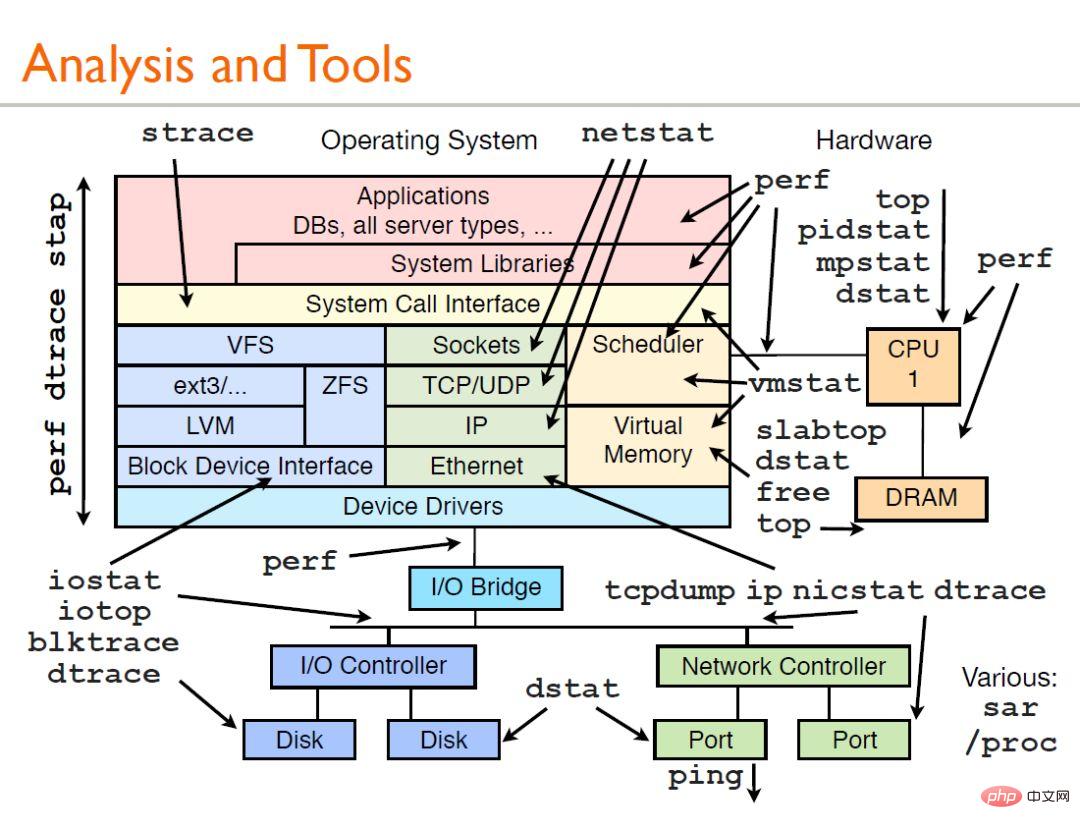
The above picture is a performance analysis shared by Brendan Gregg. Everything in it You can get its help documentation through man. The following is a brief introduction to the general usage:
▲ vmstat--virtual memory statistics
vmstat (VirtualMeomoryStatistics, virtual memory statistics) is a common tool for monitoring memory in Linux. It can monitor the overall situation of the operating system's virtual memory, process, CPU, etc.
General usage of vmstat: vmstat interval times means sampling once every interval seconds, for a total of times times. If times is omitted, then Data is collected until manually stopped by the user.
A simple example:
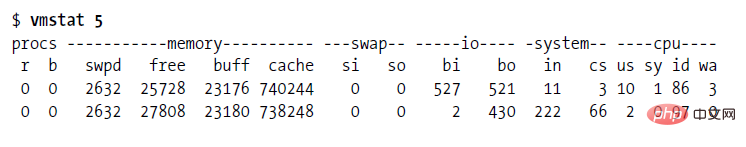
##You can use ctrl c to stop vmstat collecting data.
The first row shows the average since the system was started, the second row starts showing what is happening now, the following rows will show what is happening in each 5 second interval, the meaning of each column is at the beginning part, as follows:
▪ procs: The r column shows how many processes are waiting for the cpu, and the b column shows how many processes are sleeping uninterruptibly (waiting for IO).
▪ memory: The swapd column shows how many blocks have been swapped out of the disk (page swapping), and the remaining columns show how many blocks are free (unused). being used), how many blocks are being used as buffers, and how many are being used as the operating system's cache.
▪ swap: Shows swap activity: how many blocks are being swapped in (from disk) and swapped out (to disk) per second.
▪ io: Shows how many blocks were read (bi) and written (bo) from the block device, usually reflecting hard disk I/O.
▪ system: Displays the number of interrupts (in) and context switches (cs) per second.
▪ cpu: Displays the percentage of all CPU time spent on various operations, including executing user code (non-kernel), executing system code (kernel), idle, and waiting for IO.
Symptoms of insufficient memory: free memory decreases sharply, recycling buffers and caches does not help, extensive use of swap partitions (swpd), frequent page exchanges (swap), the number of read and write disks (io ) increases, page fault interrupts (in) increase, the number of context switches (cs) increases, the number of processes waiting for IO (b) increases, and a lot of CPU time is spent waiting for IO (wa)
▲iostat--used to report central processing unit statistics
iostat is used to report central processing unit (CPU) statistics and the entire system, adapter, tty device , disk and CD-ROM input/output statistics. By default, the same cpu usage information as vmstat is displayed. Use the following command to display extended device statistics:
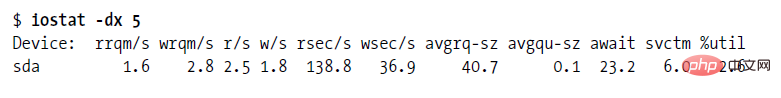
The first line shows the average since system startup, then the incremental averages are shown, one line per device.
Common Linux disk IO indicator abbreviation habits: rq is request, r is read, w is write, qu is queue, sz is size, a is verage, tm is time, svc is service.
▪rrqm/s and wrqm/s: merged read and write requests per second, "merged" means that the operating system takes out multiple logical requests from the queue and merges them into one Request to actual disk.
▪r/s and w/s: Number of read and write requests sent to the device per second.
▪rsec/s and wsec/s: Number of sectors read and written per second.
▪avgrq –sz: Requested number of sectors.
▪avgqu –sz: The number of requests waiting in the device queue.
▪await: The time spent on each IO request.
▪svctm: Actual request (service) time.
▪%util: The percentage of time that there was at least one active request.
▲dstat--system monitoring tool
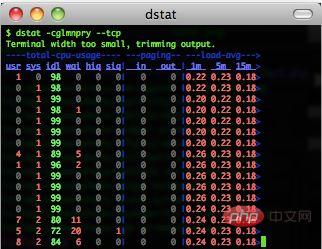
dstat shows cpu usage and disk io status , the network packet sending situation and page change situation, the output is colorful and highly readable. Compared with the input of vmstat and iostat, it is more detailed and intuitive. When using it, just enter the command directly, and of course you can also use specific parameters.
is as follows: dstat –cdlmnpsy
##▲iotop- -LINUX process real-time monitoring tool
The iotop command is a command specifically designed to display hard disk IO. The interface style is similar to the top command and can display which process specifically generates the IO load. It is a top tool used to monitor disk I/O usage. It has a UI similar to top, including PID, user, I/O, process and other related information.
Can be used in a non-interactive manner: iotop –bod interval, to view the I/O of each process, you can use pidstat, pidstat –d instat.
Search the public account Linux Chinese community backend and reply "private kitchen" to get a surprise gift package.
▲pidstat--monitoring system resources
pidstat is mainly used to monitor all or specified processes Occupying system resources, such as CPU, memory, device IO, task switching, threads, etc.
Usage: pidstat –d interval; pidstat can also be used to count CPU usage information: pidstat –u interval; to count memory information: Pidstat –r interval.
##▲top
top command The summary area displays five aspects of system performance information:
1. Load: time, number of logged-in users, average system load;
2. Process: running, sleeping, stopping, zombie;
3.cpu: user mode, core mode, NICE, idle, waiting for IO, interrupt, etc.;
4. Memory: total, used, idle ( System perspective), buffering, caching;
5. Swap partition: total, used, free
The task area default display: process ID, effective user, process priority, NICE value, virtual memory, physical memory and shared memory used by the process, process status, CPU usage, memory usage, accumulated CPU time, process command line information.
##▲htop
htop is Linux An interactive process viewer on the system, a text-mode application (in the console or X terminal), requires ncurses. 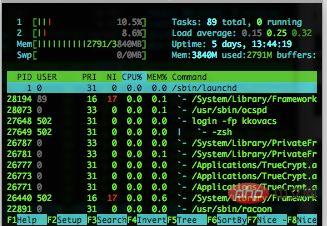
Htop allows users to operate interactively, supports color themes, can scroll through the process list horizontally or vertically, and supports mouse operations.
Compared with top, htop has the following advantages:
▪ You can scroll through the process list horizontally or vertically to see all processes and the complete command line.
▪ Faster than top at startup.
▪ You do not need to enter the process ID when killing a process.
▪ htop supports mouse operations.
▲mpstat
mpstat is the abbreviation of Multiprocessor Statistics and is a real-time system monitoring tool. It reports some statistical information about the CPU, which is stored in the /proc/stat file. In a multi-CPUs system, it can not only view the average status information of all CPUs, but also view the information of a specific CPU. Common usage: mpstat –P ALL interval times.
##▲netstat
Netstat is used for Displays statistical data related to IP, TCP, UDP and ICMP protocols, generally used to check the network connection of each port of the machine.
▲Common usage:
netstat –npl You can check whether the port you want to open has been opened.
netstat –rn Print routing table information.
netstat –in Provides interface information on the system, prints the MTU of each interface, the number of input packets, input errors, the number of output packets, output errors, conflicts and the current output queue length.
##▲ps--Display the status of the current process
There are too many ps parameters. For specific usage methods, please refer to man ps. Commonly used methods: ps aux #hsserver; ps –ef |grep #hundsun
▪ Method to kill a certain program: ps aux | grep mysqld | grep –v grep | awk '{print $2 }' xargs kill -9
##▪ Kill the zombie process: ps –eal | awk '{if ($2 == “Z”){print $4}}' | xargs kill -9
strace Track system calls and signals received during program execution to help analyze abnormal situations encountered during program or command execution. Example: To check which configuration file mysqld loads on Linux, you can run the following command: strace –e stat64 mysqld –print –defaults > /dev/null ▲uptime Be able to print the total number of times the system is running How long and the average load of the system. The last three numbers output by the uptime command mean the average load of the system in 1 minute, 5 minutes, and 15 minutes respectively. ##▲lsof View file system blocking lsof /boot View Which process is occupying the port number lsof -i : 3306 View which files are opened by the user lsof –u username View which files are opened by the process lsof –p 4838 View remote Opened network link lsof –i @192.168.34.128 ##▲perf perf is the system performance optimization tool that comes with the Linux kernel. The advantage lies in its close integration with the Linux Kernel. It can be the first to be applied to new features added to the Kernel to view hot functions and cashe miss ratios, thereby helping developers optimize program performance. The basic principle of performance tuning tools such as perf, Oprofile, etc. is to sample monitored objects. The simplest case is to interrupt based on ticks To perform sampling, that is, trigger the sampling point within the tick interrupt, and determine the current context of the program at the sampling point. If a program spends 90% of its time in function foo(), then 90% of the sampling points should fall in the context of function foo(). Luck is elusive, but I think as long as the sampling frequency is high enough and the sampling time is long enough, the above inference will be more reliable. Therefore, by triggering sampling by tick, we can understand which parts of the program consume the most time and focus on analysis. If you want to know more about this tool, please refer to: Summary: Combining the above commonly used performance test commands and contacting the diagram of the performance analysis tool at the beginning of the article, you can initially understand which aspects of performance are used in the performance analysis process. Aspect tools (commands). 【Commonly used performance testing tools】 Proficient and proficient in the performance analysis of the second part Command tool, introduces several performance testing tools. Before introducing, let’s briefly understand several performance testing tools: ▪ perf_events: a tool that comes with Linux Performance diagnostic tools are released and maintained together with the kernel code and are maintained and developed by the kernel community. Perf can be used not only for performance statistical analysis of applications, but also for performance statistics and analysis of kernel code. More reference: http://blog.sina.com.cn/s/blog_98822316010122ex.html. ##▪ eBPF tools: A tool for performance tracking using bcc, eBPF map can use customized eBPF programs It is widely used in kernel tuning and can also read user-level asynchronous code. The important thing is that this external data can be managed in user space. This k-v format map data body is managed by calling the bpf system call in user space to create, add, delete and other operations. more: http://blog.csdn.net/ljy1988123/article/details/50444693. ▪ perf-tools: A Linux performance analysis and tuning tool set based on perf_events (perf) and ftrace. Perf-Tools has few library dependencies and is easy to use. Supports Linux 3.2 and above kernel versions. more: https://github.com/brendangregg/perf-tools. ▪ bcc (BPF Compiler Collection): A perf performance analysis tool using eBPF. A toolkit for creating efficient kernel tracing and manipulation programs, including several useful tools and examples. Take advantage of Extended BPF (Berkeley Packet Filter), officially called eBPF, a new feature that was first added to Linux 3.15. Multi-purpose requires Linux 4.1 or above BCC. More references: https://github.com/iovisor/bcc#tools. ##▪ ktap: A new type of dynamic performance tracking tool for Linux scripts. Allows users to track Linux kernel dynamics. ktap is designed to be interoperable, allowing users to tune operational insights, troubleshoot and extend kernels and applications. It is similar to Linux and Solaris DTrace SystemTap. More reference: https://github.com/ktap/ktap. ##▪ Flame Graphs: It is a graphics software that uses perf, system tap, ktap visualization, allowing the most frequent Code paths are quickly and accurately identified and can be procedurally generated using the development source code at github.com/brendangregg/flamegraph. More references: http://www.brendangregg.com/flamegraphs.html. #▪ The Basic Tools to learn first are as follows: ▪ The advanced commands are as follows: More reference: http://www.open-open.com/lib/view/open1434589043973.html. For detailed command usage, please refer to man. is a performance Evaluation tools, you can use corresponding tools for performance testing of different modules. If you want to learn more, you can refer to the attached document below. 3. Linux tuning tools | Linux performance tuning tools 4. Linux observability sar | linux performance observation tool sar(System Activity Reporter system activity report) is currently one of the most comprehensive system performance analysis tools on LINUX. It can report system activities from many aspects, including: file reading and writing, system call usage, disk I/O, CPU efficiency, memory usage, process activity and IPC-related activities, etc. Common usage of sar: sar [options] [-A] [-o file] t [n]
http://blog.csdn .net/trochiluses/article/details/10261339
1. Linux observability tools | Linux performance observation tools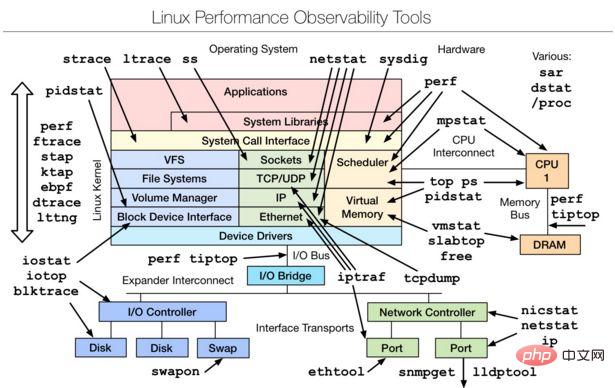
uptime, top(htop), mpstat, isstat, vmstat, free ,ping,nicstat,dstat.
sar, netstat, pidstat, strace, tcpdump, blktrace, iotop, slabtop, sysctl, /proc.
2. Linux benchmarking tools | Linux performance evaluation tool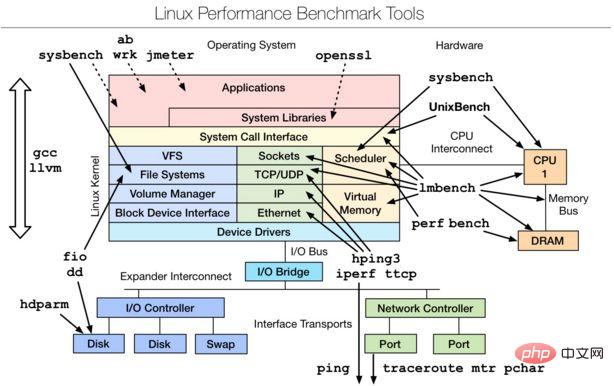
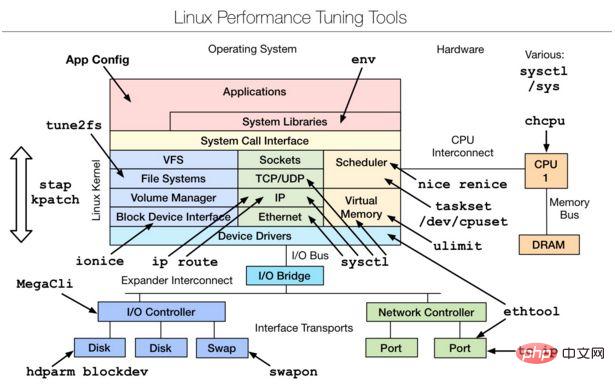
It is a performance tuning tool that mainly performs tuning from the Linux kernel source code layer. If you want to learn more about it, you can refer to the attached document below. 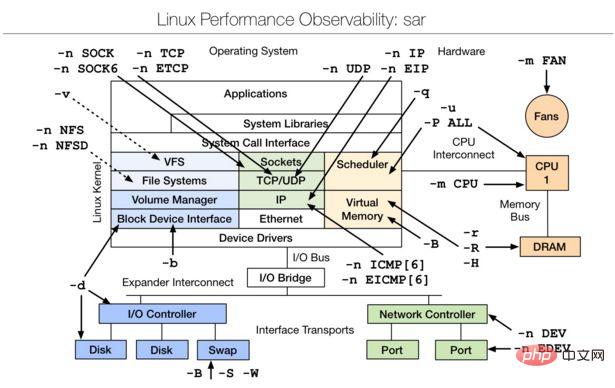
Where:
t is the sampling interval, n is the number of sampling times, the default value is 1;
-o file means to convert the command result to The binary format is stored in a file, where file is the file name.
options are command line options
The above is the detailed content of Ultra-Comprehensive Collection - Summary Collection of Linux Performance Analysis Tools. For more information, please follow other related articles on the PHP Chinese website!

Hot AI Tools

Undresser.AI Undress
AI-powered app for creating realistic nude photos

AI Clothes Remover
Online AI tool for removing clothes from photos.

Undress AI Tool
Undress images for free

Clothoff.io
AI clothes remover

AI Hentai Generator
Generate AI Hentai for free.

Hot Article
Hot Tools

Notepad++7.3.1
Easy-to-use and free code editor

SublimeText3 Chinese version
Chinese version, very easy to use

Zend Studio 13.0.1
Powerful PHP integrated development environment

Dreamweaver CS6
Visual web development tools

SublimeText3 Mac version
God-level code editing software (SublimeText3)
Hot Topics
 1378
1378
 52
52

 How to start apache
Apr 13, 2025 pm 01:06 PM
How to start apache
Apr 13, 2025 pm 01:06 PM
The steps to start Apache are as follows: Install Apache (command: sudo apt-get install apache2 or download it from the official website) Start Apache (Linux: sudo systemctl start apache2; Windows: Right-click the "Apache2.4" service and select "Start") Check whether it has been started (Linux: sudo systemctl status apache2; Windows: Check the status of the "Apache2.4" service in the service manager) Enable boot automatically (optional, Linux: sudo systemctl
 What to do if the apache80 port is occupied
Apr 13, 2025 pm 01:24 PM
What to do if the apache80 port is occupied
Apr 13, 2025 pm 01:24 PM
When the Apache 80 port is occupied, the solution is as follows: find out the process that occupies the port and close it. Check the firewall settings to make sure Apache is not blocked. If the above method does not work, please reconfigure Apache to use a different port. Restart the Apache service.
 The importance of Debian Sniffer in network monitoring
Apr 12, 2025 pm 11:03 PM
The importance of Debian Sniffer in network monitoring
Apr 12, 2025 pm 11:03 PM
Although the search results do not directly mention "DebianSniffer" and its specific application in network monitoring, we can infer that "Sniffer" refers to a network packet capture analysis tool, and its application in the Debian system is not essentially different from other Linux distributions. Network monitoring is crucial to maintaining network stability and optimizing performance, and packet capture analysis tools play a key role. The following explains the important role of network monitoring tools (such as Sniffer running in Debian systems): The value of network monitoring tools: Fast fault location: Real-time monitoring of network metrics, such as bandwidth usage, latency, packet loss rate, etc., which can quickly identify the root cause of network failures and shorten the troubleshooting time.
 How to optimize the performance of debian readdir
Apr 13, 2025 am 08:48 AM
How to optimize the performance of debian readdir
Apr 13, 2025 am 08:48 AM
In Debian systems, readdir system calls are used to read directory contents. If its performance is not good, try the following optimization strategy: Simplify the number of directory files: Split large directories into multiple small directories as much as possible, reducing the number of items processed per readdir call. Enable directory content caching: build a cache mechanism, update the cache regularly or when directory content changes, and reduce frequent calls to readdir. Memory caches (such as Memcached or Redis) or local caches (such as files or databases) can be considered. Adopt efficient data structure: If you implement directory traversal by yourself, select more efficient data structures (such as hash tables instead of linear search) to store and access directory information
 How to restart the apache server
Apr 13, 2025 pm 01:12 PM
How to restart the apache server
Apr 13, 2025 pm 01:12 PM
To restart the Apache server, follow these steps: Linux/macOS: Run sudo systemctl restart apache2. Windows: Run net stop Apache2.4 and then net start Apache2.4. Run netstat -a | findstr 80 to check the server status.
 How to learn Debian syslog
Apr 13, 2025 am 11:51 AM
How to learn Debian syslog
Apr 13, 2025 am 11:51 AM
This guide will guide you to learn how to use Syslog in Debian systems. Syslog is a key service in Linux systems for logging system and application log messages. It helps administrators monitor and analyze system activity to quickly identify and resolve problems. 1. Basic knowledge of Syslog The core functions of Syslog include: centrally collecting and managing log messages; supporting multiple log output formats and target locations (such as files or networks); providing real-time log viewing and filtering functions. 2. Install and configure Syslog (using Rsyslog) The Debian system uses Rsyslog by default. You can install it with the following command: sudoaptupdatesud
 How to solve the problem that apache cannot be started
Apr 13, 2025 pm 01:21 PM
How to solve the problem that apache cannot be started
Apr 13, 2025 pm 01:21 PM
Apache cannot start because the following reasons may be: Configuration file syntax error. Conflict with other application ports. Permissions issue. Out of memory. Process deadlock. Daemon failure. SELinux permissions issues. Firewall problem. Software conflict.
 Does the internet run on Linux?
Apr 14, 2025 am 12:03 AM
Does the internet run on Linux?
Apr 14, 2025 am 12:03 AM
The Internet does not rely on a single operating system, but Linux plays an important role in it. Linux is widely used in servers and network devices and is popular for its stability, security and scalability.
