
 Backend Development
Python Tutorial
Pandas+Pyecharts | Electronic product sales data analysis visualization + user RFM portrait
Backend Development
Python Tutorial
Pandas+Pyecharts | Electronic product sales data analysis visualization + user RFM portrait
Pandas+Pyecharts | Electronic product sales data analysis visualization + user RFM portrait

This issue uses python to analyze a electronic product sales data, take a look :
##Monthly order quantity order amount
Daily order quantity distribution
##Male and female users Order ratio
Female/Male Purchase Products TOP20
Order quantity for each age group
User RFM level portrait
##Wait...
# I hope it will be helpful to everyone. If you have any questions or areas that need improvement, please contact the editor.
Involved libraries:
Pandas
—Data processingPyecharts
—Data Visualizationimport pandas as pd
from pyecharts.charts import Line
from pyecharts.charts import Bar
from pyecharts.charts import Pie
from pyecharts.charts import Grid
from pyecharts.charts import PictorialBar
from pyecharts import options as opts
from pyecharts.commons.utils import JsCode
import warnings
warnings.filterwarnings('ignore')
df = pd.read_csv("电子产品销售分析.csv")
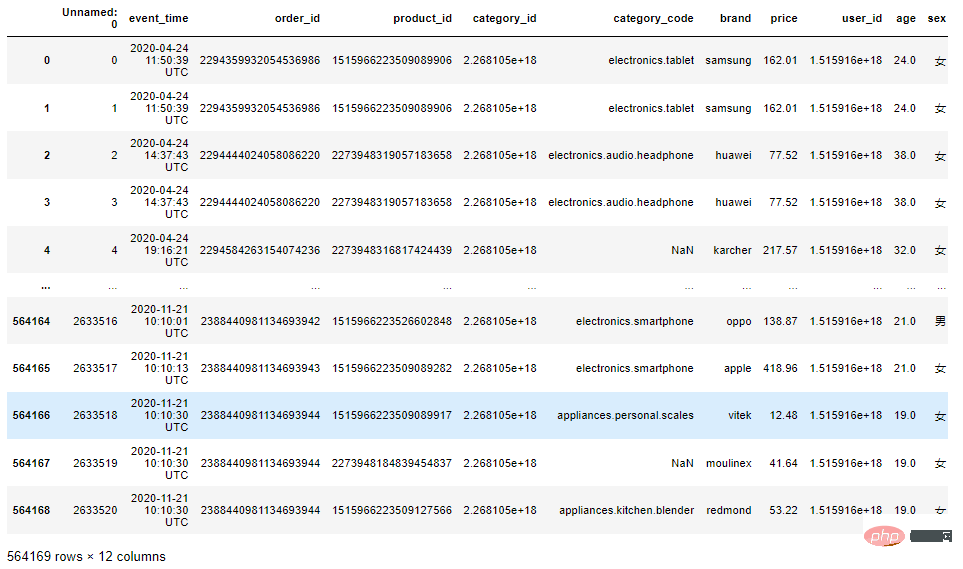
df.info()
一共有564169条数据,其中category_code、brand两列有部分数据缺失。
2.3 去掉部分用不到的列
df1 = df[['event_time', 'order_id', 'category_code', 'brand', 'price', 'user_id', 'age', 'sex', 'local']]
df1.shape
(564169, 9)
2.4 去除重复数据
df1 = df1.drop_duplicates()
df1.shape
(556456, 9)
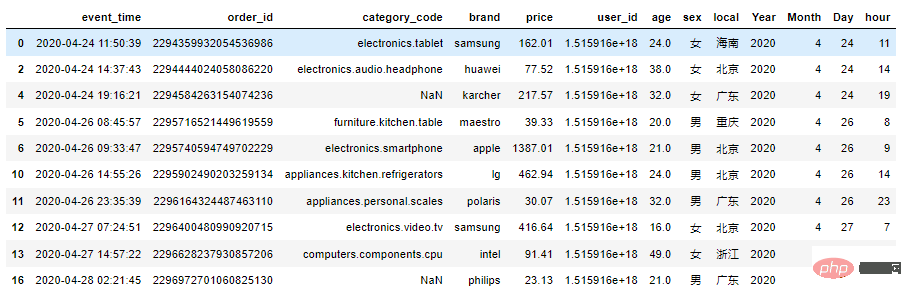
2.5 增加部分时间列
df1['event_time'] = pd.to_datetime(df1['event_time'].str[:19],format="%Y-%m-%d %H:%M:%S")
df1['Year'] = df1['event_time'].dt.year
df1['Month'] = df1['event_time'].dt.month
df1['Day'] = df1['event_time'].dt.day
df1['hour'] = df1['event_time'].dt.hour
df1.head(10)
2.6 过滤数据,也可以选择均值填充
df1 = df1.dropna(subset=['category_code'])
df1 = df1[(df1["Year"] == 2020)&(df1["price"] > 0)]
df1.shape
(429261, 13)
2.7 对年龄分组
df1['age_group'] = pd.cut(df1['age'],[10,20,30,40,50],labels=['10-20','20-30','30-40','40-50'])
2.8 增加商品一、二级分类
df1["category_code_1"] = df1["category_code"].apply(lambda x: x.split(".")[0] if "." in x else x)
df1["category_code_2"] = df1["category_code"].apply(lambda x: x.split(".")[-1] if "." in x else x)
df1.head(10)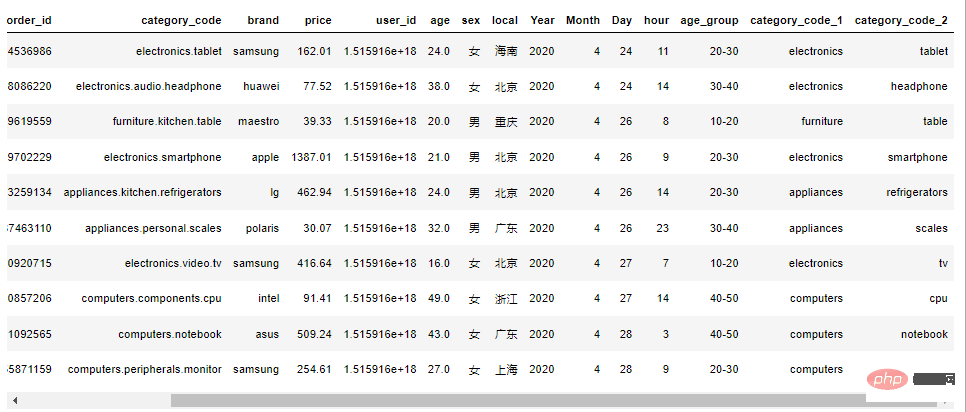
def get_bar1():
    bar1 = (
        Bar()
            .add_xaxis(x_data)
            .add_yaxis("订单数量", y_data1)
            .extend_axis(yaxis=opts.AxisOpts(axislabel_opts=opts.LabelOpts(formatter="{value}万")))
            .set_global_opts(
            legend_opts=opts.LegendOpts(pos_top='25%', pos_left='center'),
            title_opts=opts.TitleOpts(
                title='1-每月订单数量订单额',
                subtitle='-- 制图@公众号:Python当打之年 --',
                pos_top='7%',
                pos_left="center"
            )
        )
    )
    line = (
        Line()
            .add_xaxis(x_data)
            .add_yaxis("订单额", y_data2, yaxis_index=1)
    )
    bar1.overlap(line)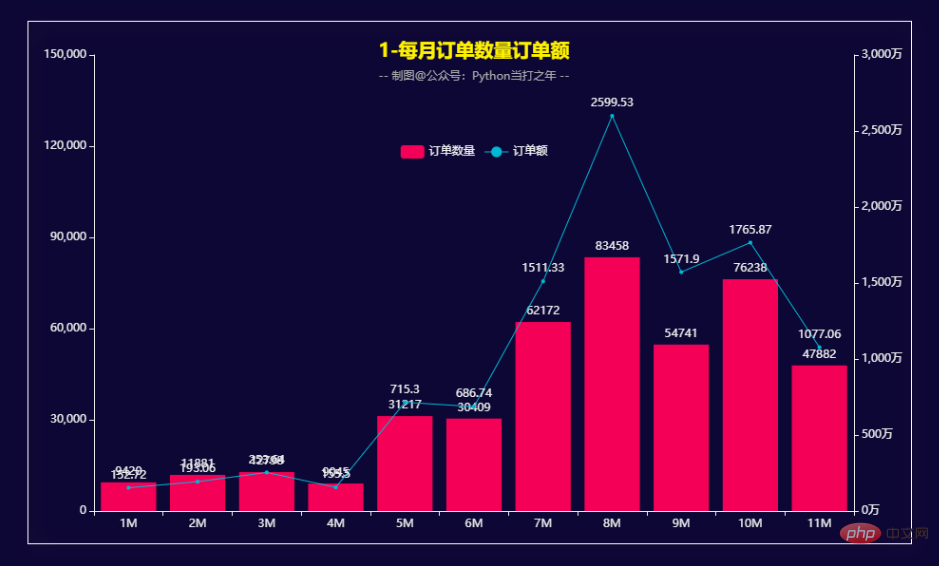
下半年的订单量和订单额相对于上半年明显增多。 8月份的订单量和订单额达到峰值。
def get_bar2():
    pie1 = (
        Pie()
            .add(
            "",
            datas,
            radius=["13%", "25%"],
            label_opts=opts.LabelOpts(formatter="{b}: {d}%"),
        )
    )
    bar1 = (
        Bar(init_opts=opts.InitOpts(theme='dark', width='1000px', height='600px', bg_color='#0d0735'))
            .add_xaxis(x_data)
            .add_yaxis("", y_data, itemstyle_opts=opts.ItemStyleOpts(color=JsCode(color_function)))
            .set_global_opts(
            legend_opts=opts.LegendOpts(is_show=False),
            title_opts=opts.TitleOpts(
                title='2-一月各天订单数量分布',
                subtitle='-- 制图@公众号:Python当打之年 --',
                pos_top='7%',
                pos_left="center"
            )
        )
    )
    bar1.overlap(pie1)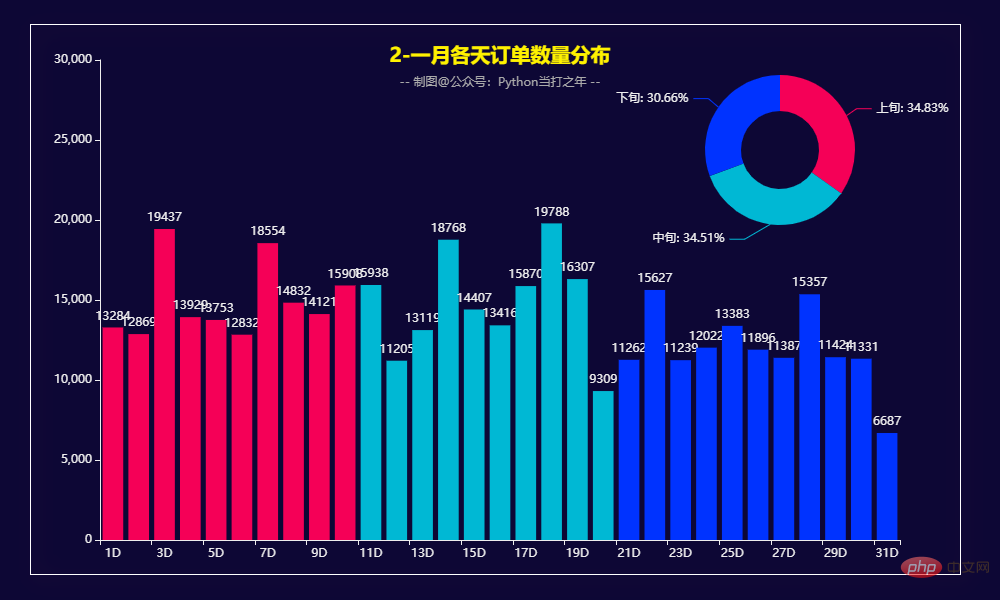
从每天的订单量上看,上中下旬订单量基本持平,占比都在30%以上,上旬和中旬要稍微高一点。
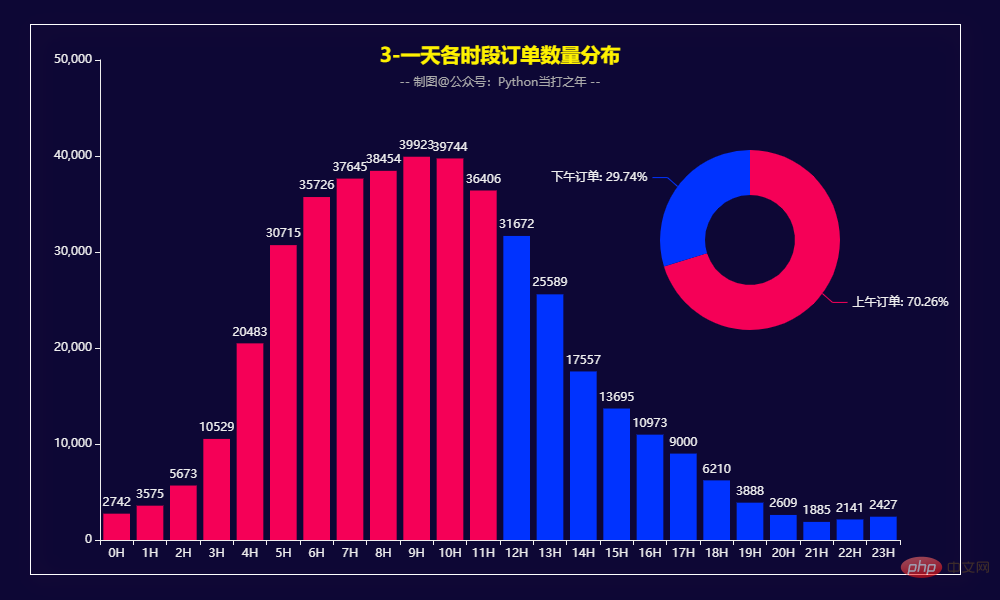
从订单时段上看,上午的订单要明显高于下午,占比达到了70.26%,尤其是在早上7:00-11:00之间。
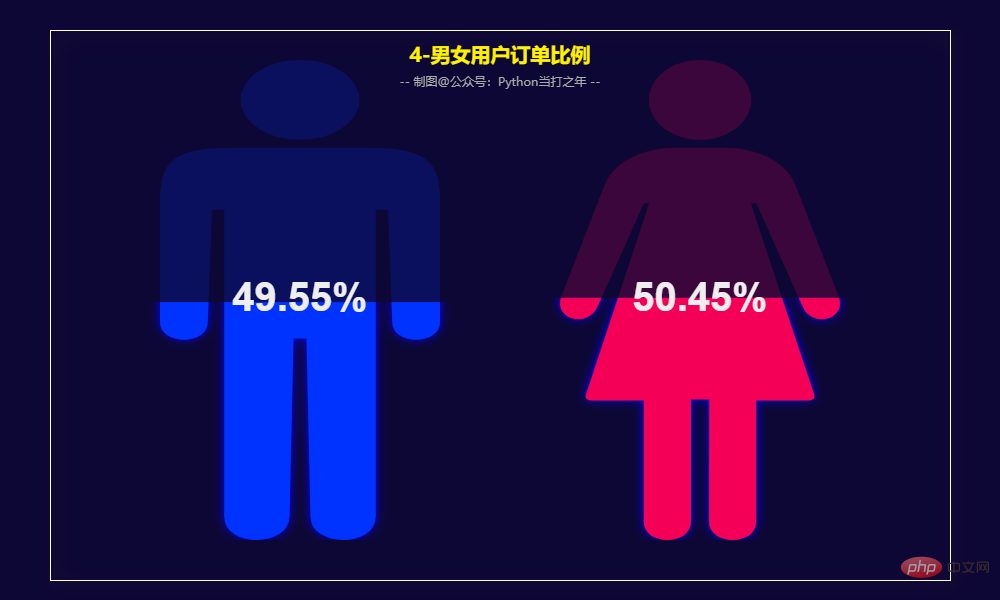
男性订单数量占比49.55%,女性订单数量占比50.45%,基本持平。
3.5 女性/男性购买商品TOP20
def get_bar3():
    bar1 = (
        Bar()
        .add_xaxis(x_data1)
        .add_yaxis('女性', y_data1,
                   label_opts=opts.LabelOpts(position='right')
                   )
        .set_global_opts(
            title_opts=opts.TitleOpts(
                title='5-女性/男性购买商品TOP20',
                subtitle='-- 制图@公众号:Python当打之年 --',
                pos_top='3%',
                pos_left="center"),
            legend_opts=opts.LegendOpts(pos_left='20%', pos_top='10%')
        )
        .reversal_axis()
    )
    bar2 = (
        Bar()
        .add_xaxis(x_data2)
        .add_yaxis('男性', y_data2,
                   label_opts=opts.LabelOpts(position='right')
                   )
        .set_global_opts(
            legend_opts=opts.LegendOpts(pos_right='25%', pos_top='10%')
        )
        .reversal_axis()
    )
    grid1 = (
        Grid()
        .add(bar1, grid_opts=opts.GridOpts(pos_left='12%', pos_right='50%', pos_top='15%'))
        .add(bar2, grid_opts=opts.GridOpts(pos_left='60%', pos_right='5%', pos_top='15%'))
    )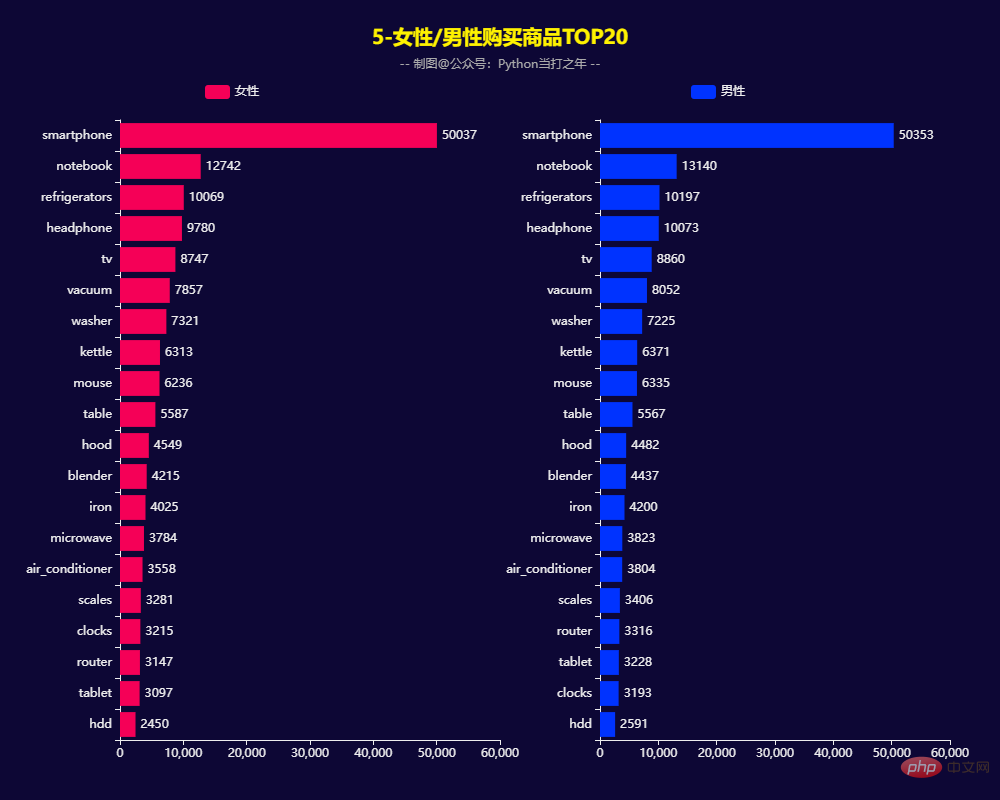
男性女性购买商品TOP20基本一致:smartphone、notebook、refrigerators、headphone等四类商品购买量比较大。
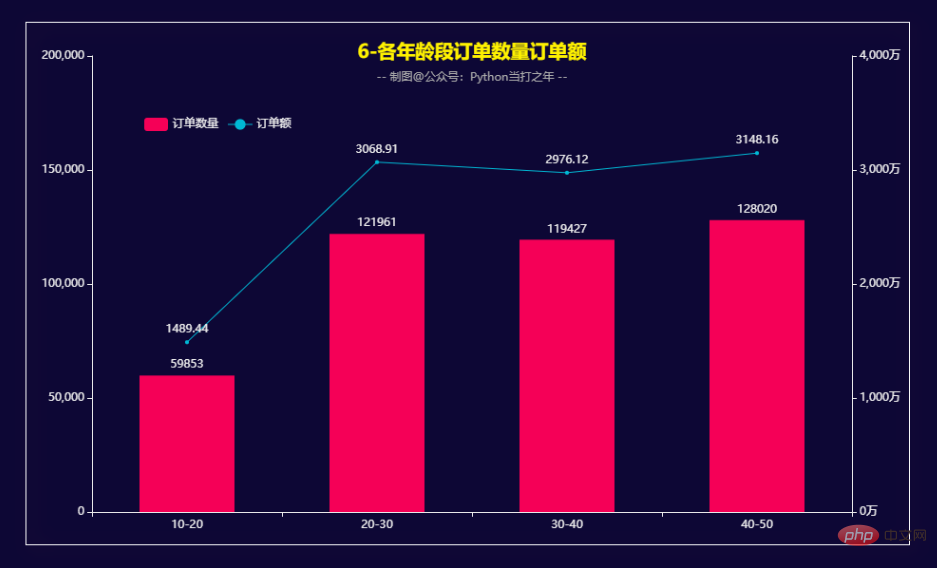
在10-50年龄段内,随着年龄段的增加,订单量和订单金额也在逐步增大。 细分的话,20-30和40-50这两个年龄段稍高一些。
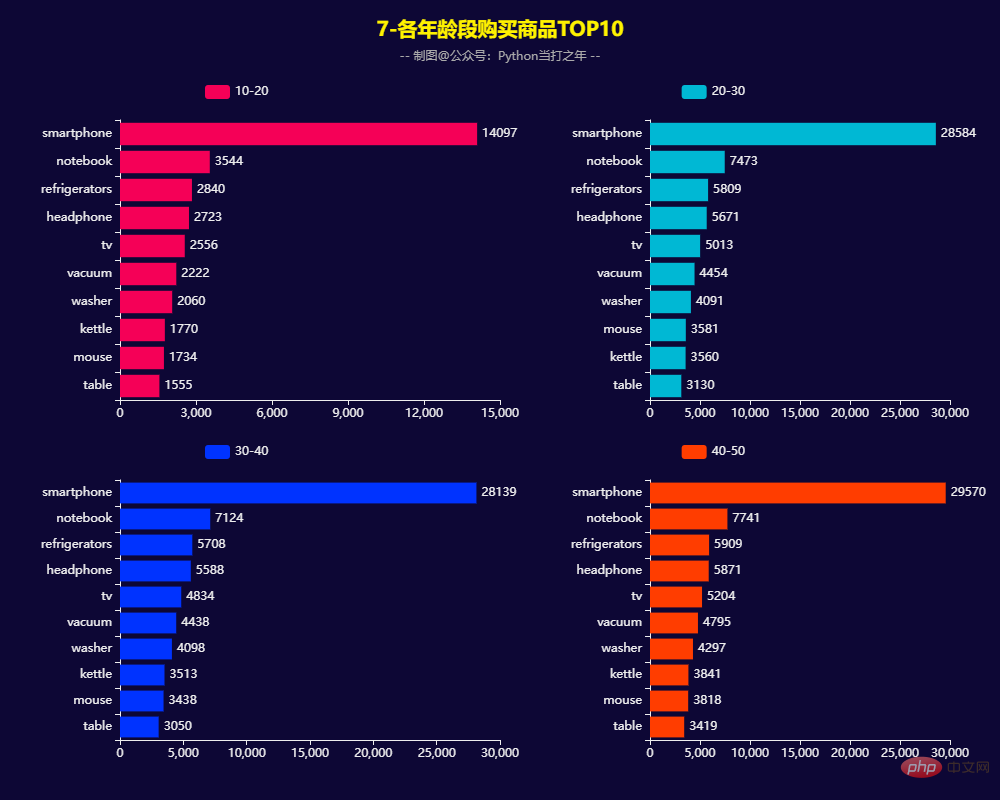
3.7 各年龄段购买商品TOP10
3.8 用户RFM等级画像
RFM模型是衡量客户价值和客户创利能力的重要工具和手段。该模型通过一个客户的近期购买行为(R)、购买的总体频率(F)以及花了多少钱(M)三项指标来描述该客户的价值状况,从而能够更加准确地将成本和精力更精确的花在用户层次身上,实现针对性的营销。
用户分类:
def rfm_func(x):
    level = x.apply(lambda x:"1" if x > 0 else '0')
    RMF = level.R + level.F + level.M
    dic_rfm ={
        '111':'重要价值客户',
        '011':'重要保持客户',
        '101':'重要发展客户',
        '001':'重要挽留客户',
        '110':'一般价值客户',
        '100':'一般发展客户',
        '010':'一般保持客户',
        '000':'一般挽留客户'
    }
    result = dic_rfm[RMF]
return result计算等级:
df_rfm = df1.copy()
df_rfm = df_rfm[['user_id','event_time','price']]
# 时间以当年年底为准
df_rfm['days'] = (pd.to_datetime("2020-12-31")-df_rfm["event_time"]).dt.days
# 计算等级
df_rfm = pd.pivot_table(df_rfm,index="user_id",
                     values=["user_id","days","price"],
                     aggfunc={"user_id":"count","days":"min","price":"sum"})
df_rfm = df_rfm[["days","user_id","price"]]
df_rfm.columns = ["R","F","M"]
df_rfm['RMF'] = df_rfm[['R','F','M']].apply(lambda x:x-x.mean()).apply(rfm_func,axis=1)
df_rfm.head()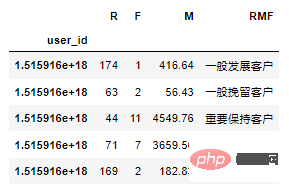
用户画像:
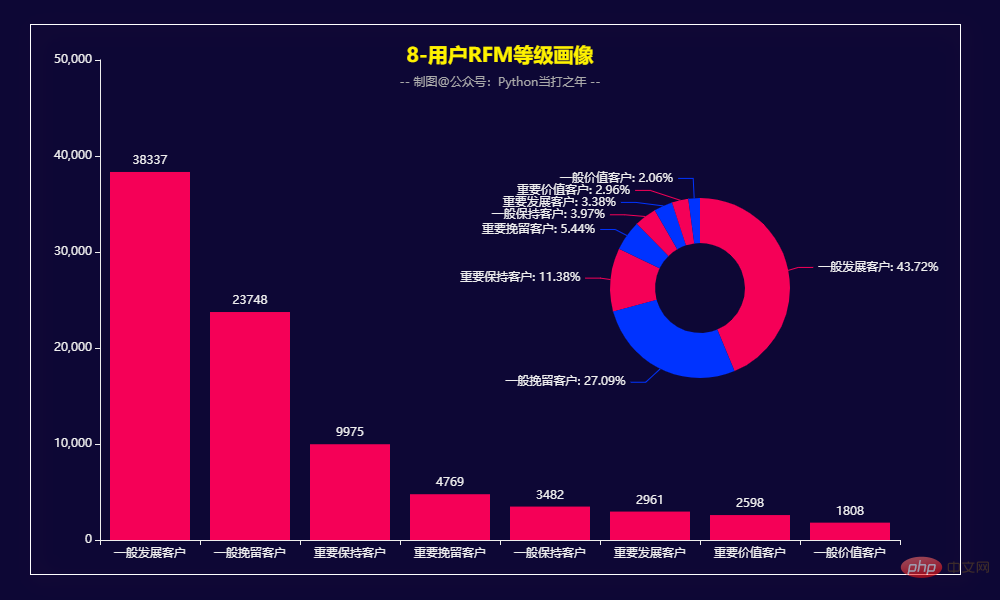
根据RFM模型可将用户分为以下8类:
重要价值客户:最近消费时间近、消费频次和消费金额都很高。 重要保持客户:最近消费时间较远,消费金额和频次都很高。
Important development customers: The recent consumption time is relatively recent and the consumption amount is high, but the frequency is not high and the loyalty is not high, very Potential users must be developed with emphasis.
Important Customer Retention: Those who recently spent a lot of time and the frequency of consumption is not high, but the amount of consumption is high Users, who may be about to be lost or have already been lost, should be given retention measures.
General value customers: recent consumption time, high frequency but low consumption amount. Need to improve their customers unit price.
General development customers: The recent consumption time is relatively recent, and the consumption amount and frequency are not high.
Generally retain customers: The recent consumption time is far away, the consumption frequency is high, and the consumption amount is not high.
General customer retention: The indexes are not high, so you can give up appropriately.
The above is the detailed content of Pandas+Pyecharts | Electronic product sales data analysis visualization + user RFM portrait. For more information, please follow other related articles on the PHP Chinese website!

Hot AI Tools

Undresser.AI Undress
AI-powered app for creating realistic nude photos

AI Clothes Remover
Online AI tool for removing clothes from photos.

Undress AI Tool
Undress images for free

Clothoff.io
AI clothes remover

AI Hentai Generator
Generate AI Hentai for free.

Hot Article
Hot Tools

Notepad++7.3.1
Easy-to-use and free code editor

SublimeText3 Chinese version
Chinese version, very easy to use

Zend Studio 13.0.1
Powerful PHP integrated development environment

Dreamweaver CS6
Visual web development tools

SublimeText3 Mac version
God-level code editing software (SublimeText3)
Hot Topics
 1382
1382
 52
52

 Solving common pandas installation problems: interpretation and solutions to installation errors
Feb 19, 2024 am 09:19 AM
Solving common pandas installation problems: interpretation and solutions to installation errors
Feb 19, 2024 am 09:19 AM
Pandas installation tutorial: Analysis of common installation errors and their solutions, specific code examples are required Introduction: Pandas is a powerful data analysis tool that is widely used in data cleaning, data processing, and data visualization, so it is highly respected in the field of data science . However, due to environment configuration and dependency issues, you may encounter some difficulties and errors when installing pandas. This article will provide you with a pandas installation tutorial and analyze some common installation errors and their solutions. 1. Install pandas
 How to read txt file correctly using pandas
Jan 19, 2024 am 08:39 AM
How to read txt file correctly using pandas
Jan 19, 2024 am 08:39 AM
How to use pandas to read txt files correctly requires specific code examples. Pandas is a widely used Python data analysis library. It can be used to process a variety of data types, including CSV files, Excel files, SQL databases, etc. At the same time, it can also be used to read text files, such as txt files. However, when reading txt files, we sometimes encounter some problems, such as encoding problems, delimiter problems, etc. This article will introduce how to read txt correctly using pandas
 Read CSV files and perform data analysis using pandas
Jan 09, 2024 am 09:26 AM
Read CSV files and perform data analysis using pandas
Jan 09, 2024 am 09:26 AM
Pandas is a powerful data analysis tool that can easily read and process various types of data files. Among them, CSV files are one of the most common and commonly used data file formats. This article will introduce how to use Pandas to read CSV files and perform data analysis, and provide specific code examples. 1. Import the necessary libraries First, we need to import the Pandas library and other related libraries that may be needed, as shown below: importpandasaspd 2. Read the CSV file using Pan
 python pandas installation method
Nov 22, 2023 pm 02:33 PM
python pandas installation method
Nov 22, 2023 pm 02:33 PM
Python can install pandas by using pip, using conda, from source code, and using the IDE integrated package management tool. Detailed introduction: 1. Use pip and run the pip install pandas command in the terminal or command prompt to install pandas; 2. Use conda and run the conda install pandas command in the terminal or command prompt to install pandas; 3. From Source code installation and more.
 How to install pandas in python
Dec 04, 2023 pm 02:48 PM
How to install pandas in python
Dec 04, 2023 pm 02:48 PM
Steps to install pandas in python: 1. Open the terminal or command prompt; 2. Enter the "pip install pandas" command to install the pandas library; 3. Wait for the installation to complete, and you can import and use the pandas library in the Python script; 4. Use It is a specific virtual environment. Make sure to activate the corresponding virtual environment before installing pandas; 5. If you are using an integrated development environment, you can add the "import pandas as pd" code to import the pandas library.
 Practical tips for reading txt files using pandas
Jan 19, 2024 am 09:49 AM
Practical tips for reading txt files using pandas
Jan 19, 2024 am 09:49 AM
Practical tips for reading txt files using pandas, specific code examples are required. In data analysis and data processing, txt files are a common data format. Using pandas to read txt files allows for fast and convenient data processing. This article will introduce several practical techniques to help you better use pandas to read txt files, along with specific code examples. Reading txt files with delimiters When using pandas to read txt files with delimiters, you can use read_c
 Pandas easily reads data from SQL database
Jan 09, 2024 pm 10:45 PM
Pandas easily reads data from SQL database
Jan 09, 2024 pm 10:45 PM
Data processing tool: Pandas reads data in SQL databases and requires specific code examples. As the amount of data continues to grow and its complexity increases, data processing has become an important part of modern society. In the data processing process, Pandas has become one of the preferred tools for many data analysts and scientists. This article will introduce how to use the Pandas library to read data from a SQL database and provide some specific code examples. Pandas is a powerful data processing and analysis tool based on Python
 Revealing the efficient data deduplication method in Pandas: Tips for quickly removing duplicate data
Jan 24, 2024 am 08:12 AM
Revealing the efficient data deduplication method in Pandas: Tips for quickly removing duplicate data
Jan 24, 2024 am 08:12 AM
The secret of Pandas deduplication method: a fast and efficient way to deduplicate data, which requires specific code examples. In the process of data analysis and processing, duplication in the data is often encountered. Duplicate data may mislead the analysis results, so deduplication is a very important step. Pandas, a powerful data processing library, provides a variety of methods to achieve data deduplication. This article will introduce some commonly used deduplication methods, and attach specific code examples. The most common case of deduplication based on a single column is based on whether the value of a certain column is duplicated.
