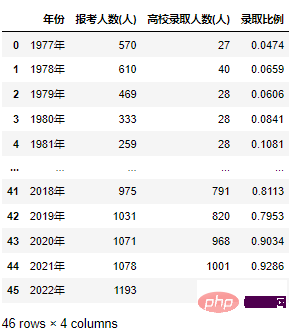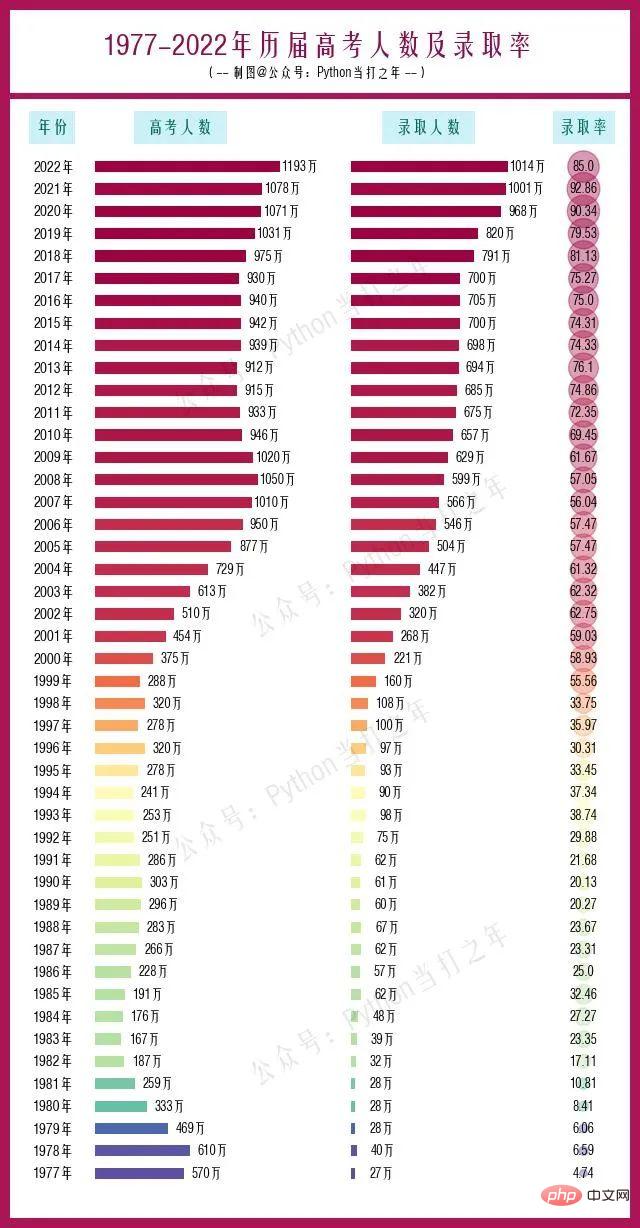
df = pd.read_excel('1977-2022历届高考录取率.xlsx')

2.1 绘制表头
ax.text(270, tit_pos, '年份', ha='center', va='bottom', fontsize=12, fontweight='heavy',color='#00695C')
ax.text(1100, tit_pos, '高考人数', ha='center', va='bottom', fontsize=12, fontweight='heavy',color='#00695C')
ax.text(2700, tit_pos, '录取人数', ha='center', va='bottom', fontsize=12, fontweight='heavy',color='#00695C')
ax.text(3700, tit_pos, '录取率', ha='center', va='bottom', fontsize=12, fontweight='heavy',color='#00695C')
2.2 绘制报考分数、录取人数条形图
years = df['年份'].values.tolist()
x = df['报考人数(人)'].values.tolist()
y = df['高校录取人数(人)'].values.tolist()
z = df['录取比例'].values.tolist()
ax.barh(years, x, left=550,tick_label=labels, height=0.5)
ax.barh(years, y, left=2200,tick_label=labels, height=0.5)
ax.scatter([3700]*len(z), years)
2.4 设置标题
ax.text(600, 50, '1977-2022年历届高考人数及录取率', fontdict={'color': '#880E4F', 'size': 20}, fontweight='heavy')
ax.text(1250, 49, '(-- 制图@公众号:Python当打之年 --)', fontsize = 9, fontweight='heavy',alpha=1)
The above is the detailed content of Python College Entrance Examination | matplotlib draws the distribution chart of the number of college entrance examination students and admission rates from 1977 to 2022. For more information, please follow other related articles on the PHP Chinese website!


