
 Backend Development
Python Tutorial
Pandas+Pyecharts | 2022 Fortune 500 Data Analysis Visualization
Backend Development
Python Tutorial
Pandas+Pyecharts | 2022 Fortune 500 Data Analysis Visualization
Pandas+Pyecharts | 2022 Fortune 500 Data Analysis Visualization

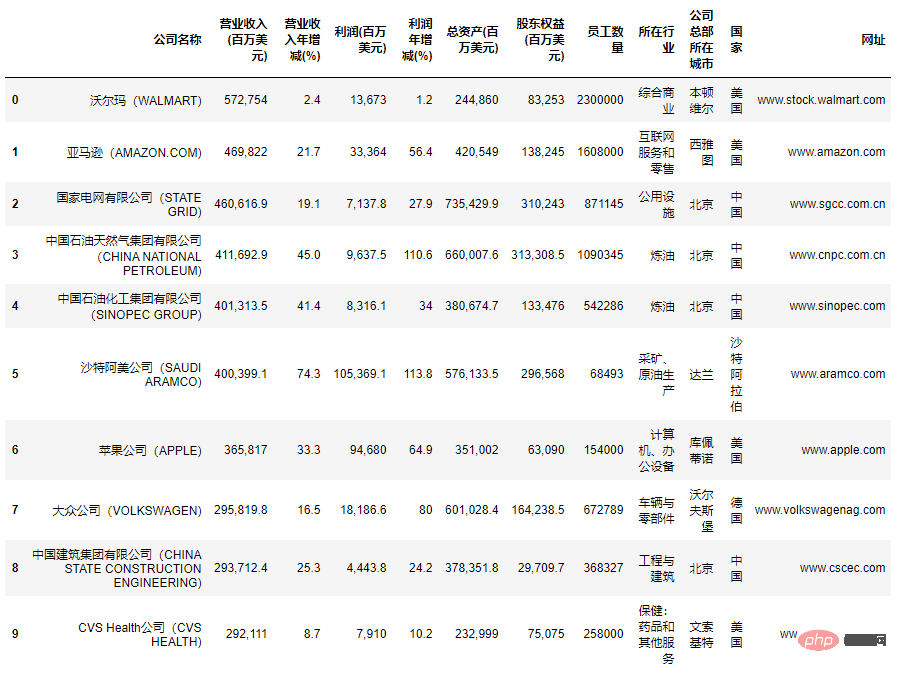
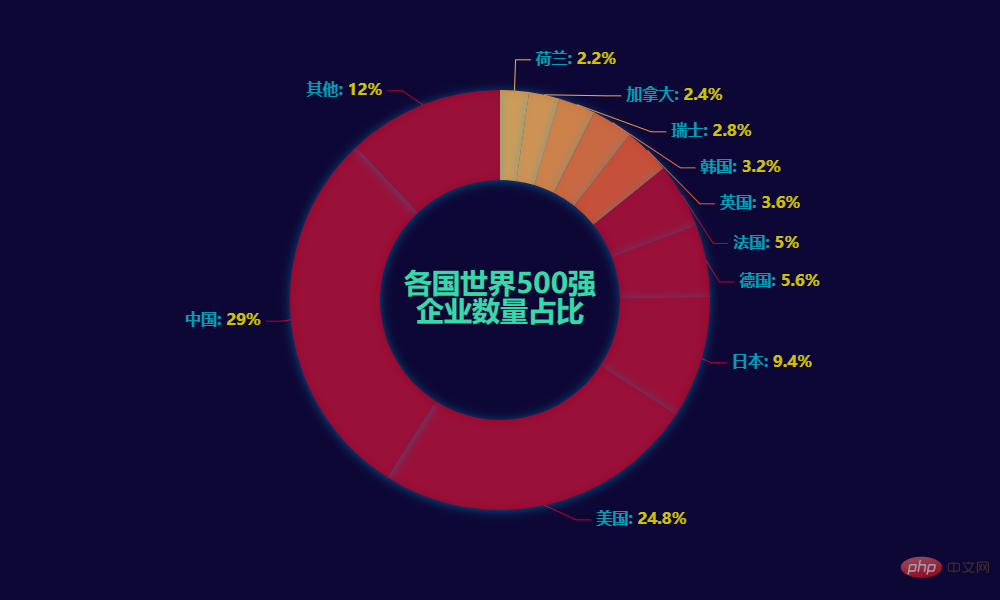
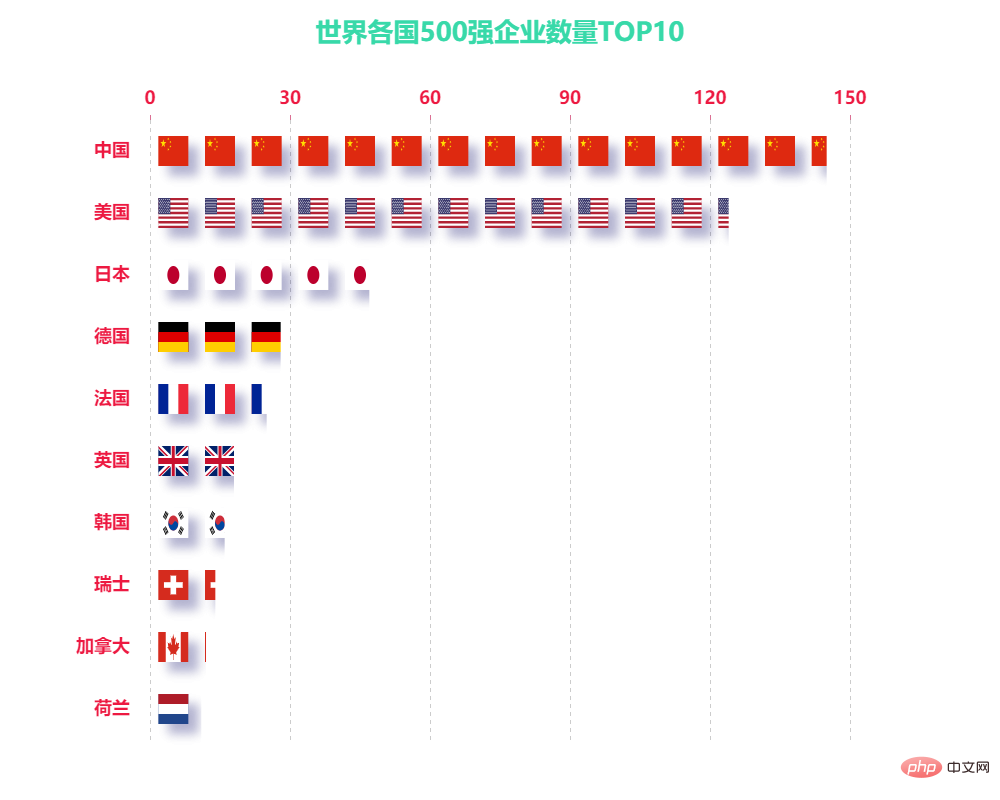
In this issue, we use Python to analyze the information data of the world's top 500 companies in 2022, take a look:
What countries are the top 500 companies roughly distributed in? Top 500 companies What are the Chinese companies and their distribution in various cities in the country -
Profit and loss situation of the top 500 companies ...
Libraries involved:
Pandas — Data Processing
Pyecharts — Data Visualization
##Visualization Section:
Pictogram — PictorialBar
Bar chart — Bar
Map — Map
- ##Geographic coordinate system — Geo
- Water Polo Chart — Liquid
- Polar Coordinate Chart — Polar
- Word Cloud — WordCloud
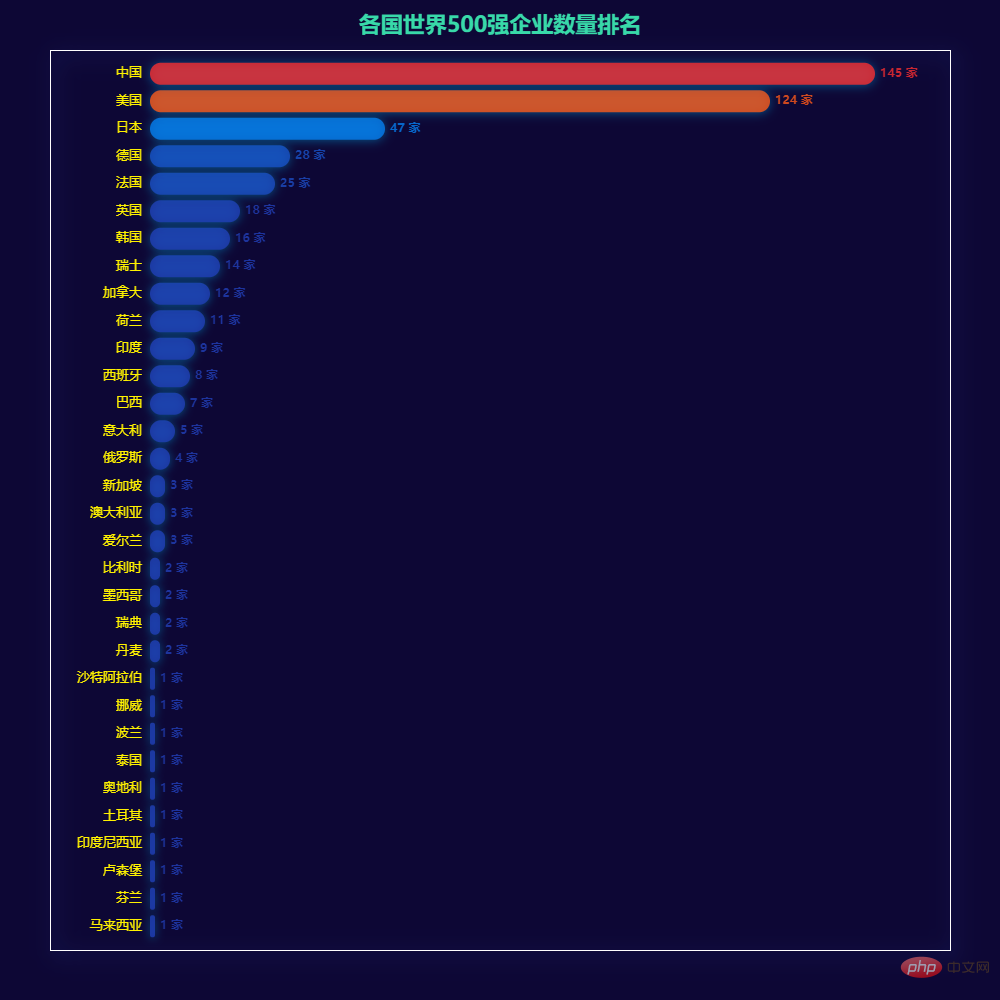
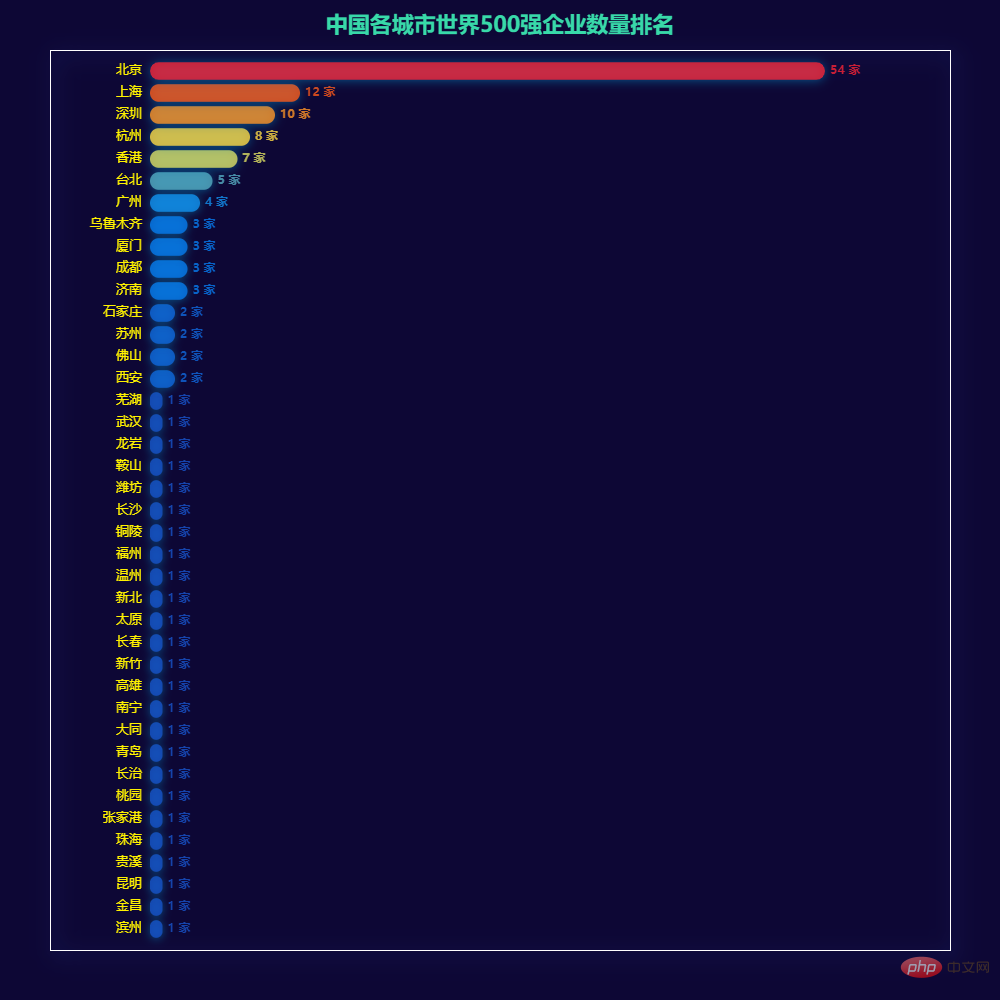
2.2 查看数据信息 500条数据没有确缺失,不需要进行其他处理。 我国世界500强企业有145家,占比高达29%,接近总量的1/3 The United States accounts for 24.8 and Japan accounts for 9.4% Guangzhou fell out of the top 5 with 4 companies, ranking 7th 效果2:
营收方面: #Part of the code is not shown due to space reasons, Online running address (including source code) :import pandas as pd
from pyecharts.charts import Pie
from pyecharts.charts import Bar
from pyecharts.charts import Grid
from pyecharts.charts import Map
from pyecharts.charts import Geo
from pyecharts.charts import WordCloud
from pyecharts.charts import PictorialBar
from pyecharts.charts import Liquid
from pyecharts.charts import Polar
from pyecharts import options as opts
from pyecharts.commons.utils import JsCode
df = pd.read_excel('2022年世界五百强排行榜.xlsx')
df.head(10)
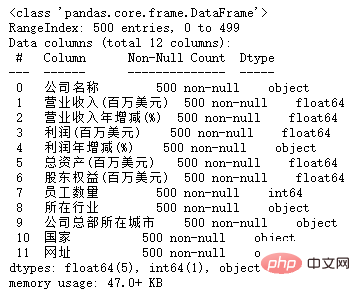
df.info()
bar = (
    Bar(init_opts=opts.InitOpts(width='1000px', height='1000px',bg_color='#0d0735'))
    .add_xaxis(x_data)
    .add_yaxis("",y_data)
    .set_series_opts(label_opts=opts.LabelOpts(position="right",
                                              font_size=12,
                                              font_weight='bold',
                                              formatter='{c} 家'),
                    )
    .set_global_opts(
                    xaxis_opts=opts.AxisOpts(is_show=False,),
                    yaxis_opts=opts.AxisOpts(
                        axislabel_opts=opts.LabelOpts(font_size=13,color='#fff200'),
                        axistick_opts=opts.AxisTickOpts(is_show=False),
                        axisline_opts=opts.AxisLineOpts(is_show=False)
                    ),
                    title_opts=opts.TitleOpts(title="各国世界500强企业数量排名",pos_left='center',pos_top='1%',
                              title_textstyle_opts=opts.TextStyleOpts(font_size=22,color="#38d9a9")),
                    visualmap_opts=opts.VisualMapOpts(is_show=False,
                                      min_=20,
                                      max_=150,
                                      is_piecewise=False,
                                      dimension=0,
                                      range_color=['#203fb6', '#008afb', '#ffec4a', '#ff6611', '#f62336']
                                                     ),
                    )
    .reversal_axis()
)
p = (
Polar(init_opts=opts.InitOpts(width='1000px', height='800px', bg_color='#0d0735'))
.add_schema(
radiusaxis_opts=opts.RadiusAxisOpts(data=x_data[-8:],
type_='category'),
angleaxis_opts=opts.AngleAxisOpts(
is_clockwise=True,
is_scale=True,
max_=150,
axislabel_opts=opts.LabelOpts(font_size=14, color='#fff200'),
axisline_opts=opts.AxisLineOpts(is_show=True,linestyle_opts=opts.LineStyleOpts(
width=2,type_='dashed',color='#e4e932')),
splitline_opts=opts.SplitLineOpts(is_show=True,
linestyle_opts=opts.LineStyleOpts(type_='dashed', color='#9FC131')
),
),
)
.add('',y_data[-8:], type_='bar')
.set_global_opts(
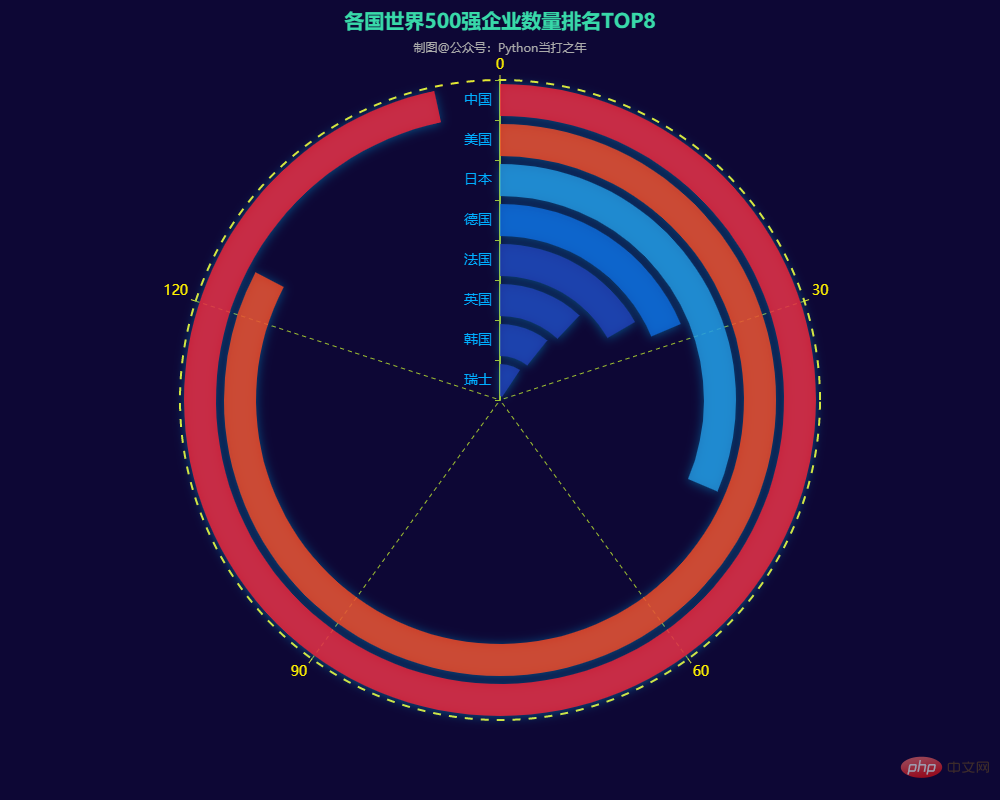
title_opts=opts.TitleOpts(title='各国世界500强企业数量排名TOP8',subtitle='制图@公众号:Python当打之年',pos_left='center',pos_top='1%',
title_textstyle_opts=opts.TextStyleOpts(color='#38d9a9',font_size=20)
),
visualmap_opts=opts.VisualMapOpts(max_=150, is_show = False, is_piecewise=True, split_number = 8, min_ = 10,
range_color=['#203fb6', '#008afb', '#ffec4a', '#ff6611', '#f62336']
),
)
)
 Domestic aspects:
 m1 = (
Map(init_opts=opts.InitOpts(width='1000px', height='500px',theme='dark',bg_color='#0d0735'))
.add('公司数量',
region_data,
"world",
is_map_symbol_show=False,
is_roam=False,
)
.set_series_opts(label_opts=opts.LabelOpts(is_show=False))
.set_global_opts(
legend_opts=opts.LegendOpts(is_show=False),
visualmap_opts=opts.VisualMapOpts(is_show=True,
max_=150,
min_=0,
is_piecewise=True,
split_number=10,
pos_top='50%',
pos_left='10%',
range_color=['#9ecae1','#6baed6','#4292c6','#2171b5','#08519c','#08306b','#d4b9da','#c994c7','#df65b0','#e7298a','#ce1256','#980043','#67001f']
),
)
)

wd = WordCloud(init_opts=opts.InitOpts(width='1000px',height='600px',theme='dark',bg_color='#0d0735'))
wd.add('',
       [list(z) for z in zip(x_data, y_data)],
      )
wd.set_global_opts(
        title_opts=opts.TitleOpts(
            title=""),
        tooltip_opts=opts.TooltipOpts(is_show=True),
    )
wd.render_notebook()
The above is the detailed content of Pandas+Pyecharts | 2022 Fortune 500 Data Analysis Visualization. For more information, please follow other related articles on the PHP Chinese website!

Hot AI Tools

Undresser.AI Undress
AI-powered app for creating realistic nude photos

AI Clothes Remover
Online AI tool for removing clothes from photos.

Undress AI Tool
Undress images for free

Clothoff.io
AI clothes remover

AI Hentai Generator
Generate AI Hentai for free.

Hot Article
Hot Tools

Notepad++7.3.1
Easy-to-use and free code editor

SublimeText3 Chinese version
Chinese version, very easy to use

Zend Studio 13.0.1
Powerful PHP integrated development environment

Dreamweaver CS6
Visual web development tools

SublimeText3 Mac version
God-level code editing software (SublimeText3)
Hot Topics
 1378
1378
 52
52

 Python: Exploring Its Primary Applications
Apr 10, 2025 am 09:41 AM
Python: Exploring Its Primary Applications
Apr 10, 2025 am 09:41 AM
Python is widely used in the fields of web development, data science, machine learning, automation and scripting. 1) In web development, Django and Flask frameworks simplify the development process. 2) In the fields of data science and machine learning, NumPy, Pandas, Scikit-learn and TensorFlow libraries provide strong support. 3) In terms of automation and scripting, Python is suitable for tasks such as automated testing and system management.
 The 2-Hour Python Plan: A Realistic Approach
Apr 11, 2025 am 12:04 AM
The 2-Hour Python Plan: A Realistic Approach
Apr 11, 2025 am 12:04 AM
You can learn basic programming concepts and skills of Python within 2 hours. 1. Learn variables and data types, 2. Master control flow (conditional statements and loops), 3. Understand the definition and use of functions, 4. Quickly get started with Python programming through simple examples and code snippets.
 Navicat's method to view MongoDB database password
Apr 08, 2025 pm 09:39 PM
Navicat's method to view MongoDB database password
Apr 08, 2025 pm 09:39 PM
It is impossible to view MongoDB password directly through Navicat because it is stored as hash values. How to retrieve lost passwords: 1. Reset passwords; 2. Check configuration files (may contain hash values); 3. Check codes (may hardcode passwords).
 How to use AWS Glue crawler with Amazon Athena
Apr 09, 2025 pm 03:09 PM
How to use AWS Glue crawler with Amazon Athena
Apr 09, 2025 pm 03:09 PM
As a data professional, you need to process large amounts of data from various sources. This can pose challenges to data management and analysis. Fortunately, two AWS services can help: AWS Glue and Amazon Athena.
 How to start the server with redis
Apr 10, 2025 pm 08:12 PM
How to start the server with redis
Apr 10, 2025 pm 08:12 PM
The steps to start a Redis server include: Install Redis according to the operating system. Start the Redis service via redis-server (Linux/macOS) or redis-server.exe (Windows). Use the redis-cli ping (Linux/macOS) or redis-cli.exe ping (Windows) command to check the service status. Use a Redis client, such as redis-cli, Python, or Node.js, to access the server.
 How to read redis queue
Apr 10, 2025 pm 10:12 PM
How to read redis queue
Apr 10, 2025 pm 10:12 PM
To read a queue from Redis, you need to get the queue name, read the elements using the LPOP command, and process the empty queue. The specific steps are as follows: Get the queue name: name it with the prefix of "queue:" such as "queue:my-queue". Use the LPOP command: Eject the element from the head of the queue and return its value, such as LPOP queue:my-queue. Processing empty queues: If the queue is empty, LPOP returns nil, and you can check whether the queue exists before reading the element.
 How to view server version of Redis
Apr 10, 2025 pm 01:27 PM
How to view server version of Redis
Apr 10, 2025 pm 01:27 PM
Question: How to view the Redis server version? Use the command line tool redis-cli --version to view the version of the connected server. Use the INFO server command to view the server's internal version and need to parse and return information. In a cluster environment, check the version consistency of each node and can be automatically checked using scripts. Use scripts to automate viewing versions, such as connecting with Python scripts and printing version information.
 How secure is Navicat's password?
Apr 08, 2025 pm 09:24 PM
How secure is Navicat's password?
Apr 08, 2025 pm 09:24 PM
Navicat's password security relies on the combination of symmetric encryption, password strength and security measures. Specific measures include: using SSL connections (provided that the database server supports and correctly configures the certificate), regularly updating Navicat, using more secure methods (such as SSH tunnels), restricting access rights, and most importantly, never record passwords.
