
 Backend Development
Python Tutorial
4000 words of detailed description, recommending 20 useful Pandas function methods
Backend Development
Python Tutorial
4000 words of detailed description, recommending 20 useful Pandas function methods
4000 words of detailed description, recommending 20 useful Pandas function methods

You may not see much of the pandas function, but it is very convenient to use. It can also help our data analysts greatly improve their work efficiency. I also hope that everyone will gain something after reading it
items()method##iterrows() methodinsert() Methodassign() Methodeval() method- ##pop()
method - truncate()
Method - count()
Method ##add_prefix() - Method/
add_suffix () methodclip() - method
- method
<li><section style="margin-top: 5px;margin-bottom: 5px;color: rgb(1, 1, 1);line-height: 2em;"><code style='font-size: 14px;padding: 2px 4px;border-radius: 4px;margin-right: 2px;margin-left: 2px;color: rgb(30, 107, 184);background-color: rgba(27, 31, 35, 0.05);font-family: "Operator Mono", Consolas, Monaco, Menlo, monospace;word-break: break-all;'>first()method isin()method##df.plot.area() Methoddf.plot.bar() Methoddf.plot.box() Method- ##df.plot.pie()
Method
method
items()<div class="code" style="position:relative; padding:0px; margin:0px;"><pre class='brush:php;toolbar:false;'>df = pd.DataFrame({&#39;species&#39;: [&#39;bear&#39;, &#39;bear&#39;, &#39;marsupial&#39;],
&#39;population&#39;: [1864, 22000, 80000]},
index=[&#39;panda&#39;, &#39;polar&#39;, &#39;koala&#39;])
df</pre><div class="contentsignin">Copy after login</div></div>outputspecies population panda bear 1864 polar bear 22000 koala marsupial 80000
Then we use
items()Method<div class="code" style="position:relative; padding:0px; margin:0px;"><pre class='brush:php;toolbar:false;'>for label, content in df.items():
print(f&#39;label: {label}&#39;)
print(f&#39;content: {content}&#39;, sep=&#39;\n&#39;)
print("=" * 50)</pre><div class="contentsignin">Copy after login</div></div>output
label: species
content: panda         bear
polar         bear
koala    marsupial
Name: species, dtype: object
==================================================
label: population
content: panda     1864
polar    22000
koala    80000
Name: population, dtype: int64
==================================================
The column names and corresponding contents of the 'species' and 'population' columns are printed out one after another
Method
iterrows()<div class="code" style="position:relative; padding:0px; margin:0px;"><pre class='brush:php;toolbar:false;'>for label, content in df.iterrows():
print(f&#39;label: {label}&#39;)
print(f&#39;content: {content}&#39;, sep=&#39;\n&#39;)
print("=" * 50)</pre><div class="contentsignin">Copy after login</div></div>outputlabel: panda content: species bear population 1864 Name: panda, dtype: object ================================================== label: polar content: species bear population 22000 Name: polar, dtype: object ================================================== label: koala content: species marsupial population 80000 Name: koala, dtype: object ==================================================
insert()方法
insert()方法主要是用于在数据集当中的特定位置处插入数据,示例如下
df.insert(1, "size", [2000, 3000, 4000])
output
         species  size  population
panda       bear  2000        1864
polar       bear  3000       22000
koala  marsupial  4000       80000
可见在DataFrame数据集当中,列的索引也是从0开始的
assign()方法
assign()方法可以用来在数据集当中添加新的列,示例如下
df.assign(size_1=lambda x: x.population * 9 / 5 + 32)
output
         species  population    size_1
panda       bear        1864    3387.2
polar       bear       22000   39632.0
koala  marsupial       80000  144032.0
lambda匿名函数,在数据集当中添加一个新的列,命名为‘size_1’,当然我们也可以通过assign()方法来创建不止一个列df.assign(size_1 = lambda x: x.population * 9 / 5 + 32,
size_2 = lambda x: x.population * 8 / 5 + 10)output
         species  population    size_1    size_2
panda       bear        1864    3387.2    2992.4
polar       bear       22000   39632.0   35210.0
koala  marsupial       80000  144032.0  128010.0
eval()方法
eval()方法主要是用来执行用字符串来表示的运算过程的,例如
df.eval("size_3 = size_1 + size_2")output
         species  population    size_1    size_2    size_3
panda       bear        1864    3387.2    2992.4    6379.6
polar       bear       22000   39632.0   35210.0   74842.0
koala  marsupial       80000  144032.0  128010.0  272042.0
当然我们也可以同时对执行多个运算过程
df = df.eval('''
size_3 = size_1 + size_2
size_4 = size_1 - size_2
''')
output
         species  population    size_1    size_2    size_3   size_4
panda       bear        1864    3387.2    2992.4    6379.6    394.8
polar       bear       22000   39632.0   35210.0   74842.0   4422.0
koala  marsupial       80000  144032.0  128010.0  272042.0  16022.0
pop()方法
pop()方法主要是用来删除掉数据集中特定的某一列数据
df.pop("size_3")output
panda      6379.6
polar     74842.0
koala    272042.0
Name: size_3, dtype: float64
而原先的数据集当中就没有这个‘size_3’这一例的数据了
truncate()方法
truncate()方法主要是根据行索引来筛选指定行的数据的,示例如下
df = pd.DataFrame({'A': ['a', 'b', 'c', 'd', 'e'],
                   'B': ['f', 'g', 'h', 'i', 'j'],
                   'C': ['k', 'l', 'm', 'n', 'o']},
index=[1, 2, 3, 4, 5])output
   A  B  C
1  a  f  k
2  b  g  l
3  c  h  m
4  d  i  n
5  e  j  o
我们使用truncate()方法来做一下尝试
df.truncate(before=2, after=4)
output
   A  B  C
2  b  g  l
3  c  h  m
4  d  i  n
before和after存在于truncate()方法中,目的就是把行索引2之前和行索引4之后的数据排除在外,筛选出剩余的数据count()方法
count()方法主要是用来计算某一列当中非空值的个数,示例如下
df = pd.DataFrame({"Name": ["John", "Myla", "Lewis", "John", "John"],
                   "Age": [24., np.nan, 25, 33, 26],
"Single": [True, True, np.nan, True, False]})output
    Name   Age Single
0   John  24.0   True
1   Myla   NaN   True
2  Lewis  25.0    NaN
3   John  33.0   True
4   John  26.0  False
我们使用count()方法来计算一下数据集当中非空值的个数
df.count()
output
Name      5
Age       4
Single    4
dtype: int64
add_prefix()方法/add_suffix()方法
add_prefix()方法和add_suffix()方法分别会给列名以及行索引添加后缀和前缀,对于Series()数据集而言,前缀与后缀是添加在行索引处,而对于DataFrame()数据集而言,前缀与后缀是添加在列索引处,示例如下s = pd.Series([1, 2, 3, 4])
output
0    1
1    2
2    3
3    4
dtype: int64
我们使用add_prefix()方法与add_suffix()方法在Series()数据集上
s.add_prefix('row_')
output
row_0    1
row_1    2
row_2    3
row_3    4
dtype: int64
又例如
s.add_suffix('_row')
output
0_row    1
1_row    2
2_row    3
3_row    4
dtype: int64
DataFrame()形式数据集而言,add_prefix()方法以及add_suffix()方法是将前缀与后缀添加在列索引处的df = pd.DataFrame({'A': [1, 2, 3, 4], 'B': [3, 4, 5, 6]})output
   A  B
0  1  3
1  2  4
2  3  5
3  4  6
示例如下
df.add_prefix("column_")output
   column_A  column_B
0         1         3
1         2         4
2         3         5
3         4         6
又例如
df.add_suffix("_column")output
   A_column  B_column
0         1         3
1         2         4
2         3         5
3         4         6
clip()方法
clip()方法主要是通过设置阈值来改变数据集当中的数值,当数值超过阈值的时候,就做出相应的调整data = {'col_0': [9, -3, 0, -1, 5], 'col_1': [-2, -7, 6, 8, -5]}
df = pd.DataFrame(data)output
df.clip(lower = -4, upper = 4)
output
   col_0  col_1
0      4     -2
1     -3     -4
2      0      4
3     -1      4
4      4     -4
lower和upper分别代表阈值的上限与下限,数据集当中超过上限与下限的值会被替代。filter()方法
pandas当中的filter()方法是用来筛选出特定范围的数据的,示例如下
df = pd.DataFrame(np.array(([1, 2, 3], [4, 5, 6], [7, 8, 9], [10, 11, 12])),
                  index=['A', 'B', 'C', 'D'],
columns=['one', 'two', 'three'])output
   one  two  three
A    1    2      3
B    4    5      6
C    7    8      9
D   10   11     12
我们使用filter()方法来筛选数据
df.filter(items=['one', 'three'])
output
   one  three
A    1      3
B    4      6
C    7      9
D   10     12
我们还可以使用正则表达式来筛选数据
df.filter(regex='e$', axis=1)
output
   one  three
A    1      3
B    4      6
C    7      9
D   10     12
当然通过参数axis来调整筛选行方向或者是列方向的数据
df.filter(like='B', axis=0)
output
   one  two  three
B    4    5      6
first()方法
当数据集当中的行索引是日期的时候,可以通过该方法来筛选前面几行的数据
index_1 = pd.date_range('2021-11-11', periods=5, freq='2D')
ts = pd.DataFrame({'A': [1, 2, 3, 4, 5]}, index=index_1)
tsoutput
            A
2021-11-11  1
2021-11-13  2
2021-11-15  3
2021-11-17  4
2021-11-19  5
我们使用first()方法来进行一些操作,例如筛选出前面3天的数据
ts.first('3D')
output
            A
2021-11-11  1
2021-11-13  2
isin()方法
isin()方法主要是用来确认数据集当中的数值是否被包含在给定的列表当中
df = pd.DataFrame(np.array(([1, 2, 3], [4, 5, 6], [7, 8, 9], [10, 11, 12])),
                  index=['A', 'B', 'C', 'D'],
                  columns=['one', 'two', 'three'])
df.isin([3, 5, 12])output
     one    two  three
A  False  False   True
B  False   True  False
C  False  False  False
D  False  False   True
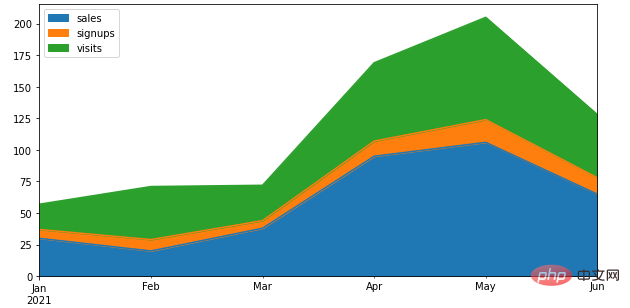
True,否则就返回Falsedf.plot.area()方法
Pandas当中通过一行代码来绘制图表,将所有的列都通过面积图的方式来绘制df = pd.DataFrame({
'sales': [30, 20, 38, 95, 106, 65],
'signups': [7, 9, 6, 12, 18, 13],
'visits': [20, 42, 28, 62, 81, 50],
}, index=pd.date_range(start='2021/01/01', end='2021/07/01', freq='M'))
ax = df.plot.area(figsize = (10, 5))output
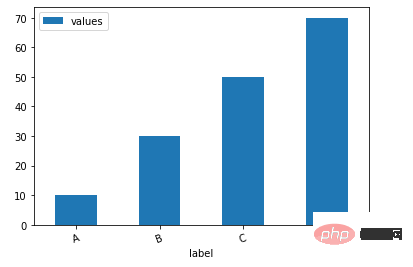
df.plot.bar()方法
下面我们看一下如何通过一行代码来绘制柱状图
df = pd.DataFrame({'label':['A', 'B', 'C', 'D'], 'values':[10, 30, 50, 70]})
ax = df.plot.bar(x='label', y='values', rot=20)output
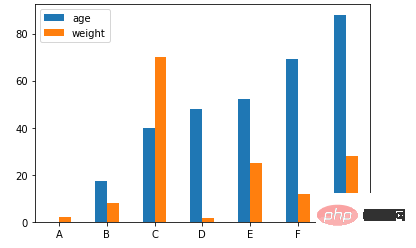
当然我们也可以根据不同的类别来绘制柱状图
age = [0.1, 17.5, 40, 48, 52, 69, 88]
weight = [2, 8, 70, 1.5, 25, 12, 28]
index = ['A', 'B', 'C', 'D', 'E', 'F', 'G']
df = pd.DataFrame({'age': age, 'weight': weight}, index=index)
ax = df.plot.bar(rot=0)output
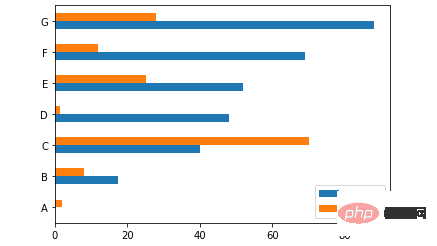
当然我们也可以横向来绘制图表
ax = df.plot.barh(rot=0)
output
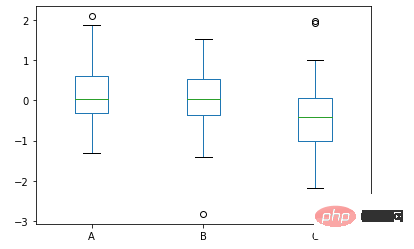
df.plot.box()方法
我们来看一下箱型图的具体的绘制,通过pandas一行代码来实现
data = np.random.randn(25, 3)
df = pd.DataFrame(data, columns=list('ABC'))
ax = df.plot.box()
output
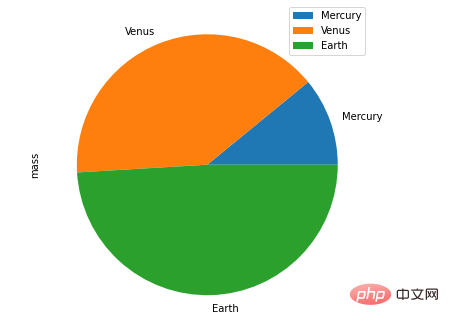
df.plot.pie()方法
接下来是饼图的绘制
df = pd.DataFrame({'mass': [1.33, 4.87 , 5.97],
                   'radius': [2439.7, 6051.8, 6378.1]},
                  index=['Mercury', 'Venus', 'Earth'])
plot = df.plot.pie(y='mass', figsize=(8, 8))output
除此之外,还有折线图、直方图、散点图等等,步骤与方式都与上述的技巧有异曲同工之妙,大家感兴趣的可以自己另外去尝试。
The above is the detailed content of 4000 words of detailed description, recommending 20 useful Pandas function methods. For more information, please follow other related articles on the PHP Chinese website!

Hot AI Tools

Undresser.AI Undress
AI-powered app for creating realistic nude photos

AI Clothes Remover
Online AI tool for removing clothes from photos.

Undress AI Tool
Undress images for free

Clothoff.io
AI clothes remover

AI Hentai Generator
Generate AI Hentai for free.

Hot Article
Hot Tools

Notepad++7.3.1
Easy-to-use and free code editor

SublimeText3 Chinese version
Chinese version, very easy to use

Zend Studio 13.0.1
Powerful PHP integrated development environment

Dreamweaver CS6
Visual web development tools

SublimeText3 Mac version
God-level code editing software (SublimeText3)
Hot Topics


 Is the conversion speed fast when converting XML to PDF on mobile phone?
Apr 02, 2025 pm 10:09 PM
Is the conversion speed fast when converting XML to PDF on mobile phone?
Apr 02, 2025 pm 10:09 PM
The speed of mobile XML to PDF depends on the following factors: the complexity of XML structure. Mobile hardware configuration conversion method (library, algorithm) code quality optimization methods (select efficient libraries, optimize algorithms, cache data, and utilize multi-threading). Overall, there is no absolute answer and it needs to be optimized according to the specific situation.
 Is there any mobile app that can convert XML into PDF?
Apr 02, 2025 pm 08:54 PM
Is there any mobile app that can convert XML into PDF?
Apr 02, 2025 pm 08:54 PM
An application that converts XML directly to PDF cannot be found because they are two fundamentally different formats. XML is used to store data, while PDF is used to display documents. To complete the transformation, you can use programming languages and libraries such as Python and ReportLab to parse XML data and generate PDF documents.
 How to convert XML files to PDF on your phone?
Apr 02, 2025 pm 10:12 PM
How to convert XML files to PDF on your phone?
Apr 02, 2025 pm 10:12 PM
It is impossible to complete XML to PDF conversion directly on your phone with a single application. It is necessary to use cloud services, which can be achieved through two steps: 1. Convert XML to PDF in the cloud, 2. Access or download the converted PDF file on the mobile phone.
 What is the function of C language sum?
Apr 03, 2025 pm 02:21 PM
What is the function of C language sum?
Apr 03, 2025 pm 02:21 PM
There is no built-in sum function in C language, so it needs to be written by yourself. Sum can be achieved by traversing the array and accumulating elements: Loop version: Sum is calculated using for loop and array length. Pointer version: Use pointers to point to array elements, and efficient summing is achieved through self-increment pointers. Dynamically allocate array version: Dynamically allocate arrays and manage memory yourself, ensuring that allocated memory is freed to prevent memory leaks.
 How to control the size of XML converted to images?
Apr 02, 2025 pm 07:24 PM
How to control the size of XML converted to images?
Apr 02, 2025 pm 07:24 PM
To generate images through XML, you need to use graph libraries (such as Pillow and JFreeChart) as bridges to generate images based on metadata (size, color) in XML. The key to controlling the size of the image is to adjust the values of the <width> and <height> tags in XML. However, in practical applications, the complexity of XML structure, the fineness of graph drawing, the speed of image generation and memory consumption, and the selection of image formats all have an impact on the generated image size. Therefore, it is necessary to have a deep understanding of XML structure, proficient in the graphics library, and consider factors such as optimization algorithms and image format selection.
 How to convert xml into pictures
Apr 03, 2025 am 07:39 AM
How to convert xml into pictures
Apr 03, 2025 am 07:39 AM
XML can be converted to images by using an XSLT converter or image library. XSLT Converter: Use an XSLT processor and stylesheet to convert XML to images. Image Library: Use libraries such as PIL or ImageMagick to create images from XML data, such as drawing shapes and text.
 How to open xml format
Apr 02, 2025 pm 09:00 PM
How to open xml format
Apr 02, 2025 pm 09:00 PM
Use most text editors to open XML files; if you need a more intuitive tree display, you can use an XML editor, such as Oxygen XML Editor or XMLSpy; if you process XML data in a program, you need to use a programming language (such as Python) and XML libraries (such as xml.etree.ElementTree) to parse.
 Recommended XML formatting tool
Apr 02, 2025 pm 09:03 PM
Recommended XML formatting tool
Apr 02, 2025 pm 09:03 PM
XML formatting tools can type code according to rules to improve readability and understanding. When selecting a tool, pay attention to customization capabilities, handling of special circumstances, performance and ease of use. Commonly used tool types include online tools, IDE plug-ins, and command-line tools.
