 Java
Java
 JavaInterview questions
 Alibaba terminal: 1 million login requests per day, 8G memory, how to set JVM parameters?
Alibaba terminal: 1 million login requests per day, 8G memory, how to set JVM parameters?
Years later, I have revised more than 100 resumes and conducted more than 200 mock interviews.

Just last week, a classmate was asked this question during the final technical interview with Alibaba Cloud: Assume a platform with 1 million login requests per day and a service node with 8G memory. How to set JVM parameters? If you think the answer is not ideal, come to me for review.
If you also need resume modification, resume beautification, resume packaging, mock interviews, etc., you can contact me.
The following is sorted out for everyone in the form of interview questions to kill two birds with one stone:
For your practical reference Also for your interview reference
What everyone needs to learn, in addition to the JVM configuration plan, is its idea of analyzing problems and the perspective of thinking about problems. These ideas and perspectives can help everyone go further and further.
Next, let’s get to the point.
How to set JVM parameters for 1 million login requests per day and 8G memory?
How to set JVM parameters for 1 million login requests per day and 8G memory can be roughly divided into the following 8 steps.
Step1: How to plan capacity when the new system goes online?
1. Summary of routines
Any new business system needs to estimate the server configuration and JVM memory parameters before going online. This capacity and resource planning It is not just a random estimate by the system architect. It needs to be estimated based on the business scenario where the system is located, inferring a system operation model, and evaluating indicators such as JVM performance and GC frequency. The following is a modeling step I summarized based on the experience of Daniel and my own practice:
Calculate how much memory space the objects created by the business system occupy per second, and then calculate the memory space occupied by each system under the cluster per second (object creation speed) Set a machine configuration, estimate the space of the new generation, and compare how often MinorGC is triggered under different new generation sizes. In order to avoid frequent GC, you can re-estimate how many machine configurations are needed, how many machines are deployed, how much memory space is given to the JVM, and how much space is given to the new generation. Based on this set of configurations, we can basically calculate the operation model of the entire system, how many objects are created per second, which will become garbage after 1 second, how long the system runs, and how often the new generation will trigger a GC. high.
2. Practical practice of routines-taking logging into the system as an example
Some students are still confused after seeing these steps, and they seem to say so The thing is, I still don’t know how to do it in actual projects!
Just talk without practicing tricks, take the login system as an example to simulate the deduction process:
Assume that there are 1 million login requests per day, and the login peak is in the morning. It is estimated that there will be 100 login requests per second during the peak period. Assume that 3 servers are deployed, and each machine handles 30 login requests per second. Assuming that a login request needs to be processed for 1 second, the JVM new generation will generate 30 login requests per second. Login objects, after 1s the request is completed, these objects become garbage. A login request object assumes 20 fields, an object is estimated to be 500 bytes, and 30 logins occupy about 15kb, taking into account RPC and DB operations, network communication, writing database, and writing cache After one operation, it can be expanded to 20-50 times, and hundreds of k-1M data can be generated in about 1 second. Assuming that a 2C4G machine is deployed and 2G heap memory is allocated, the new generation is only a few hundred M. According to the garbage generation rate of 1s1M, MinorGC will be triggered once in a few hundred seconds. Assume that a 4C8G machine is deployed, allocates 4G heap memory, and allocates 2G to the new generation. It will take several hours to trigger MinorGC.
Therefore, it can be roughly inferred that a login system with 1 million requests per day can guarantee the system by allocating 4G heap memory and 2G new generation JVM according to the 3-instance cluster configuration of 4C8G. of a normal load.
Basically evaluate the resources of a new system, so to build a new system, how much capacity and configuration are required for each instance, how many instances are configured in the cluster, etc., etc., are not just a matter of patting the head and chest. The decision is made.
Step2: How to select a garbage collector?
Throughput or response time
First introduce two concepts: throughput and low latency
Throughput = CPU time when the user application is running / (CPU time when the user application is running, CPU garbage collection time)
Response time = Average GC time consumption per time
Usually, whether to prioritize throughput or response is a dilemma in the JVM.
As the heap memory increases, the amount that gc can handle at one time becomes larger, and the throughput is greater; however, the time for gc to be processed at one time will become longer, resulting in a longer waiting time for threads queued later; on the contrary, if the heap memory is small, The gc time is short, the waiting time of queued threads is shortened, and the delay is reduced, but the number of requests at one time becomes smaller (not absolutely consistent).
It is impossible to take into account both at the same time. Whether to prioritize throughput or response is a question that needs to be weighed.
Considerations in the design of the garbage collector
The JVM does not allow garbage collection and creation of new objects during GC (just like cleaning and throwing garbage at the same time) ). JVM requires a Stop the world pause time, and STW will cause the system to pause briefly and be unable to process any requests; New generation collection frequency High, performance priority, commonly used copy algorithm; old generation frequency is low, space sensitive, avoid copy method. The goal of all garbage collectors is to make GC less frequent, shorter, and reduce the impact of GC on the system!
CMS and G1
The current mainstream garbage collector configuration is to use ParNew in the new generation and CMS combination in the old generation, or completely use the G1 collector.
Judging from future trends, G1 is the officially maintained and more respected garbage collector.
business system:
Recommended CMS for delay-sensitive services; For large memory services that require high throughput, use the G1 recycler!
The working mechanism of the CMS garbage collector
CMS is mainly a collector for the old generation. The old generation is marked and cleared. By default, it will be done after a FullGC algorithm. Defragmentation algorithm to clean up memory fragments.
| CMS GC | Description | Stop the world | Speed |
|---|---|---|---|
| 1. Start mark | The initial mark only marks objects that GCRoots can be directly associated with, which is very fast | Yes | very quickly |
| 2. Concurrent marking | The concurrent marking phase is the process of GCRoots Tracing | No | Slow |
| 3. Re-marking | The re-marking phase is to correct the marking records of that part of the objects that are changed due to the continued operation of the user program during concurrent marking. | Yes | Soon |
| 4. Garbage collection | Concurrent cleaning of garbage objects (mark and clear algorithm) | No | SLOW |
Advantages: concurrent collection, focusing on "low latency". No STW occurred in the two most time-consuming stages, and the stages requiring STW were completed very quickly. Disadvantages: 1. CPU consumption; 2. Floating garbage; 3. Memory fragmentation Applicable scenarios: Pay attention to server response speed and require system The pause time is minimal.
In short:
Business systems, delay-sensitive recommended CMS;
Large memory services, high requirements Throughput, using G1 collector!
#Step3: How to plan the proportion and size of each partition
The general idea is:
First of all, the JVM is the most important The core parameters are to evaluate memory and allocation. The first step is to specify the size of the heap memory. This is required when the system is online. -Xms is the initial heap size, -Xmx is the maximum heap size. In the background Java service, it is generally designated as system Half of the memory. If it is too large, it will occupy the system resources of the server. If it is too small, the best performance of the JVM cannot be exerted.
Secondly, you need to specify the size of the new generation of -Xmn. This parameter is very critical and very flexible. Although Sun officially recommends a size of 3/8, it should be determined according to the business scenario, for stateless or light-state services. (Now the most common business systems such as Web applications), generally the new generation can even be given 3/4 of the heap memory; and for stateful services (common systems such as IM services, gateway access layers, etc.) the new generation can Set according to the default ratio of 1/3. The service is stateful, which means that there will be more local cache and session state information resident in memory, so more space should be set up in the old generation to store these objects.
Finally, set the memory size of the -Xss stack and set the stack size of a single thread. The default value is related to the JDK version and system, and generally defaults to 512~1024kb. If a background service has hundreds of resident threads, the stack memory will also occupy hundreds of M in size.
For 8G memory, it is usually enough to allocate half of the maximum memory, because the machine still occupies a certain amount of memory. Generally, 4G memory is allocated to the JVM.
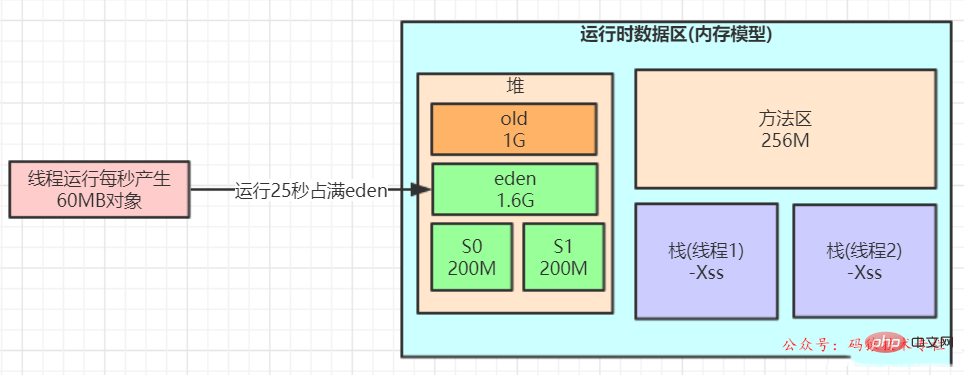
Introducing performance stress testing. The test students pressed the login interface to an object generation speed of 60M within 1 second, using the combined recycler of ParNew CMS.
The normal JVM parameter configuration is as follows:
1 |
|
This setting may cause problems due to Dynamic object age judgment principle leads to frequent full gc. why?
During the stress test, the Eden area will be full in a short period of time (for example, after 20 seconds). At this time, the object cannot be allocated when running again, and MinorGC will be triggered.
Assume that during this GC After S1 is loaded with 100M, MinorGC will be triggered again after 20 seconds. The extra 100M of surviving objects in the S1 area cannot be successfully put into the S2 area. At this time, the dynamic age mechanism of the JVM will be triggered, and a batch of about 100M will be If the objects are pushed to the old generation and kept running for a period of time, the system may trigger a FullGC within an hour.
When allocated according to the default ratio of 8:1:1, the survivor area is only about 10% of 1G, which is tens to 100M,
如果 每次minor GC垃圾回收过后进入survivor对象很多,并且survivor对象大小很快超过 Survivor 的 50% , 那么会触发动态年龄判定规则,让部分对象进入老年代.
而一个GC过程中,可能部分WEB请求未处理完毕, 几十兆对象,进入survivor的概率,是非常大的,甚至是一定会发生的.
如何解决这个问题呢?为了让对象尽可能的在新生代的eden区和survivor区, 尽可能的让survivor区内存多一点,达到200兆左右,
于是我们可以更新下JVM参数设置:
1 2 3 4 5 |
|
survivor达到200m,如果几十兆对象到底survivor, survivor 也不一定超过 50%
这样可以防止每次垃圾回收过后,survivor对象太早超过 50% ,
这样就降低了因为对象动态年龄判断原则导致的对象频繁进入老年代的问题,
What are the JVM dynamic age determination rules?
Dynamic age judgment rules for objects entering the old generation (dynamic promotion age calculation threshold): During Minor GC, when the size of objects with ages 1 to N in the Survivor exceeds 50% of the Survivor, then Put objects whose age is greater than or equal to N into the old generation.
The core optimization strategy is to keep short-term surviving objects in the survivor as much as possible and not enter the old generation. In this way, these objects will be recycled during minor gc and will not enter the old generation. This results in full gc.
How to evaluate the new generation memory and allocate it appropriately? I would like to mention here that the most important and core parameter of JVM is to evaluate memory and allocation. The first step is to specify the size of the heap memory. This is what must be done when the system goes online. -Xms initial heap size, -Xmx maximum heap size, In background Java services, it is generally specified as half of the system memory. If it is too large, it will occupy the system resources of the server, and if it is too small, the best performance of the JVM cannot be exerted. Secondly, you need to specify the size of the new generation of -Xmn. This parameter is very critical and has great flexibility. Although Sun officially recommends a size of 3/8, it must be determined according to the business scenario:For stateless or light-state services (now the most common business systems such as Web applications), generally the new generation can even be given 3/4 of the heap memory size; For stateful services (common systems such as IM services, gateway access layers, etc.), the new generation can be set according to the default ratio of 1/3.
The service is stateful, which means that there will be more local cache and session state information resident in memory. This should be due to setting up more space for the old generation to store these objects.
step4: What is the appropriate stack memory size?
-Xss stack memory size, set the stack size of a single thread. The default value is related to the JDK version and system, and generally defaults to 512~1024kb. If a background service has hundreds of resident threads, the stack memory will also occupy hundreds of M in size.
step5: What is the age of the object before it is appropriate to move it to the old generation?
Assume that a minor gc takes twenty to thirty seconds, and most objects will generally become garbage within a few seconds.
If the object has not been garbage collected for such a long time, Recycling, for example, if there is no recycling for 2 minutes, it can be considered that these objects will survive for a relatively long time, and thus be moved to the old generation instead of continuing to occupy the survivor area space.
所以,可以将默认的15岁改小一点,比如改为5,
那么意味着对象要经过5次minor gc才会进入老年代,整个时间也有一两分钟了(5*30s= 150s),和几秒的时间相比,对象已经存活了足够长时间了。
所以:可以适当调整JVM参数如下:
1 |
|
step6:多大的对象,可以直接到老年代比较合适?
对于多大的对象直接进入老年代(参数-XX:PretenureSizeThreshold),一般可以结合自己系统看下有没有什么大对象 生成,预估下大对象的大小,一般来说设置为1M就差不多了,很少有超过1M的大对象,
所以:可以适当调整JVM参数如下:
1 |
|
step7:垃圾回收器CMS老年代的参数优化
JDK8默认的垃圾回收器是-XX:+UseParallelGC(年轻代)和-XX:+UseParallelOldGC(老年代),
如果内存较大(超过4个G,只是经验 值),还是建议使用G1.
这里是4G以内,又是主打“低延时” 的业务系统,可以使用下面的组合:
1 |
|
新生代的采用ParNew回收器,工作流程就是经典复制算法,在三块区中进行流转回收,只不过采用多线程并行的方式加快了MinorGC速度。
老生代的采用CMS。再去优化老年代参数:比如老年代默认在标记清除以后会做整理,还可以在CMS的增加GC频次还是增加GC时长上做些取舍,
如下是响应优先的参数调优:
1 |
|
设定CMS在对内存占用率达到70%的时候开始GC(因为CMS会有浮动垃圾,所以一般都较早启动GC)
1 |
|
和上面搭配使用,否则只生效一次
1 |
|
强制操作系统把内存真正分配给IVM,而不是用时才分配。
综上,只要年轻代参数设置合理,老年代CMS的参数设置基本都可以用默认值,如下所示:
1 |
|
参数解释
1.‐Xms3072M ‐Xmx3072M 最小最大堆设置为3g,最大最小设置为一致防止内存抖动
2.‐Xss1M 线程栈1m
3.‐Xmn2048M ‐XX:SurvivorRatio=8 年轻代大小2g,eden与survivor的比例为8:1:1,也就是1.6g:0.2g:0.2g
4.-XX:MaxTenuringThreshold=5 年龄为5进入老年代 5.‐XX:PretenureSizeThreshold=1M 大于1m的大对象直接在老年代生成
6.‐XX: UseParNewGC ‐XX: UseConcMarkSweepGC Use ParNew cms garbage collector combination
7.‐XX:CMSInitiatingOccupancyFraction=70 Objects in the old generation After reaching this ratio, fullgc is triggered
8.‐XX: UseCMSInitiatinpOccupancyOnly After the objects in the old generation reach this ratio, fullgc is triggered, each time
9.‐XX : AlwaysPreTouch Forces the operating system to actually allocate memory to IVM instead of allocating it when it is used.
#step8: Memory dump files and GC logs when configuring OOM
Additional configuration content such as GC log printing and OOM automatic dump has been added to help troubleshoot problems
1 |
|
在Out Of Memory,JVM快死掉的时候,输出Heap Dump到指定文件。
不然开发很多时候还真不知道怎么重现错误。
路径只指向目录,JVM会保持文件名的唯一性,叫java_pid${pid}.hprof。
1 2 |
|
因为如果指向特定的文件,而文件已存在,反而不能写入。
输出4G的HeapDump,会导致IO性能问题,在普通硬盘上,会造成20秒以上的硬盘IO跑满,
需要注意一下,但在容器环境下,这个也会影响同一宿主机上的其他容器。
GC的日志的输出也很重要:
1 2 3 |
|
GC的日志实际上对系统性能影响不大,打日志对排查GC问题很重要。
一份通用的JVM参数模板
一般来说,大企业或者架构师团队,都会为项目的业务系统定制一份较为通用的JVM参数模板,但是许多小企业和团队可能就疏于这一块的设计,如果老板某一天突然让你负责定制一个新系统的JVM参数,你上网去搜大量的JVM调优文章或博客,结果发现都是零零散散的、不成体系的JVM参数讲解,根本下不了手,这个时候你就需要一份较为通用的JVM参数模板了,不能保证性能最佳,但是至少能让JVM这一层是稳定可控的,
在这里给大家总结了一份模板:
基于4C8G系统的ParNew+CMS回收器模板(响应优先),新生代大小根据业务灵活调整!
1 2 3 4 5 6 7 8 9 10 11 12 13 14 15 16 |
|
如果是GC的吞吐优先,推荐使用G1,基于8C16G系统的G1回收器模板:
G1收集器自身已经有一套预测和调整机制了,因此我们首先的选择是相信它,
即调整-XX:MaxGCPauseMillis=N参数,这也符合G1的目的——让GC调优尽量简单!
同时也不要自己显式设置新生代的大小(用-Xmn或-XX:NewRatio参数),
如果人为干预新生代的大小,会导致目标时间这个参数失效。
1 2 3 4 5 6 7 8 9 10 11 12 |
|
| JVM parameters | Description | Default | Recommended |
|---|---|---|---|
| -Xss | Stack memory size of each thread | Depends on idk | sun |
| G1参数 | 描述 | 默认值 |
|---|---|---|
| XX:MaxGCPauseMillis=N | 最大GC停顿时间。柔性目标,JVM满足90%,不保证100%。 | 200 |
| -XX:nitiatingHeapOccupancyPercent=n | 当整个堆的空间使用百分比超过这个值时,就会融发MixGC | 45 |
For -XX:MaxGCPauseMillis, the parameter settings have an obvious tendency: lower ↓: lower latency, but frequent MinorGC, less MixGC recycling of old areas, and increased Risk of large Full GC. Increase ↑: more objects will be recycled at a time, but the overall system response time will also be lengthened.
For InitiatingHeapOccupancyPercent, the effect of adjusting the parameter size is also different: lowering ↓: triggering MixGC earlier, wasting CPU. Increase ↑: Accumulate multiple generations of recycling regions, increasing the risk of FullGC.
Tuning Summary
Comprehensive tuning ideas before the system goes online:
1. Business estimation: Based on the expected concurrency, average The memory requirements of each task are then evaluated, how many machines are needed to host it, and what configuration is required for each machine.
2. Capacity estimation: According to the task processing speed of the system, then reasonably allocate the size of the Eden and Surivior areas, and the memory size of the old generation.
3. Recycler selection: For systems with response priority, it is recommended to use the ParNew CMS recycler; for throughput-first, multi-core large memory (heap size ≥ 8G) services, it is recommended to use the G1 recycler.
4. Optimization idea: Let the short-lived objects be recycled in the MinorGC stage (at the same time, the surviving objects after recycling
5. The tuning process summarized so far is mainly based on the testing and verification stage before going online, so we try to set the JVM parameters of the machine to the optimal value before going online!
JVM tuning is just a means, but not all problems can be solved by JVM tuning. Most Java applications do not require JVM optimization. We can follow some of the following principles:
Before going online, you should first consider setting the JVM parameters of the machine to the optimal level; -
Reduce the number of objects created (code level); Reduce the use of global variables and large objects (code level); Prioritize architecture tuning and code tuning, JVM optimization is a last resort (code , architecture level); It is better to analyze the GC situation and optimize the code than to optimize the JVM parameters (code level);
Through the above principles, we It was found that in fact, the most effective optimization method is the optimization of the architecture and code level, while JVM optimization is the last resort, which can also be said to be the last "squeeze" of the server configuration.
What is ZGC?
ZGC (Z Garbage Collector) is a garbage collector developed by Oracle with low latency as its primary goal.
It is a collector based on dynamic Region memory layout, (temporarily) without age generation, and uses technologies such as read barriers, dyed pointers, and memory multiple mapping to implement concurrent mark-sort algorithms.
Newly added in JDK 11, still in the experimental stage,
The main features are: recycling terabytes of memory (maximum 4T), and the pause time does not exceed 10ms.
Advantages: low pauses, high throughput, little extra memory consumed during ZGC collection
Disadvantages: floating garbage
Currently used very little, it is still needed to be truly popular Write the time.
How to choose a garbage collector?
How to choose in a real scenario? Here are some suggestions, I hope it will be helpful to you:
1. If your heap size is not very large (for example 100MB), choosing the serial collector is generally the most efficient. Parameters: -XX: UseSerialGC.
2. If your application runs on a single-core machine, or your virtual machine has only a single core, it is still appropriate to choose a serial collector. At this time, there is no need to enable some parallel collectors. income. Parameters: -XX: UseSerialGC.
3. If your application prioritizes "throughput" and has no special requirements for long pauses. It is better to choose parallel collector. Parameters: -XX: UseParallelGC.
4. If your application has higher response time requirements and wants fewer pauses. Even a pause of 1 second will cause a large number of request failures, so it is reasonable to choose G1, ZGC, or CMS. Although the GC pauses of these collectors are usually shorter, it requires some additional resources to handle the work, and the throughput is usually lower. Parameters: -XX: UseConcMarkSweepGC, -XX: UseG1GC, -XX: UseZGC, etc. From the above starting points, our ordinary web servers have very high requirements for responsiveness.
The selectivity is actually focused on CMS, G1, and ZGC. For some scheduled tasks, using a parallel collector is a better choice.
Why did Hotspot use metaspace to replace the permanent generation?
What is metaspace? What is permanent generation? Why use metaspace instead of permanent generation?
Let’s review the method area first, and look at the data memory graph when the virtual machine is running, as follows:
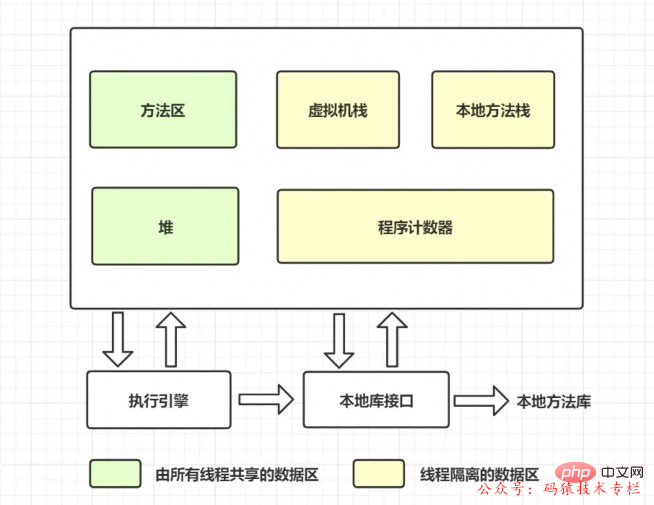
The method area, like the heap, is a memory area shared by each thread. It is used to store class information, constants, static variables, instant compiled code, etc. that have been loaded by the virtual machine. data.
What is the permanent generation? What does it have to do with the method area?
If you develop and deploy on the HotSpot virtual machine, many programmers call the method area the permanent generation.
It can be said that the method area is the specification, and the permanent generation is Hotspot's implementation of the specification.
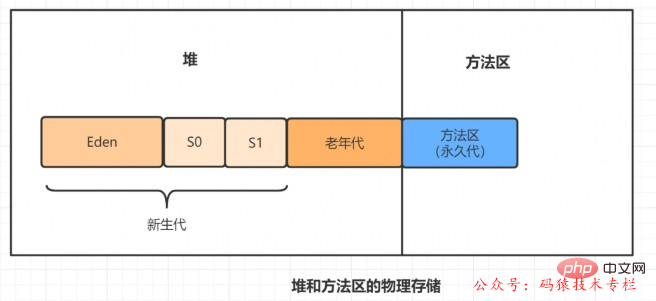
In Java7 and previous versions, the method area is implemented in the permanent generation.
What is metaspace? What does it have to do with the method area?
For Java8, HotSpots canceled the permanent generation and replaced it with metaspace.
In other words, the method area is still there, but the implementation has changed, from the permanent generation to the metaspace.
Why is the permanent generation replaced with metaspace?
The method area of the permanent generation is contiguous with the physical memory used by the heap.
The permanent generation is configured through the following two parameters~
-XX:PremSize: Set the initial size of the permanent generation-XX:MaxPermSize: Set The maximum value of the permanent generation, the default is 64M
For the permanent generation, if many classes are dynamically generated, java.lang.OutOfMemoryError is likely to occur :PermGen space error, because the permanent generation space configuration is limited. The most typical scenario is when there are many jsp pages in web development.
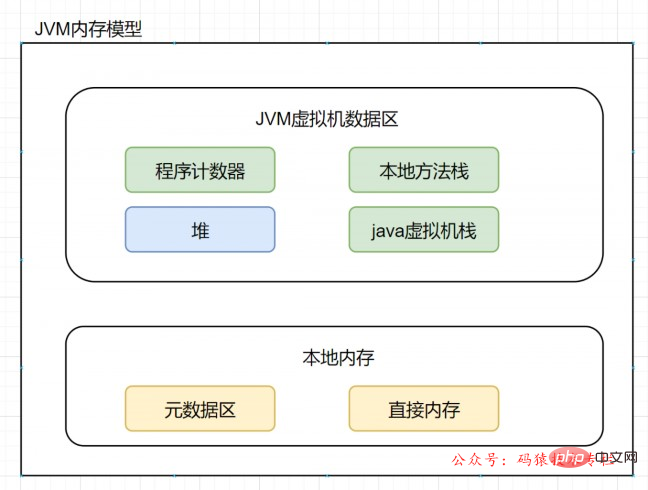
After JDK8, the method area exists in the metaspace (Metaspace).
The physical memory is no longer continuous with the heap, but exists directly in the local memory. Theoretically, the size of the machinememory is the size of the metaspace.
You can set the size of the metaspace through the following parameters:
-XX:MetaspaceSize, the initial space size. When reaching this value, garbage collection will be triggered for type unloading, and the GC will adjust the value: if a large amount of space is released If there is less space, lower the value appropriately; if very little space is released, increase the value appropriately when it does not exceed MaxMetaspaceSize.-XX:MaxMetaspaceSize, the maximum space, there is no limit by default.-XX:MinMetaspaceFreeRatio, after GC, the minimum percentage of Metaspace remaining space capacity, reduced to the garbage collection caused by allocated space-XX:MaxMetaspaceFreeRatio, after GC, the percentage of the maximum Metaspace remaining space capacity, reduced to the garbage collection caused by freeing space
So, why use metaspace to replace the permanent generation?
On the surface it is to avoid OOM exceptions.
Because PermSize and MaxPermSize are usually used to set the size of the permanent generation, which determines the upper limit of the permanent generation, but it is not always possible to know how large it should be set to. If you use the default value, it is easy to encounter OOM errors.
When using metaspace, how many classes of metadata can be loaded is no longer controlled by MaxPermSize, but by the actual available space of the system.
What is Stop The World? What is OopMap? What is a safe spot?
The process of garbage collection involves the movement of objects.
In order to ensure the correctness of object reference updates, all user threads must be suspended. A pause like this is described by the virtual machine designer as Stop The World. Also referred to as STW.
In HotSpot, there is a data structure (mapping table) called OopMap.
Once the class loading action is completed, HotSpot will calculate what type of data is at what offset in the object and record it to OopMap.
During the just-in-time compilation process, an OopMap will also be generated at specific locations, recording which locations on the stack and registers are references.
These specific positions are mainly at: 1. The end of the loop (non-counted loop)
2. Before the method returns / after calling the call instruction of the method
3. Locations where exceptions may be thrown
These locations are called safepoints.
When the user program is executed, it is not possible to pause and start garbage collection at any position in the code instruction flow, but it must be executed to a safe point before it can be paused.
The above is the detailed content of Alibaba terminal: 1 million login requests per day, 8G memory, how to set JVM parameters?. For more information, please follow other related articles on the PHP Chinese website!

Hot AI Tools

Undresser.AI Undress
AI-powered app for creating realistic nude photos

AI Clothes Remover
Online AI tool for removing clothes from photos.

Undress AI Tool
Undress images for free

Clothoff.io
AI clothes remover

AI Hentai Generator
Generate AI Hentai for free.

Hot Article

Hot Tools

Notepad++7.3.1
Easy-to-use and free code editor

SublimeText3 Chinese version
Chinese version, very easy to use

Zend Studio 13.0.1
Powerful PHP integrated development environment

Dreamweaver CS6
Visual web development tools

SublimeText3 Mac version
God-level code editing software (SublimeText3)

Hot Topics
 1377
1377
 52
52
 Perfect Number in Java
Aug 30, 2024 pm 04:28 PM
Guide to Perfect Number in Java. Here we discuss the Definition, How to check Perfect number in Java?, examples with code implementation.
 Random Number Generator in Java
Aug 30, 2024 pm 04:27 PM
Guide to Random Number Generator in Java. Here we discuss Functions in Java with examples and two different Generators with ther examples.
 Weka in Java
Aug 30, 2024 pm 04:28 PM
Guide to Weka in Java. Here we discuss the Introduction, how to use weka java, the type of platform, and advantages with examples.
 Smith Number in Java
Aug 30, 2024 pm 04:28 PM
Guide to Smith Number in Java. Here we discuss the Definition, How to check smith number in Java? example with code implementation.
 Java Spring Interview Questions
Aug 30, 2024 pm 04:29 PM
In this article, we have kept the most asked Java Spring Interview Questions with their detailed answers. So that you can crack the interview.
 Break or return from Java 8 stream forEach?
Feb 07, 2025 pm 12:09 PM
Java 8 introduces the Stream API, providing a powerful and expressive way to process data collections. However, a common question when using Stream is: How to break or return from a forEach operation? Traditional loops allow for early interruption or return, but Stream's forEach method does not directly support this method. This article will explain the reasons and explore alternative methods for implementing premature termination in Stream processing systems. Further reading: Java Stream API improvements Understand Stream forEach The forEach method is a terminal operation that performs one operation on each element in the Stream. Its design intention is
 TimeStamp to Date in Java
Aug 30, 2024 pm 04:28 PM
Guide to TimeStamp to Date in Java. Here we also discuss the introduction and how to convert timestamp to date in java along with examples.
 Create the Future: Java Programming for Absolute Beginners
Oct 13, 2024 pm 01:32 PM
Java is a popular programming language that can be learned by both beginners and experienced developers. This tutorial starts with basic concepts and progresses through advanced topics. After installing the Java Development Kit, you can practice programming by creating a simple "Hello, World!" program. After you understand the code, use the command prompt to compile and run the program, and "Hello, World!" will be output on the console. Learning Java starts your programming journey, and as your mastery deepens, you can create more complex applications.


