

A distributed JVM monitoring tool, very practical!
##Introduction
This project is for convenience Developers can monitor multiple remote host JVMs faster. If your project is Spring boot, it is very easy to integrate. Just introduce the jar package. If you are not Spring boot, don’t be discouraged. You can quickly initialize a Spring boot program by yourself and just introduce the jar package.Show results

Overall architecture
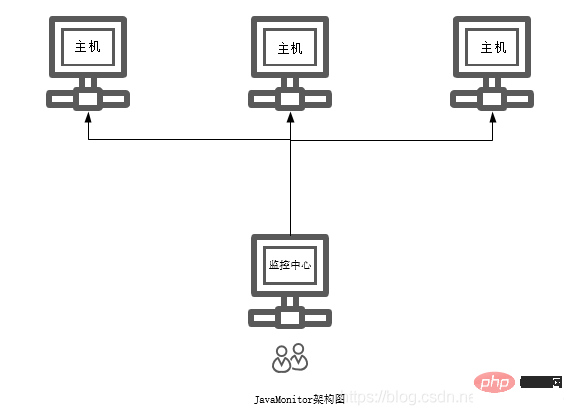
- https://github.com/xk4848123/monitor
- https://github.com/xk4848123/ monitor-server
Requires JDK in the machine. Not just JRE, configure the java path, and rely on ExcuteCmd to find the basic jdk commands in the program
Teach you step by step how to use
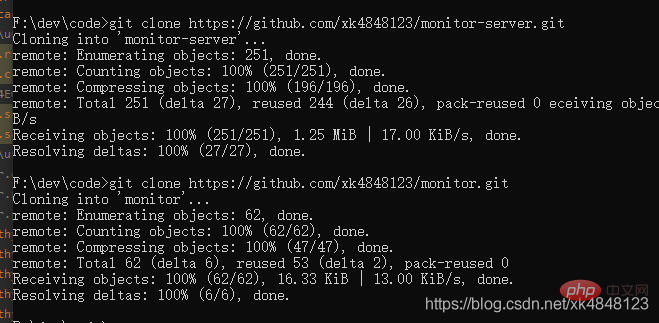
Clone monitor-server
git clone https://github.com/xk4848123/monitor-server.git
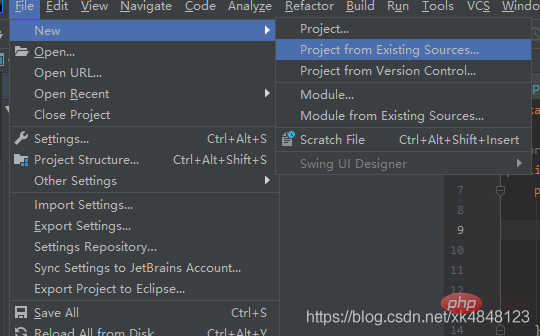
idea -> Project from Existing Sources…
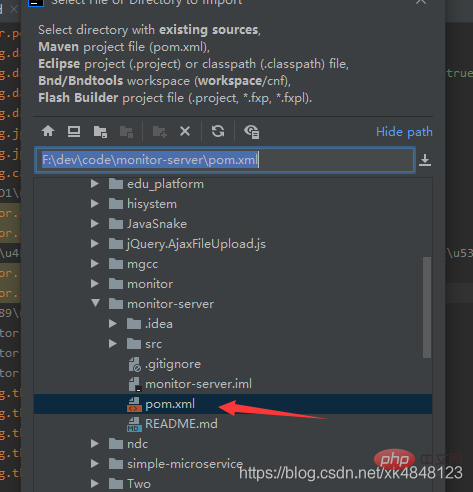
Selected project pom.xml
Modify resources/application.properties
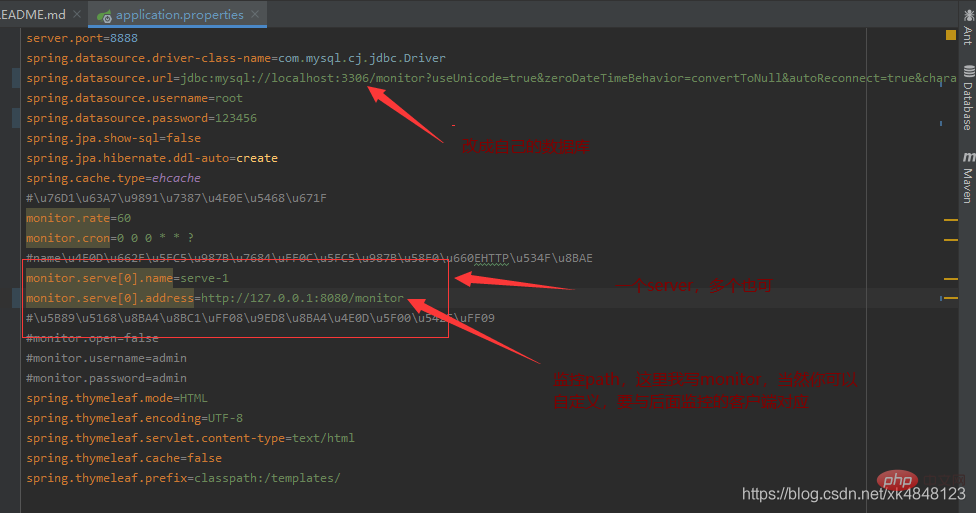
monitor.serve[0].name=serve-1
monitor.serve[0].address=http://127.0.0.1:8081/monitor(这里需要与客户端的monitor.path对应)
monitor.serve[1].name=serve-2
monitor.serve[1].address=http://127.0.0.1:8082(同上)
....
You can configure multiple monitoring hosts here, please pay attention to the format
address=http://ip:port/xxx(xxx is what you configure on the monitor and will be shown below)name=server-1(Each monitor can be different to facilitate differentiation when displaying)
run monitor-server
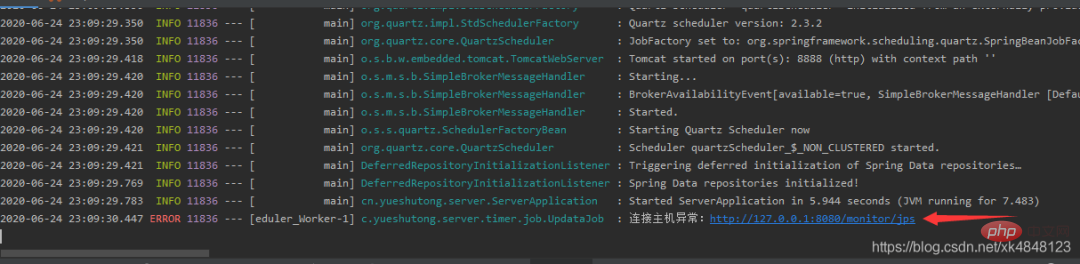
It doesn’t matter if there are exceptions, we can just deploy the monitoring client too
As mentioned before
#Just deploy a monitoring client in an operating system, when you have multiple jvm programs , as long as there is a deployment, you can monitor
DownloadRelease
https://github.com/xk4848123/monitor
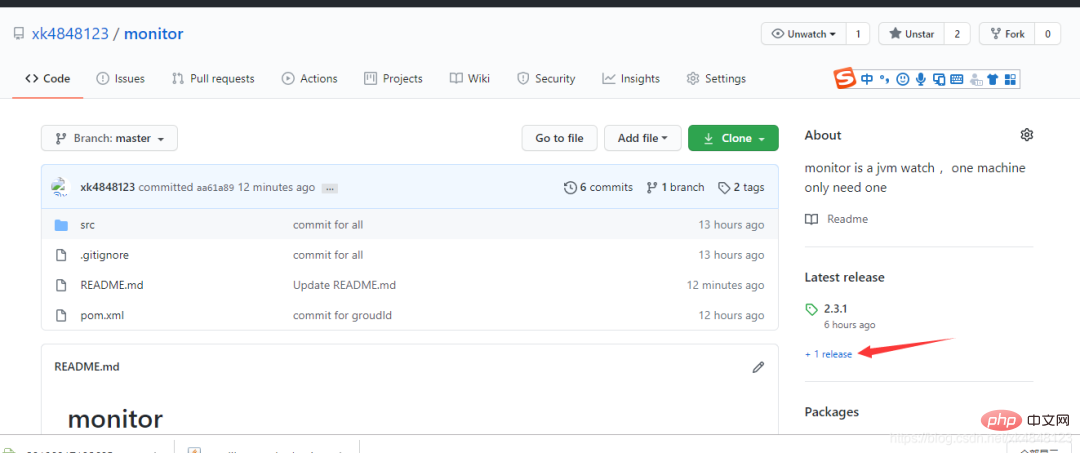
进入Release列表,下载jar
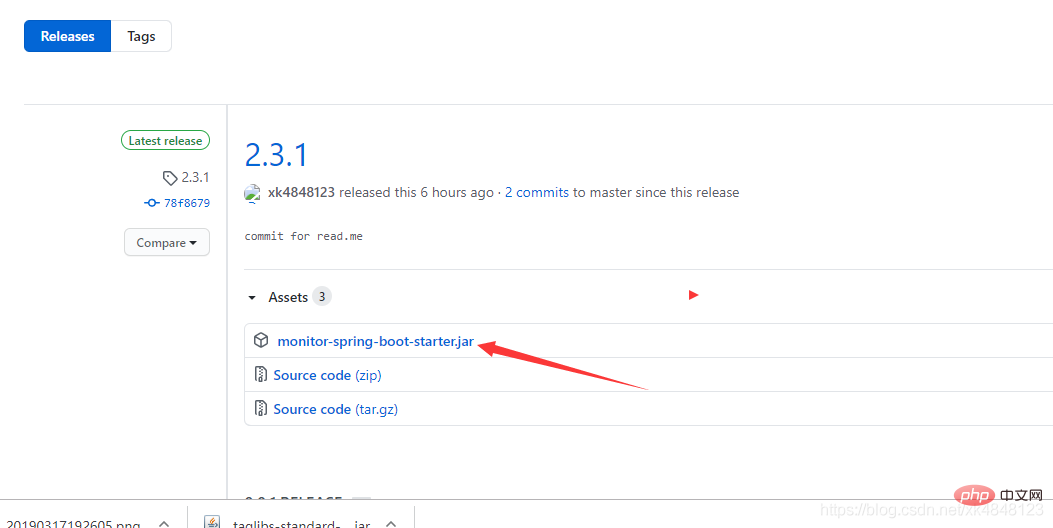
本地mvn install(等到博主把jar传到中心仓库就不用这么么麻烦了)
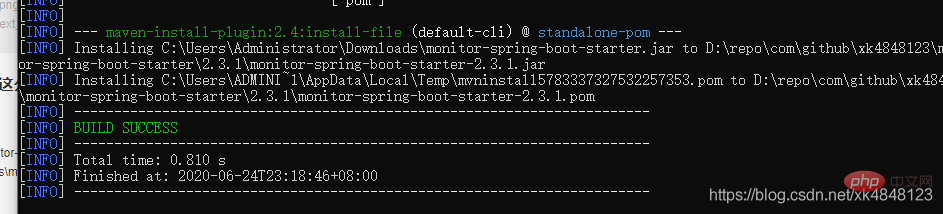
cmd执行以下命令
mvn install:install-file -DgroupId=com.github.xk4848123 -DartifactId=monitor-spring-boot-starter -Dversion=2.3.1 -Dpackaging=jar -Dfile=C:\Users\Administrator\Downloads\monitor-spring-boot-starter.jar
在任意一个Spring boot项目中使用,我这里打开我本地一个叫chat的项目
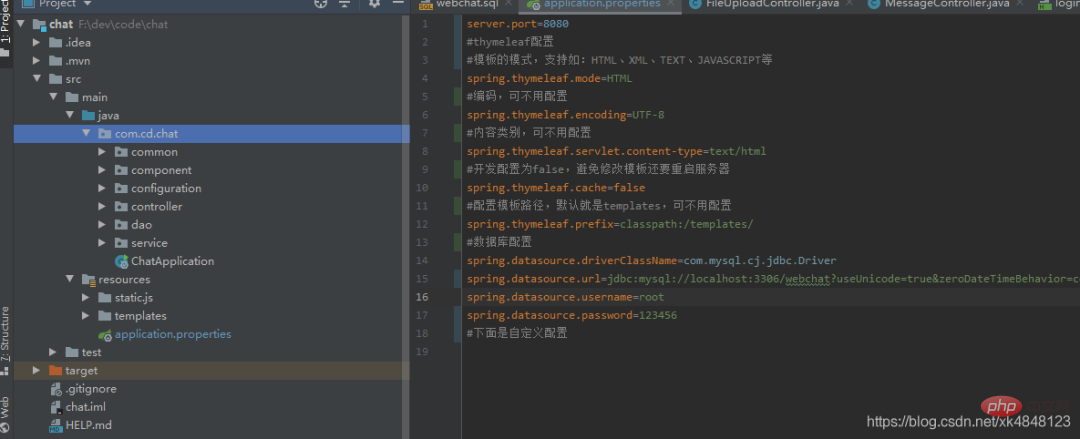
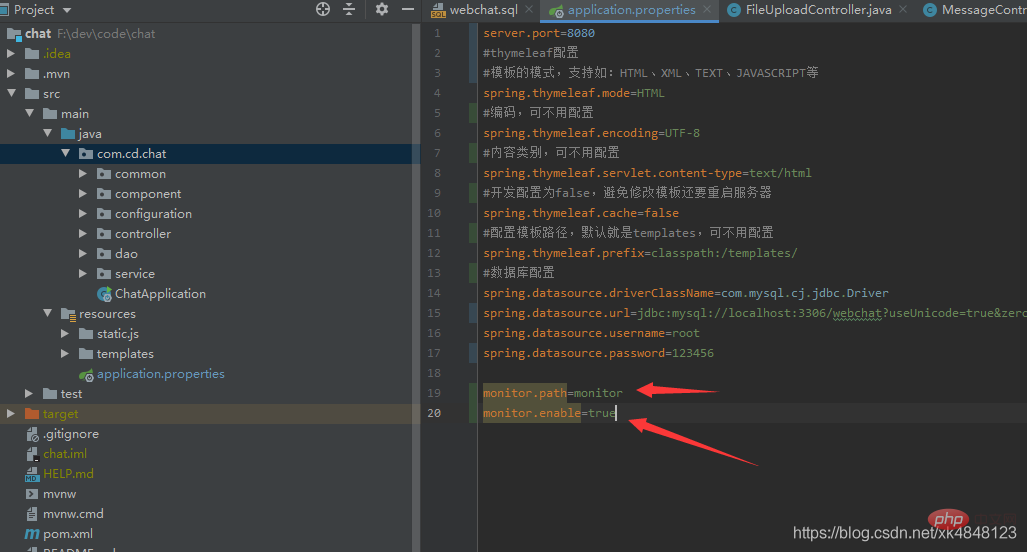
在resources/application.properties增加属性
#决定访问路径,可以自行定义
monitor.path=monitor
#决定是否启动监控客户端
monitor.enable=true
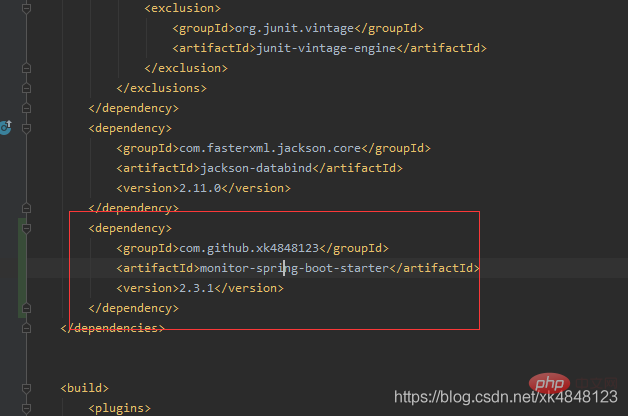
pom.xml引入
跑起项目
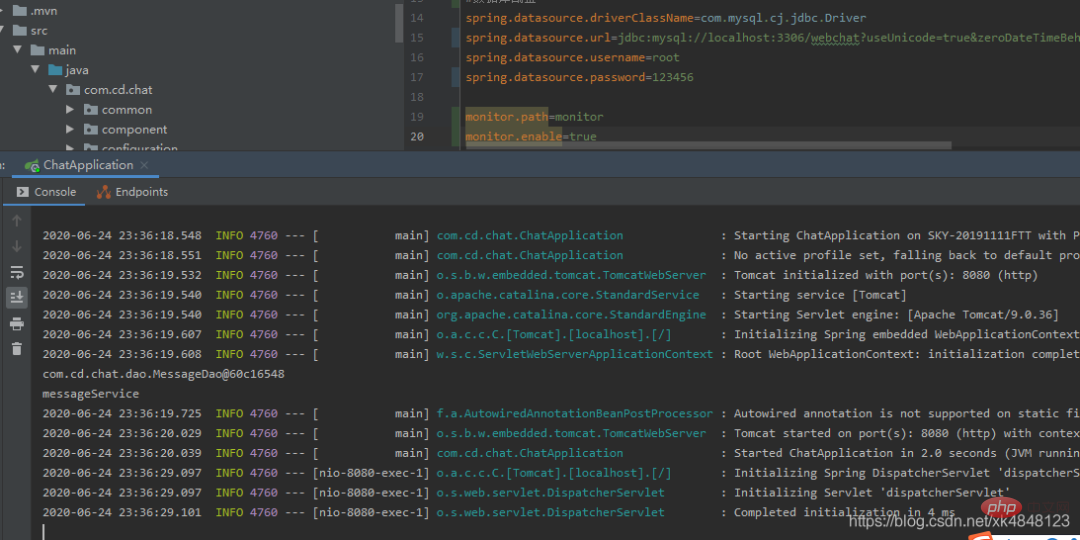
OK!
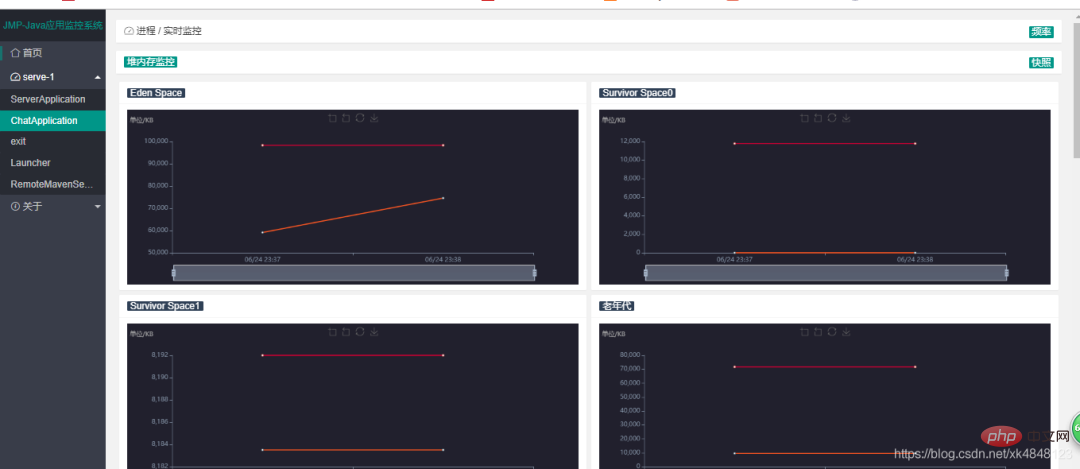
我们现在访问monitor-server(我当下部署的在http://127.0.0.1:8888,大家根据自己的配置访问)
<br/>
The above is the detailed content of A distributed JVM monitoring tool, very practical!. For more information, please follow other related articles on the PHP Chinese website!

Hot AI Tools

Undresser.AI Undress
AI-powered app for creating realistic nude photos

AI Clothes Remover
Online AI tool for removing clothes from photos.

Undress AI Tool
Undress images for free

Clothoff.io
AI clothes remover

AI Hentai Generator
Generate AI Hentai for free.

Hot Article
Hot Tools

Notepad++7.3.1
Easy-to-use and free code editor

SublimeText3 Chinese version
Chinese version, very easy to use

Zend Studio 13.0.1
Powerful PHP integrated development environment

Dreamweaver CS6
Visual web development tools

SublimeText3 Mac version
God-level code editing software (SublimeText3)
Hot Topics
 1377
1377
 52
52

 A distributed JVM monitoring tool, very practical!
Aug 15, 2023 pm 05:15 PM
A distributed JVM monitoring tool, very practical!
Aug 15, 2023 pm 05:15 PM
This project is designed to facilitate developers to monitor multiple remote host JVMs faster. If your project is Spring boot, it is very easy to integrate. Just introduce the jar package. If it is not Spring boot, don’t be discouraged. You can quickly initialize a Spring boot program and introduce it yourself. Jar package is enough
 Detailed explanation of JVM command line parameters: the secret weapon to control JVM operation
May 09, 2024 pm 01:33 PM
Detailed explanation of JVM command line parameters: the secret weapon to control JVM operation
May 09, 2024 pm 01:33 PM
JVM command line parameters allow you to adjust JVM behavior at a fine-grained level. The common parameters include: Set the Java heap size (-Xms, -Xmx) Set the new generation size (-Xmn) Enable the parallel garbage collector (-XX:+UseParallelGC) Reduce the memory usage of the Survivor area (-XX:-ReduceSurvivorSetInMemory) Eliminate redundancy Eliminate garbage collection (-XX:-EliminateRedundantGCs) Print garbage collection information (-XX:+PrintGC) Use the G1 garbage collector (-XX:-UseG1GC) Set the maximum garbage collection pause time (-XX:MaxGCPau
 JVM memory management key points and precautions
Feb 20, 2024 am 10:26 AM
JVM memory management key points and precautions
Feb 20, 2024 am 10:26 AM
Key points and precautions for mastering JVM memory usage JVM (JavaVirtualMachine) is the environment in which Java applications run, and the most important one is the memory management of the JVM. Properly managing JVM memory can not only improve application performance, but also avoid problems such as memory leaks and memory overflows. This article will introduce the key points and considerations of JVM memory usage and provide some specific code examples. JVM memory partitions JVM memory is mainly divided into the following areas: Heap (He
 Analysis of the functions and principles of JVM virtual machine
Feb 22, 2024 pm 01:54 PM
Analysis of the functions and principles of JVM virtual machine
Feb 22, 2024 pm 01:54 PM
An introduction to the analysis of the functions and principles of the JVM virtual machine: The JVM (JavaVirtualMachine) virtual machine is one of the core components of the Java programming language, and it is one of the biggest selling points of Java. The role of the JVM is to compile Java source code into bytecodes and be responsible for executing these bytecodes. This article will introduce the role of JVM and how it works, and provide some code examples to help readers understand better. Function: The main function of JVM is to solve the problem of portability of Java programs on different platforms.
 Java Error: JVM memory overflow error, how to deal with and avoid
Jun 24, 2023 pm 02:19 PM
Java Error: JVM memory overflow error, how to deal with and avoid
Jun 24, 2023 pm 02:19 PM
Java is a popular programming language. During the development of Java applications, you may encounter JVM memory overflow errors. This error usually causes the application to crash, affecting the user experience. This article will explore the causes of JVM memory overflow errors and how to deal with and avoid such errors. What is JVM memory overflow error? The Java Virtual Machine (JVM) is the running environment for Java applications. In the JVM, memory is divided into multiple areas, including heap, method area, stack, etc. The heap is used to store created objects
 Java program to check if JVM is 32-bit or 64-bit
Sep 05, 2023 pm 06:37 PM
Java program to check if JVM is 32-bit or 64-bit
Sep 05, 2023 pm 06:37 PM
Before writing a java program to check whether the JVM is 32-bit or 64-bit, let us first discuss about the JVM. JVM is a java virtual machine, responsible for executing bytecode. It is part of the Java Runtime Environment (JRE). We all know that java is platform independent, but JVM is platform dependent. We need separate JVM for each operating system. If we have the bytecode of any java source code, we can easily run it on any platform due to JVM. The entire process of java file execution is as follows - First, we save the java source code with .java extension and the compiler converts it into bytecode with .class extension. This happens at compile time. Now, at runtime, J
 How to adjust JVM heap memory size efficiently?
Feb 18, 2024 pm 01:39 PM
How to adjust JVM heap memory size efficiently?
Feb 18, 2024 pm 01:39 PM
JVM memory parameter settings: How to reasonably adjust the heap memory size? In Java applications, the JVM is the key component responsible for managing memory. Among them, heap memory is used to store object instances. The size setting of heap memory has an important impact on the performance and stability of the application. This article will introduce how to reasonably adjust the heap memory size, with specific code examples. First, we need to understand some basic knowledge about JVM memory. The JVM's memory is divided into several areas, including heap memory, stack memory, method area, etc. in
 Demystifying the working principle of JVM: In-depth exploration of the principles of Java virtual machine
Feb 18, 2024 pm 12:28 PM
Demystifying the working principle of JVM: In-depth exploration of the principles of Java virtual machine
Feb 18, 2024 pm 12:28 PM
Detailed explanation of JVM principles: In-depth exploration of the working principle of the Java virtual machine requires specific code examples 1. Introduction With the rapid development and widespread application of the Java programming language, the Java Virtual Machine (JavaVirtualMachine, referred to as JVM) has also become indispensable in software development. a part of. As the running environment for Java programs, JVM can provide cross-platform features, allowing Java programs to run on different operating systems. In this article, we will delve into how the JVM works
