
 Backend Development
PHP Tutorial
PHP and Vue.js example tutorial: How to use statistical charts to analyze user behavior data
Backend Development
PHP Tutorial
PHP and Vue.js example tutorial: How to use statistical charts to analyze user behavior data
PHP and Vue.js example tutorial: How to use statistical charts to analyze user behavior data


PHP and Vue.js example tutorial: How to use statistical charts to analyze user behavior data
Introduction:
With the rapid development of the Internet, a large number of user behaviors Data is collected and stored. This data is extremely valuable to businesses and website operators. By analyzing user behavior data, it can help companies understand users' preferences and behavioral habits, thereby optimizing products and services and improving user experience. This tutorial will introduce how to use PHP and Vue.js to build a statistical chart for user behavior data analysis.
- Preparation
Before you start writing code, make sure you have installed the three tools PHP, Vue.js and Chart.js. - Create a PHP file
First, create a file named "index.php", which will serve as our main page.
<!DOCTYPE html>
<html>
<head>
    <title>用户行为数据分析</title>
    <script src="https://cdn.jsdelivr.net/npm/vue/dist/vue.js"></script>
    <script src="https://cdn.jsdelivr.net/npm/chart.js"></script>
</head>
<body>
    <div id="app">
        <canvas id="chart"></canvas>
    </div>

    <script src="app.js"></script>
</body>
</html>In this file, we introduced the libraries of Vue.js and Chart.js, and created a div container with the id "app", which will be used for instantiation of Vue. We also introduced a script file named "app.js" to handle Vue's logic.
- Create a Vue instance
Next, in the new "app.js" file, we will create a Vue instance and initialize some data.
new Vue({
    el: '#app',
    data: {
        chartData: null
    },
    mounted() {
        this.fetchChartData();
    },
    methods: {
        fetchChartData() {
            // 发送请求获取用户行为数据
            axios.get('api.php')
                .then(response => {
                    // 将数据保存到chartData
                    this.chartData = response.data;
                    this.renderChart();
                })
                .catch(error => {
                    console.log(error);
                });
        },
        renderChart() {
            const ctx = document.getElementById('chart').getContext('2d');
            new Chart(ctx, {
                type: 'bar',
                data: {
                    labels: this.chartData.labels,
                    datasets: [{
                        label: '用户行为数据分析',
                        data: this.chartData.data,
                        backgroundColor: 'rgba(75, 192, 192, 0.2)',
                        borderColor: 'rgba(75, 192, 192, 1)',
                        borderWidth: 1
                    }]
                },
                options: {
                    scales: {
                        y: {
                            beginAtZero: true
                        }
                    }
                }
            });
        }
    }
});In this Vue instance, we define a property called "chartData", which will be used to save the user behavior data we obtain from the server. In the mounted hook function, we call the fetchChartData method, which uses the Axios library to send a GET request to the api.php file to obtain user behavior data. Upon success, we save the data into the chartData property and call the renderChart method to render the chart.
- Create a PHP API
Now, we need to create a PHP file named "api.php" to process requests sent by the front end and return user behavior data.
<?php
// 连接到数据库并查询用户行为数据
$conn = new PDO("mysql:host=localhost;dbname=your_database_name", "your_username", "your_password");
$statement = $conn->prepare("SELECT action, COUNT(*) as count FROM user_actions GROUP BY action");
$statement->execute();

// 获取查询结果
$results = $statement->fetchAll(PDO::FETCH_ASSOC);

// 构建用于返回给前端的数据
$data = [
    'labels' => [],
    'data' => []
];
foreach($results as $row) {
    $data['labels'][] = $row['action'];
    $data['data'][] = $row['count'];
}

// 返回数据
header('Content-Type: application/json');
echo json_encode($data);
?>In this PHP file, we first connect to the database and query user behavior data. Here we assume that our user behavior data is stored in a table named "user_actions", which contains a column named "action" for recording user behavior. We use PDO to execute the query and store the results in the $results array. Next, we build a data array for returning to the front end, iterate through the query results, and save the behavior and corresponding quantity into the "labels" and "data" arrays respectively. Finally, we set the Content-Type header and return the data to the front end in JSON format.
- Running the Application
Now, we can run our application. Upload these files on your web server and access the "index.php" page in your browser. If everything is fine, you will see a statistical chart showing user behavior data.
Conclusion:
Through this tutorial, we learned how to use PHP and Vue.js to build a statistical chart for user behavior data analysis. By analyzing user behavior data, we can gain valuable insights that help us optimize our products and services. I hope it will be helpful to you and further explore the value of user data.
The above is the detailed content of PHP and Vue.js example tutorial: How to use statistical charts to analyze user behavior data. For more information, please follow other related articles on the PHP Chinese website!

Hot AI Tools

Undresser.AI Undress
AI-powered app for creating realistic nude photos

AI Clothes Remover
Online AI tool for removing clothes from photos.

Undress AI Tool
Undress images for free

Clothoff.io
AI clothes remover

AI Hentai Generator
Generate AI Hentai for free.

Hot Article
Hot Tools

Notepad++7.3.1
Easy-to-use and free code editor

SublimeText3 Chinese version
Chinese version, very easy to use

Zend Studio 13.0.1
Powerful PHP integrated development environment

Dreamweaver CS6
Visual web development tools

SublimeText3 Mac version
God-level code editing software (SublimeText3)
Hot Topics
 1377
1377
 52
52

 PHP 8.4 Installation and Upgrade guide for Ubuntu and Debian
Dec 24, 2024 pm 04:42 PM
PHP 8.4 Installation and Upgrade guide for Ubuntu and Debian
Dec 24, 2024 pm 04:42 PM
PHP 8.4 brings several new features, security improvements, and performance improvements with healthy amounts of feature deprecations and removals. This guide explains how to install PHP 8.4 or upgrade to PHP 8.4 on Ubuntu, Debian, or their derivati
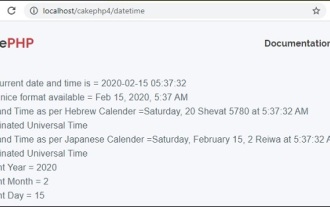 CakePHP Date and Time
Sep 10, 2024 pm 05:27 PM
CakePHP Date and Time
Sep 10, 2024 pm 05:27 PM
To work with date and time in cakephp4, we are going to make use of the available FrozenTime class.
 Discuss CakePHP
Sep 10, 2024 pm 05:28 PM
Discuss CakePHP
Sep 10, 2024 pm 05:28 PM
CakePHP is an open-source framework for PHP. It is intended to make developing, deploying and maintaining applications much easier. CakePHP is based on a MVC-like architecture that is both powerful and easy to grasp. Models, Views, and Controllers gu
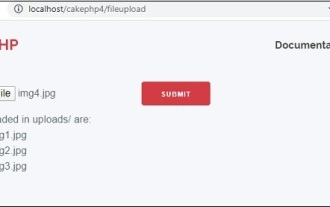 CakePHP File upload
Sep 10, 2024 pm 05:27 PM
CakePHP File upload
Sep 10, 2024 pm 05:27 PM
To work on file upload we are going to use the form helper. Here, is an example for file upload.
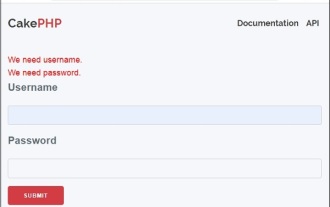 CakePHP Creating Validators
Sep 10, 2024 pm 05:26 PM
CakePHP Creating Validators
Sep 10, 2024 pm 05:26 PM
Validator can be created by adding the following two lines in the controller.
 How To Set Up Visual Studio Code (VS Code) for PHP Development
Dec 20, 2024 am 11:31 AM
How To Set Up Visual Studio Code (VS Code) for PHP Development
Dec 20, 2024 am 11:31 AM
Visual Studio Code, also known as VS Code, is a free source code editor — or integrated development environment (IDE) — available for all major operating systems. With a large collection of extensions for many programming languages, VS Code can be c
 CakePHP Quick Guide
Sep 10, 2024 pm 05:27 PM
CakePHP Quick Guide
Sep 10, 2024 pm 05:27 PM
CakePHP is an open source MVC framework. It makes developing, deploying and maintaining applications much easier. CakePHP has a number of libraries to reduce the overload of most common tasks.
 How do you parse and process HTML/XML in PHP?
Feb 07, 2025 am 11:57 AM
How do you parse and process HTML/XML in PHP?
Feb 07, 2025 am 11:57 AM
This tutorial demonstrates how to efficiently process XML documents using PHP. XML (eXtensible Markup Language) is a versatile text-based markup language designed for both human readability and machine parsing. It's commonly used for data storage an
