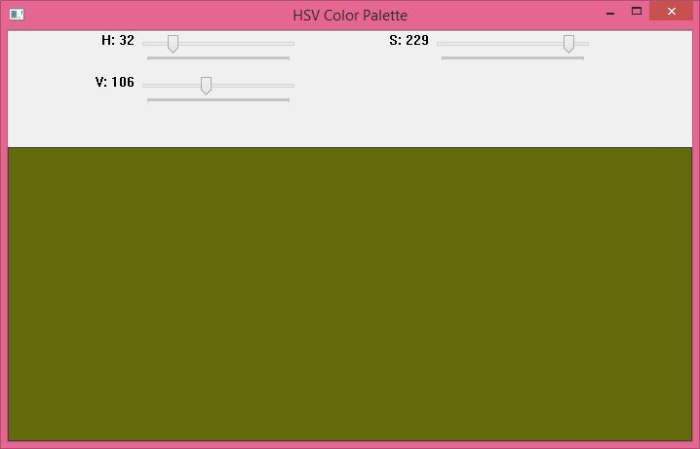
To create a slider for the HSV (Hue, Saturation and Value) color palette in OpenCV we use two different functions. These functions are cv2.reateTrackbar() and cv2.getTrackbarPos().
Use the cv2.reateTrackbar() function to create the slider, while the cv2.getTrackbarPos() function is used to access the selected slider position value.
Using these two functions, we create a slider containing H, S, V colors and a color window to display the selected color. By changing the position of the slider, we can select a specific color value.
H ranges from 0 to 179, while S and # The range of ##V is between 0 and 255.
cv2.createTrackbar(trackbar_name, window_name, default_value, max_value, callback_func)
cv2.getTrackbarPos(trackbar_name, window_name)
− This is the name of the slider bar. This name is used to access the slider's position value.
− It is the name of the window attached to the slider.
− Set the default value of the slider.
− Maximum value of the slider.
− Function executed when the value of the slider changes.
, you can follow these steps: The first step is to import the required libraries. The required Python libraries are
OpenCV and NumPy. Please make sure you have them installed. import cv2
import numpy as np
. It takes the slider position as a default parameter. We define this function to do nothing. def nothing(x):
pass
. Track bars and colors will appear in this window. img = np.zeros((300,650,3), np.uint8)
window_name = 'Trackbar Color Palette'
cv2.namedWindow(window_name, cv2.WINDOW_AUTOSIZE)
cv2.createTrackbar('H',window_name,0,179,nothing) cv2.createTrackbar('S',window_name,0,255,nothing) cv2.createTrackbar('V',window_name,0,255,nothing)
Get the current slider position for all three
HSV colors. h = cv2.getTrackbarPos('H',window_name)
s = cv2.getTrackbarPos('S',window_name)
v = cv2.getTrackbarPos('V',window_name)
. img[:] = [h,s,v]
img = cv2.cvtColor(img, cv2.COLOR_HSV2BGR)
while(True):
cv2.imshow(window_name,img)
k = cv2.waitKey(1) & 0xFF
if k == ord('q'):
breakExample 1
# import required libraries
import cv2
import numpy as np
def nothing(x):
   pass
# Create a black image, a window
img = np.zeros((300,650,3), np.uint8)
img = cv2.cvtColor(img, cv2.COLOR_BGR2HSV)
window_name = 'HSV Color Palette'
cv2.namedWindow(window_name, cv2.WINDOW_AUTOSIZE)
# create trackbars for color change
cv2.createTrackbar('H',window_name,0,179,nothing)
cv2.createTrackbar('S',window_name,0,255,nothing)
cv2.createTrackbar('V',window_name,0,255,nothing)
while(True):
cv2.imshow(window_name,img)
key = cv2.waitKey(1) & 0xFF
if key == ord('q'):
break
# get current positions of four trackbars
h = cv2.getTrackbarPos('H',window_name)
s = cv2.getTrackbarPos('S',window_name)
v = cv2.getTrackbarPos('V',window_name)
img[:] = [h,s,v]
img = cv2.cvtColor(img, cv2.COLOR_HSV2BGR)
cv2.destroyAllWindows()Output
’ button.
 By default, the values of the three sliders are
, and the color of the window is black. Slide the slider and you will see the corresponding color in the color window. The Chinese translation of Example 2
Example 2
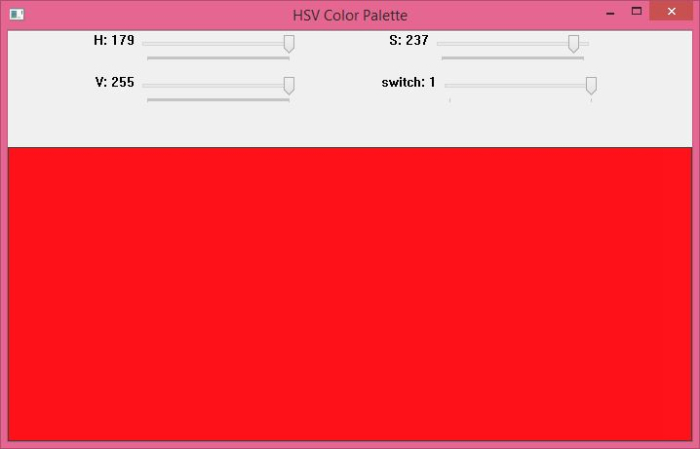
Color palette, which contains a switch button. We created four sliders, three for the HSV color and one for the switch button. When the
switch button is turned on , only the colors in the color image are displayed. Slide the slider and you will get the corresponding color display in the color window. ’ button. . The color of the window is black. When you turn the switch on (selected as 1) and slide the HSV color slider to the desired value, the color of the window will correspond to the set value. For bright colors, select the maximum value for the S and V sliders, and slide the H slider. When the switch is off, sliding the slider will not change anything If you slide the slider when the switch is off (set to 0), then the color of the window will not change. It will remain as is (i.e. black). The above is the detailed content of How to create a slider of HSV color palette using OpenCV Python?. For more information, please follow other related articles on the PHP Chinese website!import cv2
import numpy as np
def nothing(x):
pass
# Create a black image, a window
img = np.zeros((300,650,3), np.uint8)
img = cv2.cvtColor(img, cv2.COLOR_BGR2HSV)
window_name = 'HSV Color Palette'
cv2.namedWindow(window_name, cv2.WINDOW_AUTOSIZE)
# create trackbars for color change
cv2.createTrackbar('H',window_name,0,179,nothing)
cv2.createTrackbar('S',window_name,0,255,nothing)
cv2.createTrackbar('V',window_name,0,255,nothing)
# create switch for ON/OFF functionality
# switch = '0 : OFF \n1 : ON'
cv2.createTrackbar('switch', window_name,0,1,nothing)
while(True):
cv2.imshow(window_name,img)
key = cv2.waitKey(1) & 0xFF
if key == ord('q'):
break
# get current positions of four trackbars
h = cv2.getTrackbarPos('H',window_name)
s = cv2.getTrackbarPos('S',window_name)
v = cv2.getTrackbarPos('V',window_name)
sw = cv2.getTrackbarPos('switch',window_name)
if sw == 0:
img[:] = 0
else:
img[:] = [h,s,v]
img = cv2.cvtColor(img, cv2.COLOR_HSV2BGR)
cv2.destroyAllWindows()When you run the above program, it will display the following output window. To close the output window, press the ‘
q
 By default, the value of all sliders is
 What are the common management systems?
 mintui
 Which version of linux system is easy to use?
 What to do if an error occurs in the script of the current page
 What are the requirements for Douyin live broadcast?
 Why can't I open pinterest?
 Introduction to Document in JS
 What is the format of the account name of steam
 What are the enterprise erp systems?


