
 Backend Development
PHP Tutorial
PHP and Vue.js Development Guide: How to Apply Statistical Charts in Data-Intensive Applications
Backend Development
PHP Tutorial
PHP and Vue.js Development Guide: How to Apply Statistical Charts in Data-Intensive Applications
PHP and Vue.js Development Guide: How to Apply Statistical Charts in Data-Intensive Applications


PHP and Vue.js Development Guide: How to apply statistical charts in data-intensive applications
Introduction: In data-intensive applications, statistical charts are very important way of displaying data. This article will introduce how to use PHP and Vue.js to develop an application that supports statistical charts, and provide code examples.
1. Introduction
Statistical charts are an effective way to present large amounts of data and help users better understand and analyze the data. In data-intensive applications, how to apply statistical charts becomes an important issue. This article will use PHP and Vue.js to implement an application that supports statistical charts to help readers understand how to apply statistical charts in actual development.
2. Technical preparation
Before you start, you need to make sure you have installed the following software and components:
- PHP 5.6 or higher
- Apache server or other web server that supports PHP
- Vue.js (version 2.x)
- Chart.js
3. Create a project
First, create a new directory to store project files. Create the following files in this directory:
- index.php - used to load Vue.js and Chart.js, and provide data interface
- app.js - Vue.js Application logic
- chart.vue - Vue.js component, used to display statistical charts
The following is the basic structure of index.php:
<!DOCTYPE html>
<html>
<head>
    <title>统计图表应用</title>
    <script src="https://cdn.jsdelivr.net/npm/vue/dist/vue.js"></script>
    <script src="https://cdn.jsdelivr.net/npm/chart.js"></script>
    <script src="app.js"></script>
</head>
<body>
    <div id="app">
        <chart></chart> <!-- Vue.js组件 -->
    </div>
</body>
</html>Next , create the app.js file, and write the application logic of Vue.js. The code is as follows:
// app.js
Vue.component('chart', {
    template: '<canvas id="myChart"></canvas>', // 用于展示统计图表的canvas
    mounted: function () {
        this.renderChart(); // 绘制统计图表
    },
    methods: {
        renderChart: function () {
            // 使用Chart.js绘制统计图表
            var ctx = this.$el.getContext('2d');
            new Chart(ctx, {
                type: 'bar', // 柱状图
                data: {
                    labels: ['2019-01', '2019-02', '2019-03'], // X轴数据
                    datasets: [{
                        label: '销售额', // 数据标签
                        data: [150, 200, 100] // Y轴数据
                    }]
                }
            });
        }
    }
});

new Vue({
    el: '#app'
});Finally, create the chart.vue file and write the component logic of Vue.js. The code is as follows:
<template>
    <canvas id="myChart"></canvas>
</template>

<script>
export default {
    mounted() {
        this.renderChart();
    },
    methods: {
        renderChart() {
            var ctx = this.$el.getContext('2d');
            new Chart(ctx, {
                type: 'bar',
                data: {
                    labels: ['2019-01', '2019-02', '2019-03'],
                    datasets: [{
                        label: '销售额',
                        data: [150, 200, 100]
                    }]
                }
            });
        }
    }
}
</script>

<style scoped>
canvas {
    width: 500px;
    height: 300px;
}
</style>4. Run the project
Put the above three files into the created project directory and start the PHP server. Then access index.php in the browser to see the application interface containing statistical charts.
5. Summary
Through the introduction of this article, we have learned how to use PHP and Vue.js to apply statistical charts in data-intensive applications. Through the code examples provided in this article, readers can better understand how to implement the display and interaction logic of statistical charts. I hope this article will be helpful to readers in applying statistical charts in data-intensive application development.
The above is the detailed content of PHP and Vue.js Development Guide: How to Apply Statistical Charts in Data-Intensive Applications. For more information, please follow other related articles on the PHP Chinese website!

Hot AI Tools

Undresser.AI Undress
AI-powered app for creating realistic nude photos

AI Clothes Remover
Online AI tool for removing clothes from photos.

Undress AI Tool
Undress images for free

Clothoff.io
AI clothes remover

AI Hentai Generator
Generate AI Hentai for free.

Hot Article
Hot Tools

Notepad++7.3.1
Easy-to-use and free code editor

SublimeText3 Chinese version
Chinese version, very easy to use

Zend Studio 13.0.1
Powerful PHP integrated development environment

Dreamweaver CS6
Visual web development tools

SublimeText3 Mac version
God-level code editing software (SublimeText3)
Hot Topics


 CakePHP Project Configuration
Sep 10, 2024 pm 05:25 PM
CakePHP Project Configuration
Sep 10, 2024 pm 05:25 PM
In this chapter, we will understand the Environment Variables, General Configuration, Database Configuration and Email Configuration in CakePHP.
 PHP 8.4 Installation and Upgrade guide for Ubuntu and Debian
Dec 24, 2024 pm 04:42 PM
PHP 8.4 Installation and Upgrade guide for Ubuntu and Debian
Dec 24, 2024 pm 04:42 PM
PHP 8.4 brings several new features, security improvements, and performance improvements with healthy amounts of feature deprecations and removals. This guide explains how to install PHP 8.4 or upgrade to PHP 8.4 on Ubuntu, Debian, or their derivati
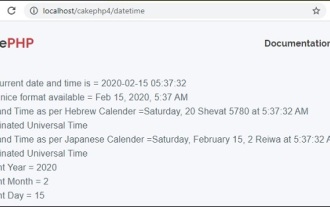 CakePHP Date and Time
Sep 10, 2024 pm 05:27 PM
CakePHP Date and Time
Sep 10, 2024 pm 05:27 PM
To work with date and time in cakephp4, we are going to make use of the available FrozenTime class.
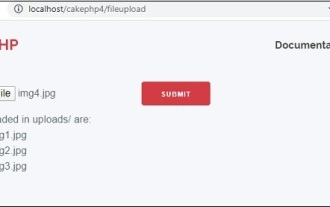 CakePHP File upload
Sep 10, 2024 pm 05:27 PM
CakePHP File upload
Sep 10, 2024 pm 05:27 PM
To work on file upload we are going to use the form helper. Here, is an example for file upload.
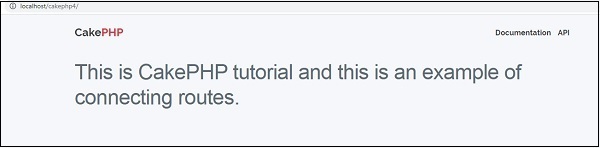 CakePHP Routing
Sep 10, 2024 pm 05:25 PM
CakePHP Routing
Sep 10, 2024 pm 05:25 PM
In this chapter, we are going to learn the following topics related to routing ?
 Discuss CakePHP
Sep 10, 2024 pm 05:28 PM
Discuss CakePHP
Sep 10, 2024 pm 05:28 PM
CakePHP is an open-source framework for PHP. It is intended to make developing, deploying and maintaining applications much easier. CakePHP is based on a MVC-like architecture that is both powerful and easy to grasp. Models, Views, and Controllers gu
 CakePHP Creating Validators
Sep 10, 2024 pm 05:26 PM
CakePHP Creating Validators
Sep 10, 2024 pm 05:26 PM
Validator can be created by adding the following two lines in the controller.
 How To Set Up Visual Studio Code (VS Code) for PHP Development
Dec 20, 2024 am 11:31 AM
How To Set Up Visual Studio Code (VS Code) for PHP Development
Dec 20, 2024 am 11:31 AM
Visual Studio Code, also known as VS Code, is a free source code editor — or integrated development environment (IDE) — available for all major operating systems. With a large collection of extensions for many programming languages, VS Code can be c
