
 Backend Development
Python Tutorial
How to add text to heat map cell comments using seaborn in Python?
Backend Development
Python Tutorial
How to add text to heat map cell comments using seaborn in Python?
How to add text to heat map cell comments using seaborn in Python?

Heat maps are useful for identifying patterns and trends in your data, and can be further customized by adding annotations to cells, such as text labels or numerical values, which can provide additional information about the data. In this article, we will discuss how to add text to heat map cell comments using Seaborn in Python. We will explore the different methods and options available in Seaborn to customize text annotations, such as changing the font size, color, and formatting of the text.
Heat map
A heat map (or heat map) is a data visualization method that represents the intensity of a phenomenon by using different colors on a two-dimensional plot. Colors may vary in hue or saturation to show the reader how phenomena cluster or vary over time and space. Heat maps are mainly divided into two categories: cluster heat maps and spatial heat maps.
Cluster heatmaps display phenomena and categories as rows and columns, organized in size by a fixed-size cell matrix. The ordering of clusters is intentional and somewhat random and is intended to be suggested or revealed through statistical studies. The size of the cells is completely random, but large enough to be readable. There is no concept of units in a spatial heat map, the phenomenon is seen as constantly changing, so the location of the size depends on its location in that space.
The Chinese translation ofSeaborn
is:Seaborn
Seaborn is a Python package for making charts and graphs from data. It is based on matplotlib and works well with the pandas library.
Seaborn helps with data discovery, visualization and understanding. Generate insightful charts by using plotting methods to process data frames and arrays containing complete datasets and perform the necessary semantic mapping and statistical aggregation. With its declarative, dataset-centric API, you can focus on the meaning of chart components rather than the technical details of rendering them.
Syntax for drawing heat maps using seaborn
sns.heatmap(dt, *, vmin=None, vmax=None, cmap=None, center=None, annot_kws=None, linewidths=0, linecolor=’white’, cbar=True, **kwargs)
Explanation
Translated into Chinese:Explanation
Serial number |
Attributes |
definition |
|---|---|---|
1. |
dt |
It is used to convert 2D dataset to ndarray. If a DataFrame using pandas is provided, the rows and columns can be specified using column data. |
2. |
vamx and vmin |
They provide the values used as starting points for the colormap. If not provided, the values will be inferred from the data and other keyword arguments. |
3. |
cmap |
It defines how data values are mapped to color space. If no default value is specified, it will depend on whether the center value is set. |
4. |
center |
This is the center value used to set the color map when plotting different data sets. If no other parameters are given, this parameter will change the default color map. |
5. |
annot |
If the value of the annot parameter is true, data is written to each heat map cell. |
6. |
annot_kws |
Only when the value of the annot parameter is true, it defines the parameters of the function matplotlib.axes.Axes.text(). |
7. |
linewidhts |
This parameter defines the width of the dividing line between each cell. |
8. |
linecolor |
This parameter defines the color of the dividing line between each cell. |
9. |
cbar |
It defines whether we need to draw a color bar. |
在热力图单元格注释中添加文本
热力图的行和列可以进行注释以提供额外的上下文。通常将annot选项设置为True以在热力图的顶部显示数据值。
Annot and fmt parameter
的中文翻译为:Annot和fmt参数
Annot − sns.heatmap() 的 annot(注释)功能允许您在 Python seaborn 热力图中显示与每个单元格关联的数值。我们可以显示所选单元格的原始数字,或根据您的指示显示不同的数字。将 True 传递给 annot 将导致在每个热力图单元格中显示该值。
Fmt − annot参数仅允许将数值添加到Python热力图单元格中,而fmt参数允许添加字符串(文本)值。
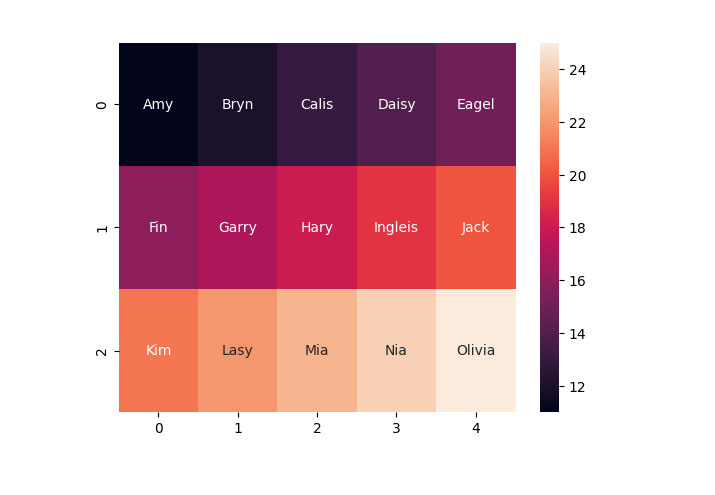
在这里,创建了一个包含字符串值的2D numpy数组,并将其传递给annot。另外,字符串值"s"被传递给fmt。
Example
的中文翻译为:示例
import numpy as n
import matplotlib.pyplot as p
import seaborn as s

# creating random data using numpy
df = n.array([[11, 12, 13, 14, 15], [16, 17, 18, 19, 20], [21, 22, 23, 24, 25]])

# creating text array using numpy
tx = n.array([['Amy', 'Bryn', 'Calis', 'Daisy', 'Eagel'], ['Fin', 'Garry', 'Hary', 'Ingleis', 'Jack'],
   ['Kim', 'Lasy', 'Mia', 'Nia', 'Olivia']])

# creating subplot
figure, axx = p.subplots()

# defining heatmap on current axes using seaborn
axx = s.heatmap(df, annot=tx, fmt="")
输出
结论
在本文中,我们了解到热力图可以在二维图表中显示现象的大小,并可用于数据可视化。我们已经看到了如何使用Python的Seaborn库来定义热力图,以及定义热力图的语法和参数。最后,我们还了解了如何使用属性annot和fmt来在热力图的单元格注释中添加文本。
The above is the detailed content of How to add text to heat map cell comments using seaborn in Python?. For more information, please follow other related articles on the PHP Chinese website!

Hot AI Tools

Undresser.AI Undress
AI-powered app for creating realistic nude photos

AI Clothes Remover
Online AI tool for removing clothes from photos.

Undress AI Tool
Undress images for free

Clothoff.io
AI clothes remover

AI Hentai Generator
Generate AI Hentai for free.

Hot Article
Hot Tools

Notepad++7.3.1
Easy-to-use and free code editor

SublimeText3 Chinese version
Chinese version, very easy to use

Zend Studio 13.0.1
Powerful PHP integrated development environment

Dreamweaver CS6
Visual web development tools

SublimeText3 Mac version
God-level code editing software (SublimeText3)
Hot Topics
 1378
1378
 52
52

 How to add text to heat map cell comments using seaborn in Python?
Aug 19, 2023 pm 04:09 PM
How to add text to heat map cell comments using seaborn in Python?
Aug 19, 2023 pm 04:09 PM
Heat maps are useful for identifying patterns and trends in your data, and can be further customized by adding annotations to cells, such as text labels or numerical values, which can provide additional information about the data. In this article, we will discuss how to add text to heat map cell comments using Seaborn in Python. We will explore the different methods and options available in Seaborn to customize text annotations, such as changing the font size, color, and formatting of the text. Heat Maps A heat map (or heat map) is a data visualization method that uses different colors on a two-dimensional plot to represent the intensity of a phenomenon. Colors may vary in hue or saturation to show the reader how phenomena cluster or vary over time and space. The main points of heat map
 How to draw a heat map using ECharts in Python
Dec 17, 2023 am 10:17 AM
How to draw a heat map using ECharts in Python
Dec 17, 2023 am 10:17 AM
How to use ECharts to draw a heat map in Python. A heat map is a visual way to display data changes based on color depth. It is widely used in scenarios such as hotspot density, trend and correlation analysis. In Python, we can use the ECharts library to draw heat maps and demonstrate its use through specific code examples. ECharts is a powerful data visualization library that supports multiple chart types, including heat maps. Before we begin, we first need to install the ECharts library.
 How to use JS and Baidu Maps to implement map heat map function
Nov 21, 2023 am 09:33 AM
How to use JS and Baidu Maps to implement map heat map function
Nov 21, 2023 am 09:33 AM
How to use JS and Baidu Maps to implement the map heat map function Introduction: With the rapid development of the Internet and mobile devices, maps have become a common application scenario. As a visual display method, heat maps can help us understand the distribution of data more intuitively. This article will introduce how to use JS and Baidu Map API to implement the map heat map function, and provide specific code examples. Preparation work: Before starting, you need to prepare the following items: a Baidu developer account, create an application, and obtain the corresponding AP
 How to create a map heat map using Highcharts
Dec 17, 2023 pm 04:06 PM
How to create a map heat map using Highcharts
Dec 17, 2023 pm 04:06 PM
How to use Highcharts to create a map heat map requires specific code examples. A heat map is a visual data display method that can represent the data distribution in each area through different color shades. In the field of data visualization, Highcharts is a very popular JavaScript library that provides rich chart types and interactive functions. This article will introduce how to use Highcharts to create a map heat map and provide specific code examples. First, we need to prepare some data
 Where is the heat map function of Amap?
Feb 27, 2024 pm 05:40 PM
Where is the heat map function of Amap?
Feb 27, 2024 pm 05:40 PM
When using Amap software, users can choose from a variety of map views to assist navigation. This requires the use of the heat map function in Amap. However, many users recently found that the heat map is no longer in its original position during the navigation process of Amap, making many users wonder whether this function has been used. Cancel, then the editor of this site will bring you this detailed tutorial guide to introduce how to open the heat map function in the new version of Amap. Users who want to know more about it can follow this article to learn more. ! How to open the heat map of Amap? Answer: [Amap] - [Layer] - [Weather Map]. Specific steps: 1. First open the Amap software and enter the home page. We can see notifications, layers,
 Detailed explanation of seaborn, a data visualization library in Python
Jun 10, 2023 am 11:25 AM
Detailed explanation of seaborn, a data visualization library in Python
Jun 10, 2023 am 11:25 AM
Detailed explanation of the data visualization library seaborn in Python In the field of data science, data visualization is an extremely important skill. As a versatile language, Python has become the first choice of many data scientists. There are many visualization libraries in Python, one of the popular ones is seaborn. seaborn is a Python advanced data visualization library developed based on the matplotlib library. It provides a more beautiful and simple visual interface, suitable for complex data processing
 Implementation of heat map function of Vue statistical chart
Aug 26, 2023 am 09:40 AM
Implementation of heat map function of Vue statistical chart
Aug 26, 2023 am 09:40 AM
Implementation of the heat map function of Vue statistical charts Heat map is a commonly used data visualization tool, which can visually display the degree of data concentration. Under the Vue framework, we can easily implement the heat map function by using third-party libraries. This article will introduce how to use Vue and the heat library to create a simple heat map. Step 1: Install dependencies First, we need to install a thermal library in the Vue project. Run the following command from the command line to install the library: npminstallvue-heatm
 How to implement interactive heat map statistics in PHP and Vue.js
Aug 19, 2023 am 09:41 AM
How to implement interactive heat map statistics in PHP and Vue.js
Aug 19, 2023 am 09:41 AM
How to implement interactive heat map statistics in PHP and Vue.js Heat map (Heatmap) is a visual way to display the distribution and concentration of data in the form of a heat map. In web development, it is often necessary to combine back-end data and front-end display to implement interactive heat map statistical functions. This article will introduce how to implement this functionality in PHP and Vue.js, and provide corresponding code examples. Step 1: Preparation of back-end data First, we need to prepare the data for generating heat maps. In PHP, I
