
 Java
JavaInterview questions
Interview with a certain group: If you encounter OOM online, how should you troubleshoot it? How to solve? What options?
Java
JavaInterview questions
Interview with a certain group: If you encounter OOM online, how should you troubleshoot it? How to solve? What options?
Interview with a certain group: If you encounter OOM online, how should you troubleshoot it? How to solve? What options?
OOM means that there is a vulnerability in the program, which may be caused by the code or JVM parameter configuration. This article talks to readers about how to troubleshoot when a Java process triggers OOM.
It is often said to be in awe of the production environment, and solving problems quickly is also a sign of awe
Why OOM
OOM stands for "Out Of Memory", which means the memory is exhausted. When the JVM does not have enough memory to allocate space for the object, and the garbage collector has no space to recycle, it will throw this error
Why does OOM occur? It is generally caused by these problems
Too little allocation: The JVM initialization memory is small and the business uses a lot of memory; or the memory allocation in different JVM areas is unreasonable Code vulnerability: a certain object Frequently applied for but not released after no use, resulting in memory exhaustion
Memory leak: The memory used after application is not released, causing the virtual machine to be unable to be used again Using this memory, this memory is leaked. Because the applicant is no longer in use and cannot be allocated to others by the virtual machine
Memory overflow: The requested memory exceeds the memory size that the JVM can provide. This is called an overflow
Memory leaks persist and will eventually overflow. The two are causally related
Common OOM
Relatively common The OOM types are as follows
java.lang.OutOfMemoryError: PermGen space
Java7 permanent generation (method area) overflow, which is used to store what has been loaded by the virtual machine Class information, constants, static variables, code compiled by the just-in-time compiler and other data. Whenever a class is loaded for the first time, metadata will be stored in the permanent generation
Generally appears in a large number of Class objects or JSP pages, or the use of CgLib dynamic proxy technology causes
We can modify the size of the method area through -XX: PermSize and -XX: MaxPermSize
Java8 changes the permanent generation to metaspace and reports an error :java.lang.OutOfMemoryError: Metadata space, the metaspace memory is insufficient and dynamically expanded by default
java.lang.StackOverflowError
Virtual machine stack Overflow is generally caused by the existence of an infinite loop or deep recursive call in the program. If the stack size is set too small, overflow will occur. You can set the stack size through -Xss
The virtual machine throws a stack overflow error, and you can locate the wrong class and method in the log.
java.lang.OutOfMemoryError: Java heap space
Java heap memory overflow, the cause of overflow is generally due to unreasonable JVM heap memory settings or Memory leaks lead to
If there is a memory leak, you can use tools to view the reference chain from the leaked object to GC Roots. By mastering the type information of the leaked object and the GC Roots reference chain information, you can accurately locate the location of the leaked code
If there is no memory leak, that is, the objects in the memory must still be alive, then You should check the heap parameters of the virtual machine (-Xmx and -Xms) to see if the memory of the virtual machine can be increased.
Summary: The overflow scenario of the method area and the virtual machine stack will not be discussed too much in this article. The following mainly explains the common OOM troubleshooting ideas of Java heap space
View JVM memory distribution
Assume that our Java application PID is 15162, enter the command Check JVM memory distributionjmap -heap 15162
[xxx@xxx ~]# jmap -heap 15162
Attaching to process ID 15162, please wait...
Debugger attached successfully.
Server compiler detected.
JVM version is 25.161-b12

using thread-local object allocation.
Mark Sweep Compact GC

Heap Configuration:
   MinHeapFreeRatio         = 40 # 最小堆使用比例
   MaxHeapFreeRatio         = 70 # 最大堆可用比例
   MaxHeapSize              = 482344960 (460.0MB) # 最大堆空间大小
   NewSize                  = 10485760 (10.0MB) # 新生代分配大小
   MaxNewSize               = 160759808 (153.3125MB) # 最大新生代可分配大小
   OldSize                  = 20971520 (20.0MB) # 老年代大小
   NewRatio                 = 2 # 新生代比例
   SurvivorRatio            = 8 # 新生代与 Survivor 比例
   MetaspaceSize            = 21807104 (20.796875MB) # 元空间大小
   CompressedClassSpaceSize = 1073741824 (1024.0MB) # Compressed Class Space 空间大小限制
   MaxMetaspaceSize         = 17592186044415 MB # 最大元空间大小
   G1HeapRegionSize         = 0 (0.0MB) # G1 单个 Region 大小

Heap Usage:  # 堆使用情况
New Generation (Eden + 1 Survivor Space): # 新生代
   capacity = 9502720 (9.0625MB) # 新生代总容量
   used     = 4995320 (4.763908386230469MB) # 新生代已使用
   free     = 4507400 (4.298591613769531MB) # 新生代剩余容量
   52.56726495150862% used # 新生代使用占比
Eden Space:
   capacity = 8454144 (8.0625MB) # Eden 区总容量
   used     = 4029752 (3.8430709838867188MB) # Eden 区已使用
   free     = 4424392 (4.219429016113281MB) # Eden 区剩余容量
   47.665996699370154% used  # Eden 区使用占比
From Space: # 其中一个 Survivor 区的内存分布
   capacity = 1048576 (1.0MB)
   used     = 965568 (0.92083740234375MB)
   free     = 83008 (0.07916259765625MB)
   92.083740234375% used
To Space: # 另一个 Survivor 区的内存分布
   capacity = 1048576 (1.0MB)
   used     = 0 (0.0MB)
   free     = 1048576 (1.0MB)
   0.0% used
tenured generation: # 老年代
   capacity = 20971520 (20.0MB)
   used     = 10611384 (10.119804382324219MB)
   free     = 10360136 (9.880195617675781MB)
   50.599021911621094% used

10730 interned Strings occupying 906232 bytes.
By checking JVM memory allocation and runtime usage, you can determine whether the memory allocation is reasonable
In addition, you can view the most resource-consuming objects while the JVM is running, jmap -histo:live 15162 | more
The JVM memory object list is sorted according to the memory size occupied by the object
instances: number of instances bytes: unit byte class name: class name
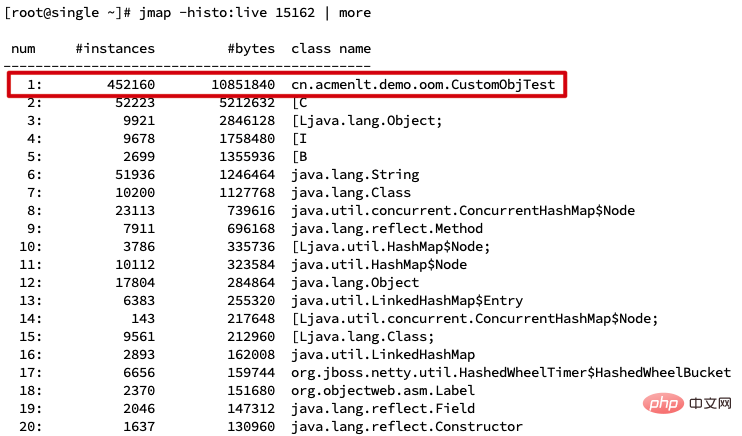
It is obvious that CustomObjTest object instances and excessive memory usage
Unfortunately, the solution has limitations. Because it can only troubleshoot the problem of excessive memory usage by objects
where "[" represents an array, for example, "[C" represents a Char array, and "[B" represents a Byte array. If the array memory takes up too much, we don’t know which objects hold it, so we need to Dump the memory for offline analysis
jmap -histo:liveExecute this command, the JVM will Trigger GC first, then collect statistics
Dump file analysis
Dump file is the memory image of the Java process, which mainly includesSystem information, Virtual machine properties,Complete thread Dump,Status of all classes and objects and other information
When When a memory overflow or GC exception occurs in the program, it is suspected that the JVM has memory leak, then we can export the Dump file for analysis
Add the following parameters to the JVM startup parameter configuration
-XX:+HeapDumpOnOutOfMemoryError -XX:HeapDumpPath=./(参数为 Dump 文件生成路径)
当 JVM 发生 OOM 异常自动导出 Dump 文件,文件名称默认格式:
java_pid{pid}.hprof
上面配置是在应用抛出 OOM 后自动导出 Dump,或者可以在 JVM 运行时导出 Dump 文件
jmap -dump:file=[文件路径] [pid]

# 示例
jmap -dump:file=./jvmdump.hprof 15162
在本地写一个测试代码,验证下 OOM 以及分析 Dump 文件
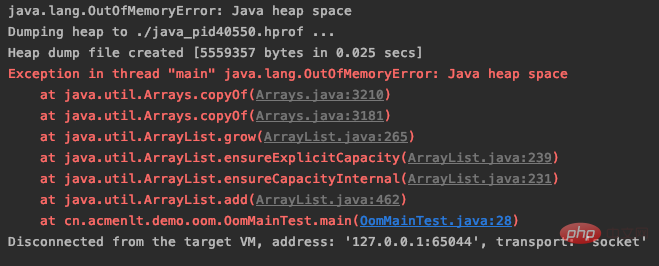
设置 VM 参数:-Xms3m -Xmx3m -XX:+HeapDumpOnOutOfMemoryError -XX:HeapDumpPath=./

public static void main(String[] args) {
    List<Object> oomList = Lists.newArrayList();
   // 无限循环创建对象
    while (true) {
        oomList.add(new Object());
    }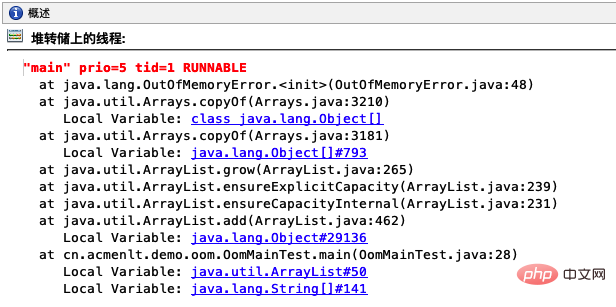
}通过报错信息得知,java heap space 表示 OOM 发生在堆区,并生成了 hprof 二进制文件在当前文件夹下
JvisualVM 分析
Dump 分析工具有很多,相对而言 JvisualVM、JProfiler、Eclipse Mat,使用人群更多一些。下面以 JvisualVM 举例分析 Dump 文件
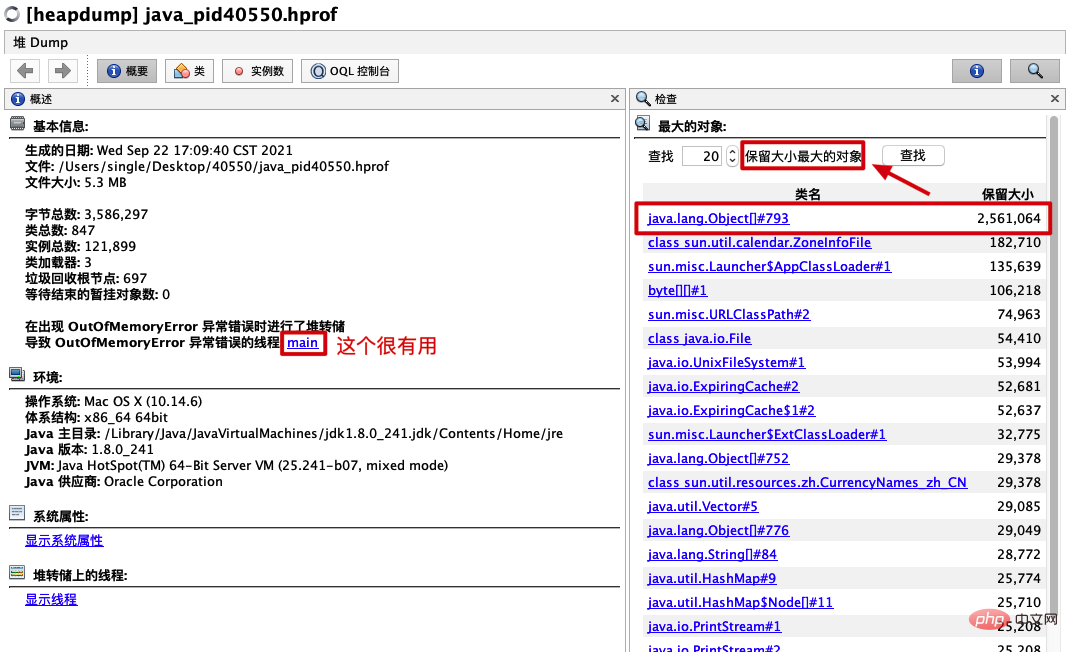
列举两个常用的功能,第一个是能看到触发 OOM 的线程堆栈,清晰得知程序溢出的原因
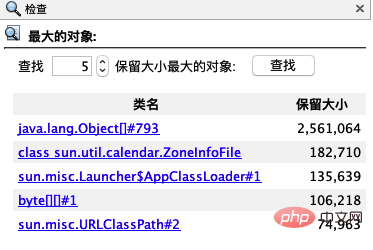
第二个就是可以查看 JVM 内存里保留大小最大的对象,可以自由选择排查个数
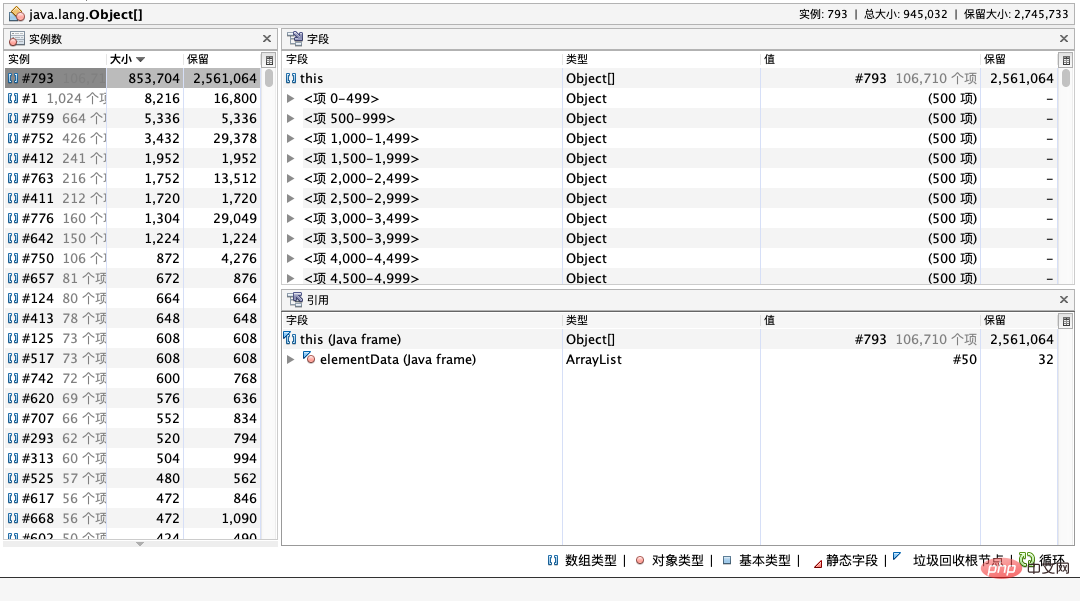
点击对象还可以跳转具体的对象引用详情页面
文中 Dump 文件较为简单,而正式环境出错的原因五花八门,所以不对该 Dump 文件做深度解析
注意:JvisualVM 如果分析大 Dump 文件,可能会因为内存不足打不开,需要调整默认的内存
Summary Review
If you encounter JVM memory overflow online, you can troubleshoot in the following steps
jmap -heapCheck whether the memory allocation is too smalljmap -histoCheck whether there are obvious objects allocated too much and not releasedjmap -dumpExport the current memory snapshot of the JVM and use tools such as JDK or MAT to analyze the snapshot
If the above If you still cannot locate the problem, you need to check whether the application is constantly creating resources, such as network connections or threads, which may cause system resources to be exhausted.
The above is the detailed content of Interview with a certain group: If you encounter OOM online, how should you troubleshoot it? How to solve? What options?. For more information, please follow other related articles on the PHP Chinese website!

Hot AI Tools

Undresser.AI Undress
AI-powered app for creating realistic nude photos

AI Clothes Remover
Online AI tool for removing clothes from photos.

Undress AI Tool
Undress images for free

Clothoff.io
AI clothes remover

AI Hentai Generator
Generate AI Hentai for free.

Hot Article
Hot Tools

Notepad++7.3.1
Easy-to-use and free code editor

SublimeText3 Chinese version
Chinese version, very easy to use

Zend Studio 13.0.1
Powerful PHP integrated development environment

Dreamweaver CS6
Visual web development tools

SublimeText3 Mac version
God-level code editing software (SublimeText3)
Hot Topics


 Interviewer: Spring Aop common annotations and execution sequence
Aug 15, 2023 pm 04:32 PM
Interviewer: Spring Aop common annotations and execution sequence
Aug 15, 2023 pm 04:32 PM
You must know Spring, so let’s talk about the order of all notifications of Aop. How does Spring Boot or Spring Boot 2 affect the execution order of aop? Tell us about the pitfalls you encountered in AOP?
 Interview with a certain group: If you encounter OOM online, how should you troubleshoot it? How to solve? What options?
Aug 23, 2023 pm 02:34 PM
Interview with a certain group: If you encounter OOM online, how should you troubleshoot it? How to solve? What options?
Aug 23, 2023 pm 02:34 PM
OOM means that there is a vulnerability in the program, which may be caused by the code or JVM parameter configuration. This article talks to readers about how to troubleshoot when a Java process triggers OOM.
 Interviewer: If you encounter OOM online, how to solve it?
Aug 17, 2023 pm 04:38 PM
Interviewer: If you encounter OOM online, how to solve it?
Aug 17, 2023 pm 04:38 PM
OOM can be said to be one of the problems we developers fear most, and the causes are basically caused by code or JVM parameter configuration. This article talks to readers about how to troubleshoot when a Java process triggers OOM.
 Ele.me's written test questions seem simple, but it stumps a lot of people
Aug 24, 2023 pm 03:29 PM
Ele.me's written test questions seem simple, but it stumps a lot of people
Aug 24, 2023 pm 03:29 PM
Don’t underestimate the written examination questions of many companies. There are pitfalls and you can fall into them accidentally. When you encounter this kind of written test question about cycles, I suggest you think calmly and take it step by step.
 Novices can also compete with BAT interviewers: CAS
Aug 24, 2023 pm 03:09 PM
Novices can also compete with BAT interviewers: CAS
Aug 24, 2023 pm 03:09 PM
The extra chapter of the Java concurrent programming series, C A S (Compare and swap), is still in an easy-to-understand style with pictures and texts, allowing readers to have a crazy conversation with the interviewer.
 Last week, I had an interview with XX Insurance and it was cool! ! !
Aug 25, 2023 pm 03:44 PM
Last week, I had an interview with XX Insurance and it was cool! ! !
Aug 25, 2023 pm 03:44 PM
Last week, a friend in the group went for an interview with Ping An Insurance. The result was a bit regretful, which is quite a pity, but I hope you don’t get discouraged. As you said, basically all the questions encountered in the interview can be solved by memorizing the interview questions. It’s solved, so please work hard!
 5 String interview questions, less than 10% of people can answer them all correctly! (with answer)
Aug 23, 2023 pm 02:49 PM
5 String interview questions, less than 10% of people can answer them all correctly! (with answer)
Aug 23, 2023 pm 02:49 PM
This article will take a look at 5 interview questions about the Java String class. I have personally experienced several of these five questions during the interview process. This article will help you understand why the answers to these questions are like this.

