

How to create a cumulative curve graph in Python?

otive graphs graphically represent the cumulative distribution function (CDF) of a set of data, sometimes called a cumulative frequency curve. It is used to examine data distribution and discover patterns and trends. Matplotlib, Pandas, and Numpy are some of the libraries and tools provided by Python for creating otive graphics. In this tutorial, we will look at how to use Matplotlib to generate ogive graphics in Python.
To create a cumulative curve chart, we need to import the required libraries. In this example we will use Matplotlib, Pandas and Numpy. Matplotlib is a popular data visualization library for creating interactive charts and graphs in Python. Numpy, on the other hand, is used to perform complex mathematical operations. Pandas is another widely used Python library specialized for data manipulation and analysis.
grammar
plt.plot(*np.histogram(data, bins), 'o-')
In this syntax, 'data' is the data set used to create the cumulative curve chart. The frequency distribution of the data is determined by the 'np.histogram' function, which also returns the histogram's values and bin boundaries. Use 'plt.plot' to create a cumulative curve plot, using the ' 'o-' ' format string to plot the data points and connect them with lines. The '*' operator then passes the histogram values and bin bounds as separate arguments to 'plt.plot'.
Example
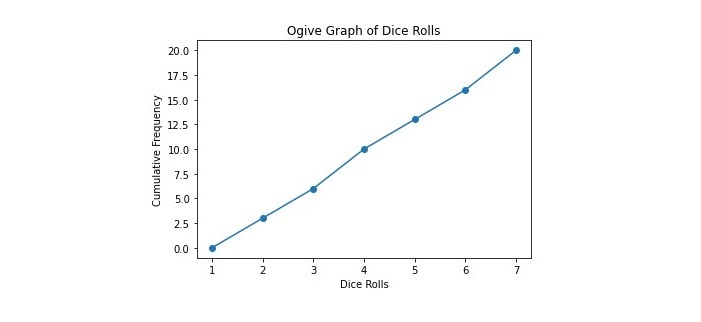
This is a simple example that creates an ogive plot to visualize the cumulative frequency distribution of a list of dice throws.
import numpy as np
import matplotlib.pyplot as plt

# List of dice rolls
rolls = [1, 2, 3, 4, 5, 6, 3, 6, 2, 5, 1, 6, 4, 2, 3, 5, 1, 4, 6, 3]

# Calculate the cumulative frequency
bins = np.arange(0, 8, 1)
freq, bins = np.histogram(rolls, bins=bins)
cumulative_freq = np.cumsum(freq)

# Create the ogive graph
plt.plot(bins[1:], cumulative_freq, '-o')
plt.xlabel('Dice Rolls')
plt.ylabel('Cumulative Frequency')
plt.title('Ogive Graph of Dice Rolls')
plt.show()
First, we created an ogive plot to visualize the cumulative frequency distribution of a set of dice throw results, by importing the necessary modules NumPy and Matplotlib. Then, the code defines a set of dice rolling results and uses NumPy's histogram function to generate a "histogram" of the data, specifying the number of groups and value range of the data. Next, use NumPy’s ‘cumsum’ function to represent the cumulative frequency of the data.
Finally, use Matplotlib's "plot" function to plot the cumulative frequencies as a logarithmic plot, with the upper limit of each bin used as the x-axis, forming an ogive plot. The resulting ogive plot shows the cumulative frequency distribution of dice throws, where the x-axis represents the values rolled and the y-axis represents the cumulative frequency of those values up to a certain point. This graph can be used to analyze the frequency and distribution of dice throws.
Output
Example
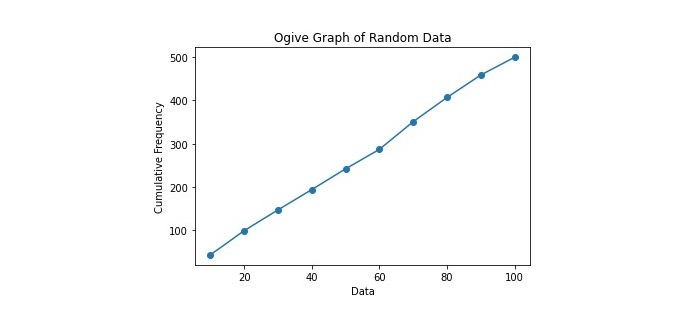
This example demonstrates an ogive plot for visualizing the distribution of 500 random numbers between 0 and 100.
import numpy as np
import matplotlib.pyplot as plt

# Generate random data
data = np.random.randint(0, 100, 500)

# Calculate the cumulative frequency
bins = np.arange(0, 110, 10)
freq, bins = np.histogram(data, bins=bins)
cumulative_freq = np.cumsum(freq)

# Create the ogive graph
plt.plot(bins[1:], cumulative_freq, '-o')
plt.xlabel('Data')
plt.ylabel('Cumulative Frequency')
plt.title('Ogive Graph of Random Data')
plt.show()
In this example, we first use NumPy to generate a data set containing 500 random numbers between 0 and 100. Then use NumPy to calculate the cumulative frequency of the data, and the interval width of each frequency is 10. Finally, use Matplotlib to plot the relationship between the cumulative frequency and the upper limit of each interval to generate an ogive plot. This example demonstrates how to create an ogive plot using Python and randomly generated data.
Output
We learned to use the Matplotlib module to create cumulative curve plots in Python, which is a simple process using the matplotlib library. By loading your data, calculating cumulative frequencies, and plotting the results, you can easily visualize the distribution of your data set and identify any patterns or trends. You can customize your graphics with labels, titles, and styles to make them more visually appealing and informative. Cumulative line graphs are useful tools in statistical analysis and can represent a variety of data, from income distributions to test scores.
The above is the detailed content of How to create a cumulative curve graph in Python?. For more information, please follow other related articles on the PHP Chinese website!

Hot AI Tools

Undresser.AI Undress
AI-powered app for creating realistic nude photos

AI Clothes Remover
Online AI tool for removing clothes from photos.

Undress AI Tool
Undress images for free

Clothoff.io
AI clothes remover

Video Face Swap
Swap faces in any video effortlessly with our completely free AI face swap tool!

Hot Article
Hot Tools

Notepad++7.3.1
Easy-to-use and free code editor

SublimeText3 Chinese version
Chinese version, very easy to use

Zend Studio 13.0.1
Powerful PHP integrated development environment

Dreamweaver CS6
Visual web development tools

SublimeText3 Mac version
God-level code editing software (SublimeText3)
Hot Topics
 1386
1386
 52
52

 Python vs. JavaScript: Community, Libraries, and Resources
Apr 15, 2025 am 12:16 AM
Python vs. JavaScript: Community, Libraries, and Resources
Apr 15, 2025 am 12:16 AM
Python and JavaScript have their own advantages and disadvantages in terms of community, libraries and resources. 1) The Python community is friendly and suitable for beginners, but the front-end development resources are not as rich as JavaScript. 2) Python is powerful in data science and machine learning libraries, while JavaScript is better in front-end development libraries and frameworks. 3) Both have rich learning resources, but Python is suitable for starting with official documents, while JavaScript is better with MDNWebDocs. The choice should be based on project needs and personal interests.
 How to run programs in terminal vscode
Apr 15, 2025 pm 06:42 PM
How to run programs in terminal vscode
Apr 15, 2025 pm 06:42 PM
In VS Code, you can run the program in the terminal through the following steps: Prepare the code and open the integrated terminal to ensure that the code directory is consistent with the terminal working directory. Select the run command according to the programming language (such as Python's python your_file_name.py) to check whether it runs successfully and resolve errors. Use the debugger to improve debugging efficiency.
 Can visual studio code be used in python
Apr 15, 2025 pm 08:18 PM
Can visual studio code be used in python
Apr 15, 2025 pm 08:18 PM
VS Code can be used to write Python and provides many features that make it an ideal tool for developing Python applications. It allows users to: install Python extensions to get functions such as code completion, syntax highlighting, and debugging. Use the debugger to track code step by step, find and fix errors. Integrate Git for version control. Use code formatting tools to maintain code consistency. Use the Linting tool to spot potential problems ahead of time.
 Is the vscode extension malicious?
Apr 15, 2025 pm 07:57 PM
Is the vscode extension malicious?
Apr 15, 2025 pm 07:57 PM
VS Code extensions pose malicious risks, such as hiding malicious code, exploiting vulnerabilities, and masturbating as legitimate extensions. Methods to identify malicious extensions include: checking publishers, reading comments, checking code, and installing with caution. Security measures also include: security awareness, good habits, regular updates and antivirus software.
 Can vs code run in Windows 8
Apr 15, 2025 pm 07:24 PM
Can vs code run in Windows 8
Apr 15, 2025 pm 07:24 PM
VS Code can run on Windows 8, but the experience may not be great. First make sure the system has been updated to the latest patch, then download the VS Code installation package that matches the system architecture and install it as prompted. After installation, be aware that some extensions may be incompatible with Windows 8 and need to look for alternative extensions or use newer Windows systems in a virtual machine. Install the necessary extensions to check whether they work properly. Although VS Code is feasible on Windows 8, it is recommended to upgrade to a newer Windows system for a better development experience and security.
 Python: Automation, Scripting, and Task Management
Apr 16, 2025 am 12:14 AM
Python: Automation, Scripting, and Task Management
Apr 16, 2025 am 12:14 AM
Python excels in automation, scripting, and task management. 1) Automation: File backup is realized through standard libraries such as os and shutil. 2) Script writing: Use the psutil library to monitor system resources. 3) Task management: Use the schedule library to schedule tasks. Python's ease of use and rich library support makes it the preferred tool in these areas.
 What is vscode What is vscode for?
Apr 15, 2025 pm 06:45 PM
What is vscode What is vscode for?
Apr 15, 2025 pm 06:45 PM
VS Code is the full name Visual Studio Code, which is a free and open source cross-platform code editor and development environment developed by Microsoft. It supports a wide range of programming languages and provides syntax highlighting, code automatic completion, code snippets and smart prompts to improve development efficiency. Through a rich extension ecosystem, users can add extensions to specific needs and languages, such as debuggers, code formatting tools, and Git integrations. VS Code also includes an intuitive debugger that helps quickly find and resolve bugs in your code.
 Can visual studio code run python
Apr 15, 2025 pm 08:00 PM
Can visual studio code run python
Apr 15, 2025 pm 08:00 PM
VS Code not only can run Python, but also provides powerful functions, including: automatically identifying Python files after installing Python extensions, providing functions such as code completion, syntax highlighting, and debugging. Relying on the installed Python environment, extensions act as bridge connection editing and Python environment. The debugging functions include setting breakpoints, step-by-step debugging, viewing variable values, and improving debugging efficiency. The integrated terminal supports running complex commands such as unit testing and package management. Supports extended configuration and enhances features such as code formatting, analysis and version control.
