
 Database
SQL
Meituan interview question: Have you ever encountered slow SQL? How was it solved?
Database
SQL
Meituan interview question: Have you ever encountered slow SQL? How was it solved?
Meituan interview question: Have you ever encountered slow SQL? How was it solved?
# Regarding slow SQL, I chatted with the interviewer for a long time. The interviewer was also very humble and always nodded. I thought my answer was okay. Finally, I said, "Go back and wait for the notification!".

#So, I decided to share this slow SQL technology with you. I hope that next time you encounter a similar interview, you can get the offer you want smoothly and easily.
The greatest joy in life is that everyone says you can’t do it, but you complete it!
What is Slow SQL?
MySQL's slow query log is a log record provided by MySQL. It is used to record statements in MySQL whose query time exceeds (greater than) the set threshold (long_query_time) and records them in the slow query log. middle.
Among them, the default value of long_query_time is 10, and the unit is seconds. That is to say, by default, if your SQL query time exceeds 10 seconds, it is regarded as slow SQL.
How to enable slow SQL log?
In MySQL, the slow SQL log is not turned on by default, which means that even if a slow SQL occurs, it will not tell you. If you need to know which SQL is Slow SQL requires us to manually enable the slow SQL log.
Regarding whether slow SQL is enabled, we can check it through the following command:
-- 查看慢查询日志是否开启
show variables like '%slow_query_log%';
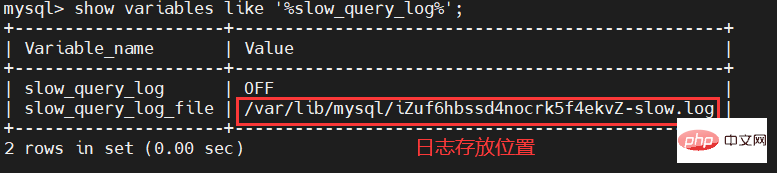
Through the command, we can see that the slow_query_log item is OFF, indicating that our slow SQL log is not turned on. In addition, we can also see the directory where our slow SQL logs are stored and the name of the log file.
Let's enable the slow SQL log and execute the following command:
set global slow_query_log = 1;
It should be noted here that what is enabled here is our current database, and it will be invalid after we restart the database.
After turning on the slow SQL log, check again:
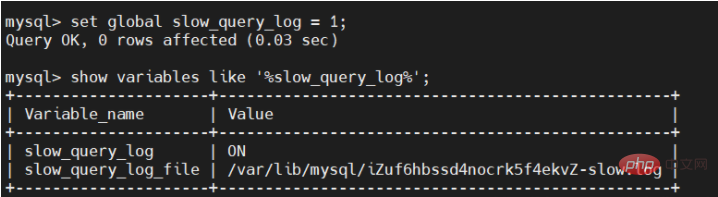
slow_query_log item has become ON means the activation is successful.
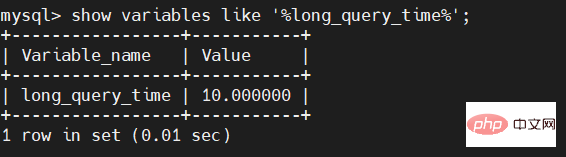
As mentioned above, the default time of slow SQL is 10 seconds. We can see the default time of our slow SQL through the following command:
show variables like '%long_query_time%';
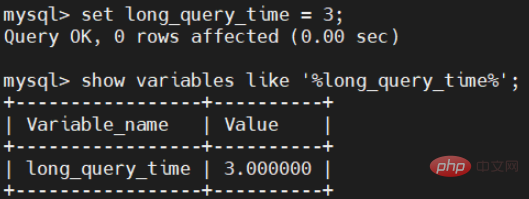
We cannot always use this default value. Many businesses may require shorter or longer time, so at this time, we need to modify the default time. The modification command is as follows:
set long_query_time = 3;
The modification is completed, let’s see if it has been changed to 3 seconds.
Note here: If you want it to take effect permanently, you also need to modify the configuration file my under MySQL. cnf file.
[mysqld]
slow_query_log=1
slow_query_log_file=/var/lib/mysql/atguigu-slow.log
long_query_time=3
log_output=FILE
Note: Different operating systems have different configurations.
In Linux operating system
Add
log-slow-queries=/var/lib/mysql/slowquery.log in the mysql configuration file my.cnf (Specify the log file storage location, which can be empty. The system will give a default file host_name-slow.log)
long_query_time=2 (record the time exceeded, the default is 10s)
log-queries-not-using-indexes (log下来没有使用索引的query,可以根据情况决定是否开启)
log-long-format (如果设置了,所有没有使用索引的查询也将被记录)
Windows操作系统中
在my.ini的[mysqld]添加如下语句:
log-slow-queries = E:\web\mysql\log\mysqlslowquery.log
long_query_time = 3(其他参数如上)
执行一条慢SQL,因为我们前面已经设置好了慢SQL时间为3秒,所以,我们只要执行一条SQL时间超过3秒即可。
SELECT SLEEP(4);
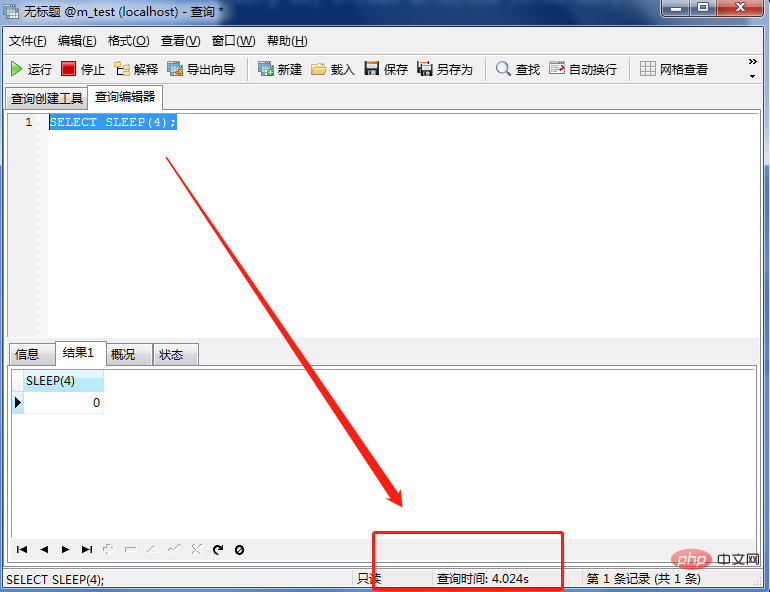
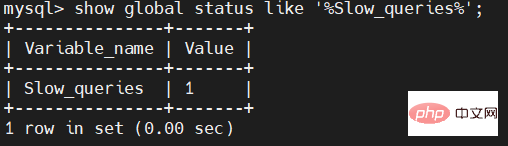
该SQL耗时4.024秒,下面我们就来查看慢SQL出现了多少条。
使用命令:
show global status like '%Slow_queries%';
查询SQL历程
找到慢SQL日志文件,打开后就会出现类似下面这样的语句;
# Time: 2021-07-20T09:17:49.791767Z
# User@Host: root[root] @ localhost []  Id:   150
# Query_time: 0.002549  Lock_time: 0.000144 Rows_sent: 1  Rows_examined: 4079
SET timestamp=1566292669;
select * from city where Name = 'Salala';
简单说明:
1.Time 该日志记录的时间
2.User @Host MySQL登录的用户和登录的主机地址
3.Query_time一行 第一个时间是查询的时间、第二个是锁表的时间、第三个是返回的行数、第四个是扫描的行数
4.SET timestamp 这一个是MySQL查询的时间
5.sql语句 这一行就很明显了,表示的是我们执行的sql语句
切记
If you set long_query_time=0, it means that all our query SQL statements will be output to the slow SQL log file.
How to locate slow SQL?
Usually we have two ways to locate slow SQL:
The first way: locate slow querySQL can be through two representations Determine
System-level symptoms: Use the sar command and topCommand to view the current system status You can also use Prometheus and Grafanamonitoring tools to view the current system status CPUConsumption is serious IOWaiting is serious The page response time is too long There are timeout and other errors in the project log SQL statement representation: SQLLong statement SQLThe statement execution time is too long SQLGet data from full table scan rows and ## in the execution plan #costVery big
SQL
MySQL: 慢查询日志 测试工具loadrunner ptquery工具 Oracle: AWR报告 测试工具loadrunner 相关内部视图vsession_wait GRID CONTROL监控工具
熟悉慢SQL日志分析工具吗?
如果开启了慢SQL日志后,可能会有大量的慢SQL日志产生,此时再用肉眼看,那是不太现实的,所以大佬们就给我搞了个工具:mysqldumpslow。
mysqldumpslow能将相同的慢SQL归类,并统计出相同的SQL执行的次数,每次执行耗时多久、总耗时,每次返回的行数、总行数,以及客户端连接信息等。
通过命令
mysqldumpslow --help
可以看到相关参数的说明:
~# mysqldumpslow --help
Usage: mysqldumpslow [ OPTS... ] [ LOGS... ]

Parse and summarize the MySQL slow query log. Options are

  --verbose    verbose
  --debug      debug
  --help       write this text to standard output

  -v           verbose
  -d           debug
  -s ORDER     what to sort by (al, at, ar, c, l, r, t), 'at' is default
                al: average lock time
                ar: average rows sent
                at: average query time
                 c: count
                 l: lock time
                 r: rows sent
                 t: query time
  -r           reverse the sort order (largest last instead of first)
  -t NUM       just show the top n queries
  -a           don't abstract all numbers to N and strings to 'S'
  -n NUM       abstract numbers with at least n digits within names
  -g PATTERN   grep: only consider stmts that include this string
  -h HOSTNAME  hostname of db server for *-slow.log filename (can be wildcard),
               default is '*', i.e. match all
  -i NAME      name of server instance (if using mysql.server startup script)
-l don't subtract lock time from total time比较常用的参数有这么几个:
-s 指定输出的排序方式
   t  : 根据query time(执行时间)进行排序;
   at : 根据average query time(平均执行时间)进行排序;(默认使用的方式)
   l  : 根据lock time(锁定时间)进行排序;
   al : 根据average lock time(平均锁定时间)进行排序;
   r  : 根据rows(扫描的行数)进行排序;
   ar : 根据average rows(扫描的平均行数)进行排序;
   c  : 根据日志中出现的总次数进行排序;
-t 指定输出的sql语句条数;
-a 不进行抽象显示(默认会将数字抽象为N,字符串抽象为S);
-g 满足指定条件,与grep相似;
-h 用来指定主机名(指定打开文件,通常慢查询日志名称为“主机名-slow.log”,用-h exp则表示打开exp-slow.log文件);
使用方式
mysqldumpslow常用的使用方式如下:
# mysqldumpslow -s c slow.log
如上一条命令,应该是mysqldumpslow最简单的一种形式,其中-s参数是以什么方式排序的意思,c指代的是以总数从大到小的方式排序。-s的常用子参数有:c: 相同查询以查询条数和从大到小排序。t: 以查询总时间的方式从大到小排序。l: 以查询锁的总时间的方式从大到小排序。at: 以查询平均时间的方式从大到小排序。al: 以查询锁平均时间的方式从大到小排序。
同样的,还可以增加其他参数,实际使用的时候,按照自己的情况来。
其他常用方式:
# 得到返回记录集最多的10 个SQL
mysqldumpslow -s r -t 10 /var/lib/mysql/atguigu-slow.log

# 得到访问次数最多的10 个SQL
mysqldumpslow -s c -t 10 /var/lib/mysql/atguigu-slow.log

# 得到按照时间排序的前10 条里面含有左连接的查询语句
mysqldumpslow -s t -t 10 -g "left join" /var/lib/mysql/atguigu-slow.log

# 另外建议在使用这些命令时结合| 和more 使用,否则有可能出现爆屏情况
mysqldumpslow -s r -t 10 /var/lib/mysql/atguigu-slow.log | more
接下,我们来个实际操作。
实操
root@yunzongjitest1:~# mysqldumpslow -s t -t 3

Reading mysql slow query log from /var/lib/mysql/exp-slow.log /var/lib/mysql/yunzongjitest1-slow.log
Count: 464  Time=18.35s (8515s)  Lock=0.01s (3s)  Rows=90884.0 (42170176), root[root]@localhost
  select ************

Count: 38  Time=11.22s (426s)  Lock=0.00s (0s)  Rows=1.0 (38), root[root]@localhost
  select *********** not like 'S'

Count: 48  Time=5.07s (243s)  Lock=0.02s (1s)  Rows=1.0 (48), root[root]@localhost
  select ********='S'
这其中的SQL语句因为涉及某些信息,所以我都用*号将主体替换了,如果希望得到具体的值,使用-a参数。
使用mysqldumpslow查询出来的摘要信息,包含了这些内容:
Count: 464 :表示慢查询日志总共记录到这条sql语句执行的次数;
Time=18.35s (8515s):18.35s表示平均执行时间(-s at),8515s表示总的执行时间(-s t);
Lock=0.01s (3s):与上面的Time相同,第一个表示平均锁定时间(-s al),括号内的表示总的锁定时间(-s l)(也有另一种说法,说是表示的等待锁释放的时间);
Rows=90884.0 (42170176): The first value indicates the average number of rows scanned (-s ar), and the value in brackets indicates the total number of rows scanned (-s r).
The above is the detailed content of Meituan interview question: Have you ever encountered slow SQL? How was it solved?. For more information, please follow other related articles on the PHP Chinese website!

Hot AI Tools

Undresser.AI Undress
AI-powered app for creating realistic nude photos

AI Clothes Remover
Online AI tool for removing clothes from photos.

Undress AI Tool
Undress images for free

Clothoff.io
AI clothes remover

AI Hentai Generator
Generate AI Hentai for free.

Hot Article
Hot Tools

Notepad++7.3.1
Easy-to-use and free code editor

SublimeText3 Chinese version
Chinese version, very easy to use

Zend Studio 13.0.1
Powerful PHP integrated development environment

Dreamweaver CS6
Visual web development tools

SublimeText3 Mac version
God-level code editing software (SublimeText3)
Hot Topics


 What is the difference between HQL and SQL in Hibernate framework?
Apr 17, 2024 pm 02:57 PM
What is the difference between HQL and SQL in Hibernate framework?
Apr 17, 2024 pm 02:57 PM
HQL and SQL are compared in the Hibernate framework: HQL (1. Object-oriented syntax, 2. Database-independent queries, 3. Type safety), while SQL directly operates the database (1. Database-independent standards, 2. Complex executable queries and data manipulation).
 Usage of division operation in Oracle SQL
Mar 10, 2024 pm 03:06 PM
Usage of division operation in Oracle SQL
Mar 10, 2024 pm 03:06 PM
"Usage of Division Operation in OracleSQL" In OracleSQL, division operation is one of the common mathematical operations. During data query and processing, division operations can help us calculate the ratio between fields or derive the logical relationship between specific values. This article will introduce the usage of division operation in OracleSQL and provide specific code examples. 1. Two ways of division operations in OracleSQL In OracleSQL, division operations can be performed in two different ways.
 What does the identity attribute in SQL mean?
Feb 19, 2024 am 11:24 AM
What does the identity attribute in SQL mean?
Feb 19, 2024 am 11:24 AM
What is Identity in SQL? Specific code examples are needed. In SQL, Identity is a special data type used to generate auto-incrementing numbers. It is often used to uniquely identify each row of data in a table. The Identity column is often used in conjunction with the primary key column to ensure that each record has a unique identifier. This article will detail how to use Identity and some practical code examples. The basic way to use Identity is to use Identit when creating a table.
 Comparison and differences of SQL syntax between Oracle and DB2
Mar 11, 2024 pm 12:09 PM
Comparison and differences of SQL syntax between Oracle and DB2
Mar 11, 2024 pm 12:09 PM
Oracle and DB2 are two commonly used relational database management systems, each of which has its own unique SQL syntax and characteristics. This article will compare and differ between the SQL syntax of Oracle and DB2, and provide specific code examples. Database connection In Oracle, use the following statement to connect to the database: CONNECTusername/password@database. In DB2, the statement to connect to the database is as follows: CONNECTTOdataba
 Detailed explanation of the Set tag function in MyBatis dynamic SQL tags
Feb 26, 2024 pm 07:48 PM
Detailed explanation of the Set tag function in MyBatis dynamic SQL tags
Feb 26, 2024 pm 07:48 PM
Interpretation of MyBatis dynamic SQL tags: Detailed explanation of Set tag usage MyBatis is an excellent persistence layer framework. It provides a wealth of dynamic SQL tags and can flexibly construct database operation statements. Among them, the Set tag is used to generate the SET clause in the UPDATE statement, which is very commonly used in update operations. This article will explain in detail the usage of the Set tag in MyBatis and demonstrate its functionality through specific code examples. What is Set tag Set tag is used in MyBati
 How does Java use the MySQL driver interceptor to implement SQL time-consuming calculations?
May 27, 2023 pm 01:10 PM
How does Java use the MySQL driver interceptor to implement SQL time-consuming calculations?
May 27, 2023 pm 01:10 PM
Background: One of the company's needs is that the company's existing link tracking log component must support MySQL's SQL execution time printing. The common method to implement link tracking is to implement the interceptor interface or filter interface provided by a third-party framework or tool. MySQL is no exception. In fact, it just implements the interceptor interface driven by MySQL. There are different versions of MySQL channels, and the interceptor interfaces of different versions are different, so you need to implement the response interceptor according to the different versions of MySQL drivers you use. Next, we will introduce MySQL channels 5 and 6 respectively. 8 version implementation. MySQL5 is implemented here using MySQL channel 5.1.18 version as an example to implement Statem
 How to solve the 5120 error in SQL
Mar 06, 2024 pm 04:33 PM
How to solve the 5120 error in SQL
Mar 06, 2024 pm 04:33 PM
Solution: 1. Check whether the logged-in user has sufficient permissions to access or operate the database, and ensure that the user has the correct permissions; 2. Check whether the account of the SQL Server service has permission to access the specified file or folder, and ensure that the account Have sufficient permissions to read and write the file or folder; 3. Check whether the specified database file has been opened or locked by other processes, try to close or release the file, and rerun the query; 4. Try as administrator Run Management Studio as etc.
 How to use SQL statements for data aggregation and statistics in MySQL?
Dec 17, 2023 am 08:41 AM
How to use SQL statements for data aggregation and statistics in MySQL?
Dec 17, 2023 am 08:41 AM
How to use SQL statements for data aggregation and statistics in MySQL? Data aggregation and statistics are very important steps when performing data analysis and statistics. As a powerful relational database management system, MySQL provides a wealth of aggregation and statistical functions, which can easily perform data aggregation and statistical operations. This article will introduce the method of using SQL statements to perform data aggregation and statistics in MySQL, and provide specific code examples. 1. Use the COUNT function for counting. The COUNT function is the most commonly used
