

Diagnose WordPress performance issues with new relics


This tutorial continues where we started in Monitoring WordPress Performance with New Relic. Here, I’ll provide you with a conceptual overview of WordPress performance and guide you through checking the performance of your own site using New Relic.
If you came here from the Optimizing WordPress with Varnish and W3 Total Cache tutorial, then you already have a very optimized WordPress foundation. If not, you may want to go back and review the article.
Using New Relic in WordPress
WordPress is a powerful open source blogging system that can support small personal blogs to large websites of major media organizations. But actually running WordPress well, and scaling it successfully and cost-effectively, requires a lot of complexity.
New Relic’s performance monitoring service offers an excellent way to ensure your WordPress configuration remains running smoothly and efficiently.
Note: New Relic warns that its service is best used to optimize WordPress on a dedicated server, rather than a virtual or shared server (such as those offered by many cloud-based providers). If you’re running WordPress on shared hosting, New Relic may not be as useful to you as it would be for a website running on a dedicated server.
If you'd like to learn more about New Relic before diving into this performance guide, Tuts offers a variety of articles about their services.
What makes WordPress fast or slow?
In 2013, Frederick Townes, the creator of the free W3 Total Cache WordPress plugin, wrote a blog post for New Relic describing the performance aspects we need to consider: Optimizing WordPress Performance with New Relic. This is a good summary and I will review it.
Townes highlighted the core areas we need to focus on:
1. Disk performance. Non-shared local disks always provide the most consistent and reliable performance. For example, using a console with an SSD drive or a high-speed hard drive is ideal.
2. MySQL query cache. Query cache saves the results of common database queries and can return results immediately without repeated execution. Townes recommends running MySQLTuner to help optimize the database configuration.
3. Usage of queries by WordPress themes and plugins. WordPress works fine out of the box with configuration, but when we add third-party plugins and themes, we may encounter various error codes that cause performance issues.
4. File size of WordPress themes and plugins. Reducing file size and number of files (and thus reducing HTTP transactions) can have a huge impact on the user's website experience. Unfortunately, not all Cascading Style Sheets (CSS) or JavaScript (JS) can be easily integrated and minimized.
5. Optimized PHP, relatively slow. A faster version of PHP (such as HHVM) might work for WordPress in the future, but I understand it's not yet stable for this task. Meanwhile, Townes offers a series of suggestions: reduce the memory footprint of your scripts, use autoloading, use memory, avoid loops, reduce execution time, minimize the number of open files to reduce disk calls and memory usage, and use include and require instead of include_once and require_once.
6. Use Opcode Caching, such as APC, an open source caching framework for PHP code. "APC keeps an interpreted (executable) version of the code in memory so that requests to it do not have to be reinterpreted," Townes said.
“WordPress’s object cache is where a lot of the magic happens. WordPress generates various object groups when processing page requests. These groups serve multiple purposes and are very important depending on how you use WordPress. For example, by using memcached Or APC backend stores persistent storage objects to achieve performance improvements."
Townes' W3 Total Cache implements this at the page cache level, allowing situations where PHP can still generate parts of a given page's content, while larger parts of the page that haven't changed are cached and not regenerated.
"W3TC will allow you to choose a data store other than MySQL, such as memcached, which is designed for high-speed access from multiple application servers. Therefore, each page request does not require obtaining information about the visitor or Corresponding information for others. Dynamic elements, MySQL is now able to focus on (and adjust) only the dynamic parts of the template."
Townes said, "Fragment caching will reduce your execution time by orders of magnitude."
7. Use page caching. The most useful technique for scaling a typical website is page caching. Instead of accessing the entire stack (WordPress, themes, plugins, HTML, and MySQL) with every page request, we retrieve static HTML from the web cache (usually from memory). Traffic scaling on an uncached WordPress site can shut it down in seconds, while traffic scaling on pre-written HTML files in memory cache can scale massively.
Townes says: "A reverse proxy typically provides a cache between a web application and the public Internet. Its goal is to relieve the load on the web server behind it. Reverse proxies are optimized for returning content generated by the underlying application. Varnish, Nginx and even Apache can be configured to provide reverse proxy functionality."
I most often use Varnish with Apache and W3 Total Cache to scale WordPress. If you are interested in these configurations, check out: Optimizing WordPress with Varnish and W3 Total Cache (Tuts).
8. Content delivery networks (CDNs) are cloud-based caching services for frequently used files and media. Townes says, "With a CDN, it doesn't matter where your website is hosted. If your visitors are located elsewhere in the world, the CDN will cache the content close to them, reducing the overall page load time for your website."
Now that we understand some key concepts for WordPress to run well, let’s see how New Relic can help us.
Monitor WordPress with New Relic
New Relic is a performance monitoring service that runs with a variety of server and language technologies, including PHP, and is perfect for optimizing WordPress.
New Relic provides full stack performance monitoring (end user experience) and also provides detailed server monitoring. "New Relic makes it easy to communicate what happens in your environment," said Townes.
When you run New Relic on a server, you can get detailed performance monitoring charts and statistics about the server and PHP, including: response time, Apdex score (ratio of satisfactory response time to unsatisfactory response time), throughput Volume (requests per minute), network transactions, such as third-party API requests, error rates, recent events, and server information.

Going a step further, New Relic Browser monitors full page lifecycle data—well beyond the initial page load. For every end-user page load, New Relic Browser captures:
- Time spent on the front end (browser)
- Code and events executed in the browser (JavaScript, Ajax, and end-user interaction)
- Time spent on backend (web and web apps)
- Geographical Origin
- Browser type and version and operating system
You can view data for all users globally, and view slices and dices of data by page, browser, user session, and location.
I cover the New Relic Browser more fully in Front-end Monitoring with the New Relic Browser (Tuts).
New Relic Synthetics allows you to conduct regular testing of your website anywhere in the world, notifying you immediately if issues arise. I'll be covering Synthetics in an upcoming tutorial, so visit my Tuts Instructor page to see when it's released.
Using New Relic with W3 Total Cache
I explained the registration and installation process for the W3 Total Cache New Relic service integration in this tutorial: Monitoring WordPress Performance with New Relic (Tuts).
In the WordPress admin console, click Performance > Monitoring. Click to register for a free account. Copy the API and license key details into the W3 Total Cache settings panel below:
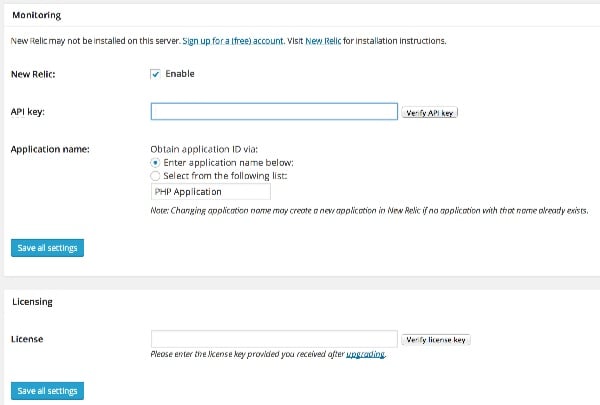
Enabling New Relic on the server can be monitored from the W3TC dashboard as shown below:
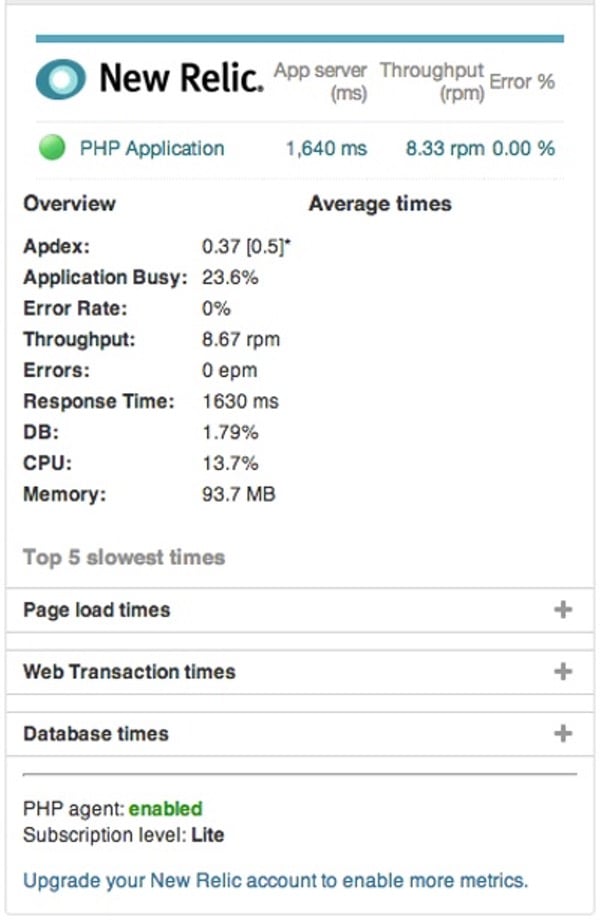
For more details, you can visit the New Relic website and log in to your account.
Monitor your WordPress performance
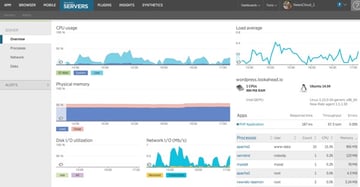
Evaluate server performance
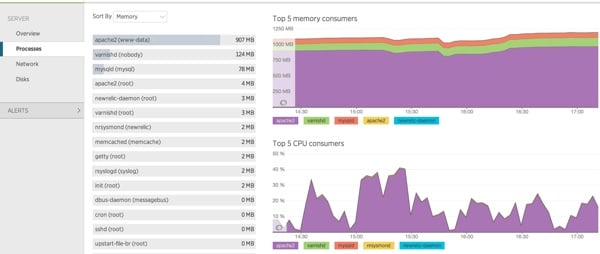
At a high level, New Relic Server monitoring gives you an overview of CPU usage, memory usage, disk and network I/O, as well as information about the hardware and most active processes. This gives you a bird's eye view of what's going on with your configuration and alerts you to any major issues:


The Processes tab shows memory and CPU utilization for each process:
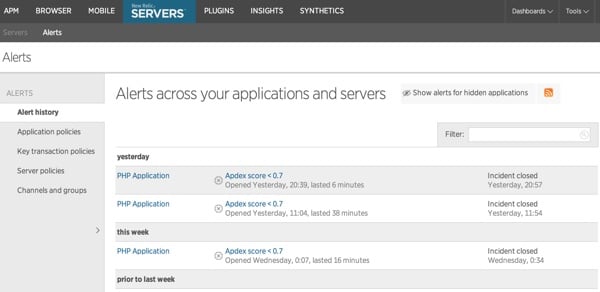
You can also view alert history that indicates red flags for your site’s performance:
Evaluate WordPress Performance
New Relic has three main ways to evaluate WordPress performance:
1. Apdex. New Relic uses Apdex scoring to help you evaluate how well your Wordpress application performs for end users against industry standard measurements. This helps you provide better data for troubleshooting and a clearer understanding of the percentage of users who are frustrated or satisfied. Apdex ratings also provide more specific context than a generic "site is slow" complaint, which may not even notify you until hours after the incident. Apdex also gives you a more objective way to measure how real users feel about performance improvements.
2. MySQL performance. WordPress plugins and themes can abuse your mySQL database. You can find out what's causing the problem by looking at Slow SQL in New Relic. For example, you may find that the selection on wp_terms for categories and tags may take up to 20% of the total database time. Alternatively, you may notice that slow INSERT statements could be improved with properly placed indexes or refining queries.
3. Monitor the performance of third-party plug-ins and APIs. It’s very easy to use social media plugins, monitoring plugins, and other cool widgets in WordPress, but it may not be obvious how these third-party dependencies affect your blog or blog marketing website. New Relic enables you to "aggregate" external service calls for a more comprehensive view, and you can also monitor the response times of these third parties within every web transaction captured by New Relic.
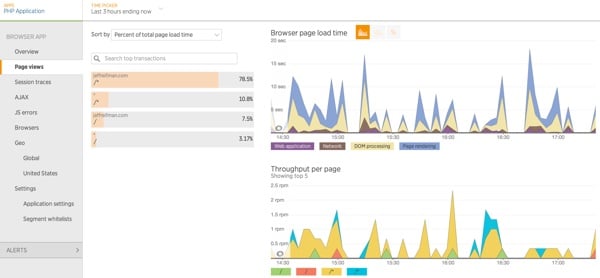
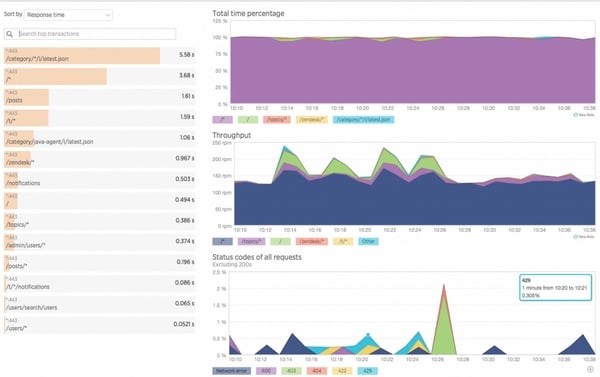
We can use New Relic’s browser to study WordPress performance in more detail. You'll want to specifically look for code from our themes and plugins that may negatively impact performance.
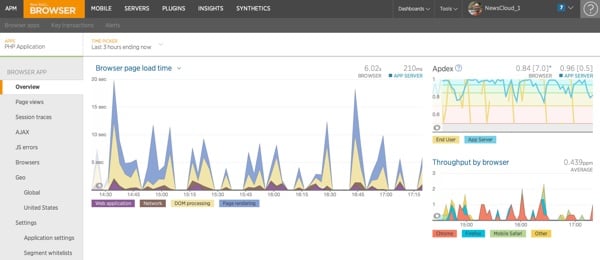
The dashboard gives you an overview of page load times broken down by Apdex and Throughput:
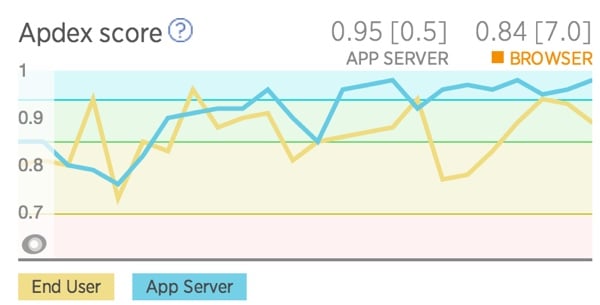
Here's a zoomed-in view of my Apdex scores over the past 24 hours:
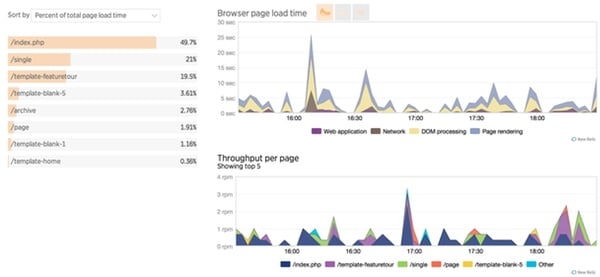
You can also view the performance by page views:
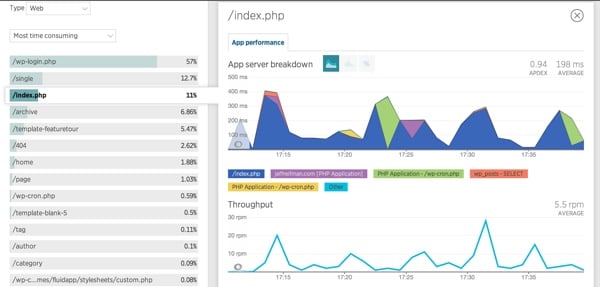
When you drill down, you can view the performance of individual files loaded by your website. You need to look for any theme or plugin files that take suspicious amounts of time:
MySQL Analysis
New Relic Server Monitoring can also track the performance of MySQL queries:
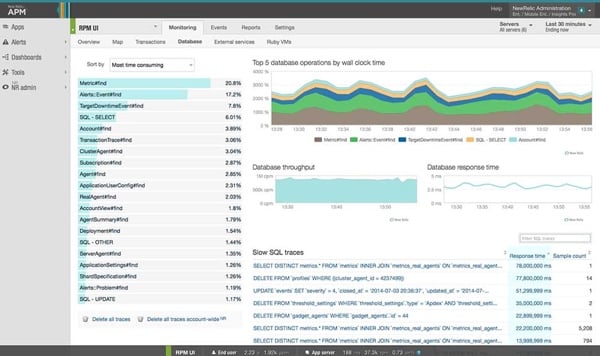
You can drill down for more details:
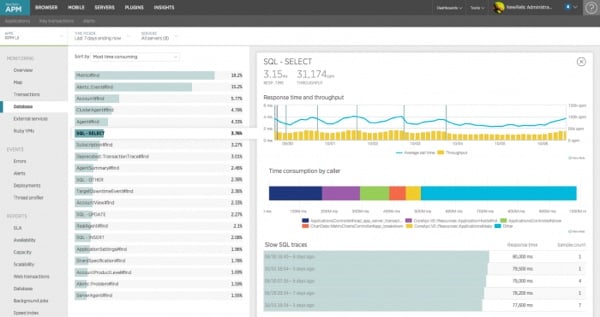
And diagnose the slowest query:
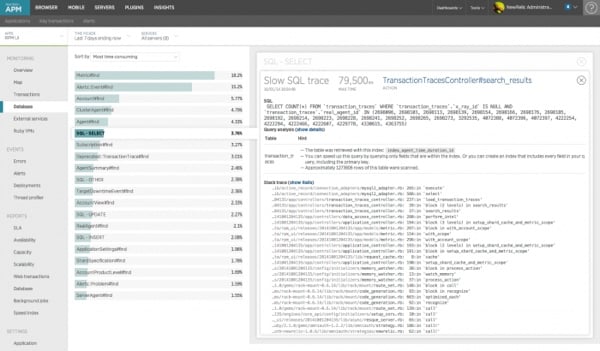
This is especially useful for identifying slow queries created by bad plugin code.
Session Tracking
Session tracking allows you to understand the entire life cycle of a web page, including user interactions, resource loading, iframes, time spent waiting for Ajax calls, errors, and more, tracking the real experience of real users from start to finish.
Tracing not only identifies the problem, it also shows you what actions the user took before and after the error occurred.
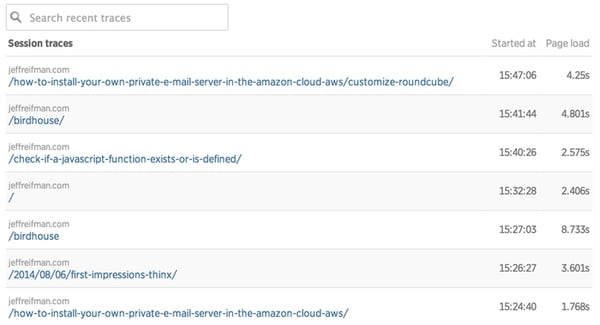
The following is a detailed drill-down of your session. This helps evaluate the performance of code in themes and plugins:
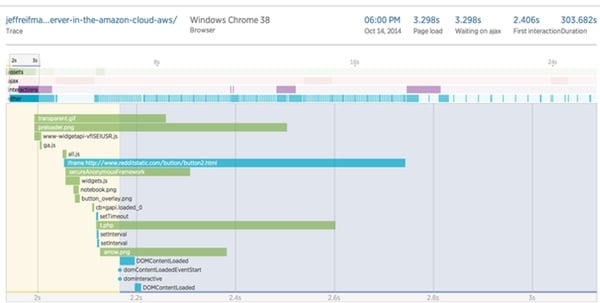
Session tracking helps you understand:
- How users experience page loading, including DOM load time, time waiting for Ajax requests to complete, and user interaction with the page
- The order of JavaScript and browser events (taking longer than other events) and when each event occurs
- Where the bottleneck occurs and what may cause it
- Why one page may load slower than others by providing context for individual events during a session
You can see exactly what is happening in a specific user's browser at any given moment. Session tracking gives you a detailed, intuitive visualization of all events in a user session, which can help pinpoint problem areas and easily identify solutions. Learn more about using session tracking.
Ajax and JavaScript
With an Ajax page, you can see what is happening with any interactive call on the page, helping to identify user experience issues when the call is taking a long time or failing:
Please note that the New Relic browser does not automatically log Ajax data. You need to turn it on for each application in the New Relic settings area. Learn more about Ajax dashboard.
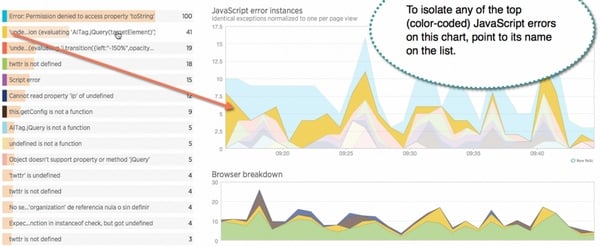
The Browser JavaScript Errors Dashboard lets you quickly see which errors are occurring in real-time production JavaScript over time and on which browsers. You can investigate errors based on the number of times each error occurs and the number of unique page loads that encounter the error.
This enables you to identify bugs that impact real user experience on your site; this is a particularly powerful way to learn about JavaScript bugs that don't appear in your own tests or on browsers that you may have excluded from your testbench .
Looking to the future
Self-hosted WordPress requires a high degree of technical skills. If you don't want to, managed hosting is a better option. Many of them use New Relic internally to optimize their websites, such as Page.ly.
Delving into New Relic takes time, but the results are worth it. Using this tool, you can look inside your WordPress stack to quickly identify problem areas that need to be addressed.
If you self-host, New Relic’s services provide an incredibly powerful way to learn about your own hosting environment, along with your WordPress stack, themes, and plugins, and tame the performance beast.
During your rollout process (and during your development process, if you're building your own themes and plugins), you'll definitely want to use New Relic to get a deeper understanding of your site.
While you can use New Relic Lite permanently, after the two-week trial is over, you may need to upgrade to the Pro plan ($149/month) to maintain the same level of service. New Relic Browser, Synthetics, and Insight all have their own pricing structures - to learn more, visit the New Relic website.
If you have any questions or corrections, please leave them in the comments. If you'd like to continue following my future Tuts tutorials and other series, please visit my instructor page or follow @reifman.
Related Links
- Use New Relic to monitor WordPress performance (Tuts)
- Optimize WordPress (Tuts) using Varnish and W3 Total Cache
- Use the new Relic browser for front-end monitoring (Tuts)
- Register NewRelic on the W3 Total Cache partner page
- Use New Relic to optimize WordPress performance
The above is the detailed content of Diagnose WordPress performance issues with new relics. For more information, please follow other related articles on the PHP Chinese website!

Hot AI Tools

Undresser.AI Undress
AI-powered app for creating realistic nude photos

AI Clothes Remover
Online AI tool for removing clothes from photos.

Undress AI Tool
Undress images for free

Clothoff.io
AI clothes remover

AI Hentai Generator
Generate AI Hentai for free.

Hot Article
Hot Tools

Notepad++7.3.1
Easy-to-use and free code editor

SublimeText3 Chinese version
Chinese version, very easy to use

Zend Studio 13.0.1
Powerful PHP integrated development environment

Dreamweaver CS6
Visual web development tools

SublimeText3 Mac version
God-level code editing software (SublimeText3)
Hot Topics
 1386
1386
 52
52

 PHP vs. Flutter: The best choice for mobile development
May 06, 2024 pm 10:45 PM
PHP vs. Flutter: The best choice for mobile development
May 06, 2024 pm 10:45 PM
PHP and Flutter are popular technologies for mobile development. Flutter excels in cross-platform capabilities, performance and user interface, and is suitable for applications that require high performance, cross-platform and customized UI. PHP is suitable for server-side applications with lower performance and not cross-platform.
 How to change page width in wordpress
Apr 16, 2024 am 01:03 AM
How to change page width in wordpress
Apr 16, 2024 am 01:03 AM
You can easily modify your WordPress page width by editing your style.css file: Edit your style.css file and add .site-content { max-width: [your preferred width]; }. Edit [your preferred width] to set the page width. Save changes and clear cache (optional).
 In which folder are wordpress articles located?
Apr 16, 2024 am 10:29 AM
In which folder are wordpress articles located?
Apr 16, 2024 am 10:29 AM
WordPress posts are stored in the /wp-content/uploads folder. This folder uses subfolders to categorize different types of uploads, including articles organized by year, month, and article ID. Article files are stored in plain text format (.txt), and the filename usually includes its ID and title.
 How to create a product page in wordpress
Apr 16, 2024 am 12:39 AM
How to create a product page in wordpress
Apr 16, 2024 am 12:39 AM
Create a product page in WordPress: 1. Create the product (name, description, pictures); 2. Customize the page template (add title, description, pictures, buttons); 3. Enter product information (stock, size, weight); 4 . Create variations (different colors, sizes); 5. Set visibility (public or hidden); 6. Enable/disable comments; 7. Preview and publish the page.
 Where is the wordpress template file?
Apr 16, 2024 am 11:00 AM
Where is the wordpress template file?
Apr 16, 2024 am 11:00 AM
WordPress template files are located in the /wp-content/themes/[theme name]/ directory. They are used to determine the appearance and functionality of the website, including header (header.php), footer (footer.php), main template (index.php), single article (single.php), page (page.php), Archive (archive.php), category (category.php), tag (tag.php), search (search.php) and 404 error page (404.php). By editing and modifying these files, you can customize the appearance of your WordPress website
 How to search for authors in WordPress
Apr 16, 2024 am 01:18 AM
How to search for authors in WordPress
Apr 16, 2024 am 01:18 AM
Search for authors in WordPress: 1. Once logged in to your admin panel, navigate to Posts or Pages, enter the author name using the search bar, and select Author in Filters. 2. Other tips: Use wildcards to broaden your search, use operators to combine criteria, or enter author IDs to search for articles.
 Which version of wordpress is stable?
Apr 16, 2024 am 10:54 AM
Which version of wordpress is stable?
Apr 16, 2024 am 10:54 AM
The most stable WordPress version is the latest version because it contains the latest security patches, performance enhancements, and introduces new features and improvements. In order to update to the latest version, log into your WordPress dashboard, go to the Updates page and click Update Now.
 Does wordpress need to be registered?
Apr 16, 2024 pm 12:07 PM
Does wordpress need to be registered?
Apr 16, 2024 pm 12:07 PM
WordPress requires registration. According to my country's "Internet Security Management Measures", websites that provide Internet information services within the country must register with the local provincial Internet Information Office, including WordPress. The registration process includes steps such as selecting a service provider, preparing information, submitting an application, reviewing and publishing, and obtaining a registration number. The benefits of filing include legal compliance, improving credibility, meeting access requirements, ensuring normal access, etc. The filing information must be true and valid, and must be updated regularly after filing.
