Collect MySQL statistics and metrics
Aug 27, 2023 am 11:05 AMIn this article, we will learn how to collect Mysql statistics and metrics.
Performance Dashboard
View statistics about server performance in the dashboard. Open the Query tab, select the Administration tab, and click Dashboards in the Performance section of the Navigator sidebar to display the dashboard. The following figure describes the information structure of the Administration - Dashboard tab.
Performance: Dashboard
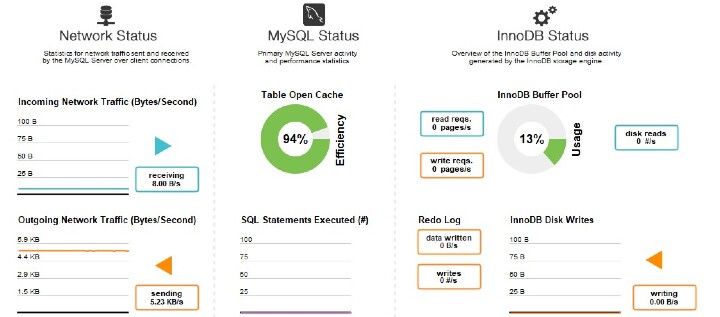
network status
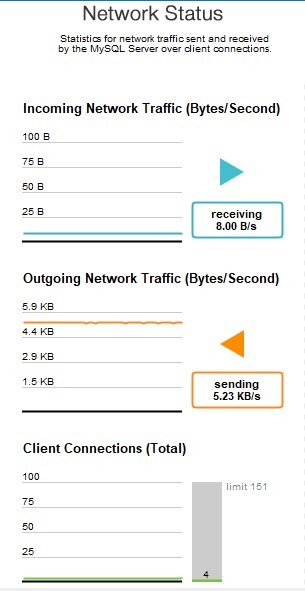
This displays network traffic data transmitted and received by the MySQL server over client connections. Incoming network traffic, outgoing network traffic, and client connections are all examples of data points.
MySQL Status
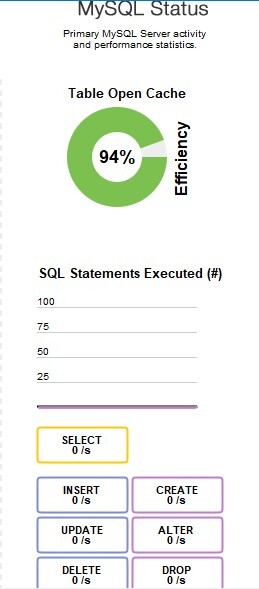
This displays key performance and activity metrics for the MySQL server. Data items include table open cache validity, number of SQL statements executed, and SELECT, INSERT, UPDATE, DELETE, CREATE, ALTER, and DROP statement counts (per second).
InnoDB Status
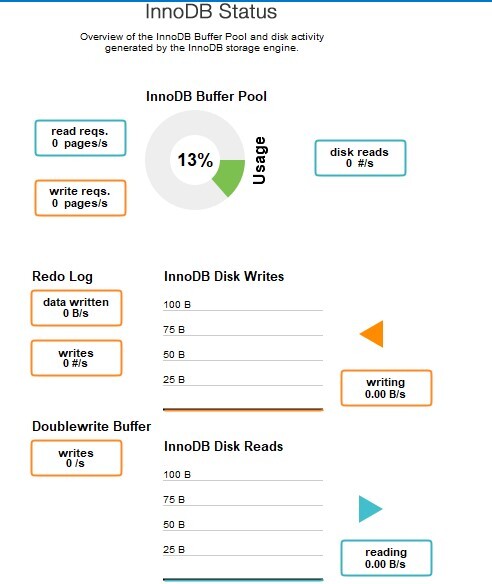
This gives a general overview of the disk activity generated by the InnoDB storage engine and the InnoDB buffer pool. Create three sets of data points -
Notice
To show more details, such as totals, hover your cursor over the chart.
usage
Number of read requests: The number of logical read requests InnoDB sends to the buffer pool per second.
Number of write requests: The number of logical write requests sent by InnoDB to the buffer pool (per second).
The number of logical reads (in disk reads) that InnoDB could not satisfy from the buffer pool. These must therefore be read from the disc.
The number of InnoDB buffer pools currently in use. You can hover your mouse over the graph to see more details, such as usage and the number of pages available.
Write
Written data - The total amount of writes to InnoDB redo log files.
Writes - Actual number of writes to InnoDB redo log files
InnoDB Disk Writes: Move your cursor over this dynamic graph to observe the number of disk writes that occurred in a specific second. The range includes the previous 120 seconds.
Writes - The total amount of data (in bytes) written by the InnoDB storage engine using file operations.
Read
Doublewrite Buffer Writes - The total amount of double write operations.
InnoDB Disk Reads - Move your cursor over this dynamic graph to observe the number of disk reads that occurred in a specific second. The range includes the previous 120 seconds.
Reads - The total amount of data (in bytes) read from the file by the InnoDB storage engine.
Performance Architecture Report
Gain insight into MySQL server operations with practical, advanced reports based on performance patterns. To analyze the performance of MySQL databases, MySQL Workbench generates more than 20 reports using the SYS view on the performance schema. Reports help identify costly SQL statements, analyze IO hotspots, and view wait data and InnoDB engine characteristics. For more details about the SYS schema, see MySQL sys Schema.
Configuration and Installation
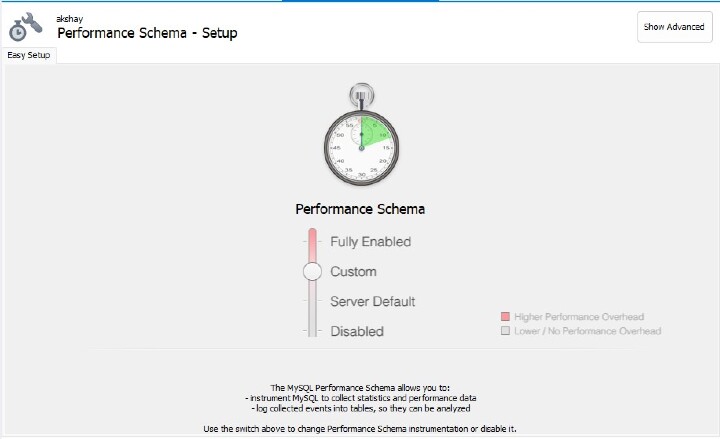
Graphical user interface for customizing and optimizing performance architecture tools (see image below). This will initially load an "Easy Settings" tab, which will be enough for most people. Hold the pointer over Fully Enabled and click the circle on the slider to activate each performance architecture tool currently accessible.
MySQL Workbench uses MySQL Server version 5.7 and includes the SYS schema by default. However, Workbench installs its own bundled version of the SYS schema for MySQL Server 5.6.
Note - MySQL Server chooses the size of the saved summary query.
Performance Architecture Settings: Simple
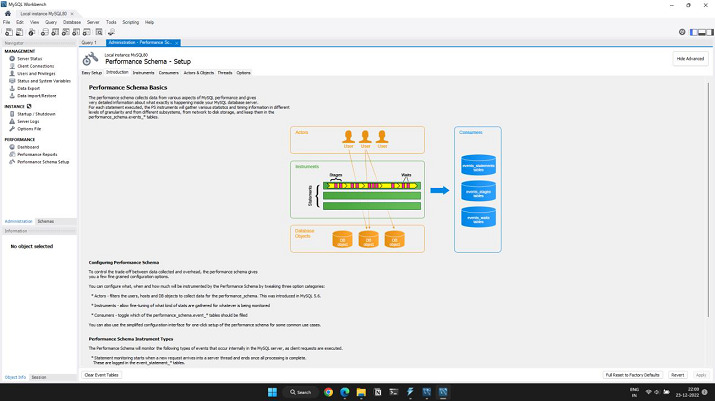
Performance architecture detection can be fine-tuned by clicking Show Advanced. In the figure below, the "Introduction" tab and the Advanced Detection tab are selected.
Settings for Performance Architecture: Introduction
The above is the detailed content of Collect MySQL statistics and metrics. For more information, please follow other related articles on the PHP Chinese website!

Hot Article

Hot tools Tags

Hot Article

Hot Article Tags

Notepad++7.3.1
Easy-to-use and free code editor

SublimeText3 Chinese version
Chinese version, very easy to use

Zend Studio 13.0.1
Powerful PHP integrated development environment

Dreamweaver CS6
Visual web development tools

SublimeText3 Mac version
God-level code editing software (SublimeText3)

Hot Topics
 Reduce the use of MySQL memory in Docker
Mar 04, 2025 pm 03:52 PM
Reduce the use of MySQL memory in Docker
 How do you alter a table in MySQL using the ALTER TABLE statement?
Mar 19, 2025 pm 03:51 PM
How do you alter a table in MySQL using the ALTER TABLE statement?
 How to solve the problem of mysql cannot open shared library
Mar 04, 2025 pm 04:01 PM
How to solve the problem of mysql cannot open shared library
 What is SQLite? Comprehensive overview
Mar 04, 2025 pm 03:55 PM
What is SQLite? Comprehensive overview
 Run MySQl in Linux (with/without podman container with phpmyadmin)
Mar 04, 2025 pm 03:54 PM
Run MySQl in Linux (with/without podman container with phpmyadmin)
 Running multiple MySQL versions on MacOS: A step-by-step guide
Mar 04, 2025 pm 03:49 PM
Running multiple MySQL versions on MacOS: A step-by-step guide
 What are some popular MySQL GUI tools (e.g., MySQL Workbench, phpMyAdmin)?
Mar 21, 2025 pm 06:28 PM
What are some popular MySQL GUI tools (e.g., MySQL Workbench, phpMyAdmin)?
 How do I secure MySQL against common vulnerabilities (SQL injection, brute-force attacks)?
Mar 18, 2025 pm 12:00 PM
How do I secure MySQL against common vulnerabilities (SQL injection, brute-force attacks)?


