
 Backend Development
Python Tutorial
Regression analysis and best fit straight line using Python
Backend Development
Python Tutorial
Regression analysis and best fit straight line using Python
Regression analysis and best fit straight line using Python

In this tutorial, we will use Python programming to implement regression analysis and best-fit lines
Introduction
Regression analysis is the most basic form of predictive analysis.
In statistics, linear regression is a method of modeling the relationship between a scalar value and one or more explanatory variables.
In machine learning, linear regression is a supervised algorithm. This algorithm predicts a target value based on independent variables.
More information about linear regression and regression analysis
In linear regression/analysis, the target is a real or continuous value such as salary, BMI, etc. It is often used to predict the relationship between a dependent variable and a set of independent variables. These models typically fit linear equations, however, there are other types of regression, including higher-order polynomials.
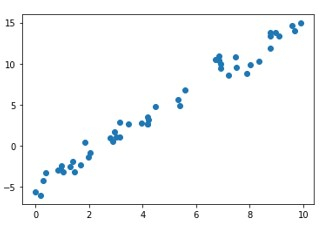
Before fitting a linear model to the data, it is necessary to check whether there is a linear relationship between the data points. This is evident from their scatter plot. The goal of the algorithm/model is to find the line of best fit.
In this article, we will explore linear regression analysis and its implementation using C.
The form of the linear regression equation is Y = c mx, where Y is the target variable and X is the independent variable or explanatory parameter/variable. m is the slope of the regression line and c is the intercept. Since this is a 2D regression task, the model tries to find the line of best fit during training. All points don't have to line up exactly on the same line. Some data points may lie on the line, and some may be scattered across the line. The vertical distance between the line and the data points is the residual. The value can be negative or positive depending on whether the point is below or above the line. The residual is a measure of how well the line fits the data. The algorithm is continuous to minimize the total residual.
The residual for each observation is the difference between the predicted value of y (the dependent variable) and the observed value of y
$$\mathrm{residual\: =\:actual\:y\:value\:−\:forecast\:y\:value}$$
$$\mathrm{ri\:=\:yi\:−\:y'i}$$
The most common metric for evaluating the performance of a linear regression model is called the root mean square error, or RMSE. The basic idea is to measure how bad/wrong the model's predictions are compared to actual observations.
Therefore, high RMSE is "bad" and low RMSE is "good"
RMSE error is
$$\mathrm{RMSE\:=\:\sqrt{\frac{\sum_i^n=1\:(this\:-\:this')^2}{n}}}$$ p>
RMSE is the root of the mean square of all residuals.
Using Python to implement
Example
# Import the libraries
import numpy as np
import math
import matplotlib.pyplot as plt
from sklearn.linear_model import LinearRegression
from sklearn.metrics import mean_squared_error
# Generate random data with numpy, and plot it with matplotlib:
ranstate = np.random.RandomState(1)
x = 10 * ranstate.rand(100)
y = 2 * x - 5 + ranstate.randn(100)
plt.scatter(x, y);
plt.show()
# Creating a linear regression model based on the positioning of the data and Intercepting, and predicting a Best Fit:
lr_model = LinearRegression(fit_intercept=True)
lr_model.fit(x[:70, np.newaxis], y[:70])
y_fit = lr_model.predict(x[70:, np.newaxis])
mse = mean_squared_error(y[70:], y_fit)
rmse = math.sqrt(mse)
print("Mean Square Error : ",mse)
print("Root Mean Square Error : ",rmse)
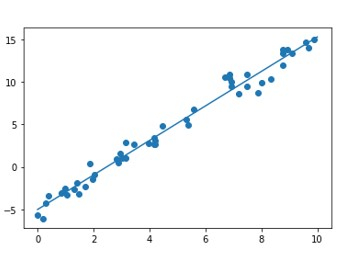
# Plot the estimated linear regression line using matplotlib:
plt.scatter(x, y)
plt.plot(x[70:], y_fit);
plt.show()
Output
Mean Square Error : 1.0859922470998231 Root Mean Square Error : 1.0421095178050257
in conclusion
Regression analysis is a very simple yet powerful technique used for predictive analysis in machine learning and statistics. The idea lies in its simplicity and the underlying linear relationship between the independent and target variables.
The above is the detailed content of Regression analysis and best fit straight line using Python. For more information, please follow other related articles on the PHP Chinese website!

Hot AI Tools

Undresser.AI Undress
AI-powered app for creating realistic nude photos

AI Clothes Remover
Online AI tool for removing clothes from photos.

Undress AI Tool
Undress images for free

Clothoff.io
AI clothes remover

Video Face Swap
Swap faces in any video effortlessly with our completely free AI face swap tool!

Hot Article
Hot Tools

Notepad++7.3.1
Easy-to-use and free code editor

SublimeText3 Chinese version
Chinese version, very easy to use

Zend Studio 13.0.1
Powerful PHP integrated development environment

Dreamweaver CS6
Visual web development tools

SublimeText3 Mac version
God-level code editing software (SublimeText3)
Hot Topics
 1387
1387
 52
52

 Residual analysis techniques in Python
Jun 10, 2023 am 08:52 AM
Residual analysis techniques in Python
Jun 10, 2023 am 08:52 AM
Python is a widely used programming language, and its powerful data analysis and visualization capabilities make it one of the preferred tools for data scientists and machine learning engineers. In these applications, residual analysis is a common technique used to evaluate model accuracy and identify any model bias. In this article, we will introduce several ways to use residual analysis techniques in Python. Understanding Residuals Before introducing residual analysis techniques in Python, let us first understand what residuals are. In statistics, the residual is the difference between the actual observed value and
 AssertionError: How to resolve Python assertion errors?
Jun 25, 2023 pm 11:07 PM
AssertionError: How to resolve Python assertion errors?
Jun 25, 2023 pm 11:07 PM
Assertions in Python are a useful tool for programmers to debug their code. It is used to verify that the internal state of the program meets expectations and raise an assertion error (AssertionError) when these conditions are false. During the development process, assertions are used during testing and debugging to check whether the status of the code matches the expected results. This article will discuss the causes, solutions, and how to correctly use assertions in your code. Cause of assertion error Assertion error pass
 Stratified sampling techniques in Python
Jun 10, 2023 pm 10:40 PM
Stratified sampling techniques in Python
Jun 10, 2023 pm 10:40 PM
Stratified Sampling Technique in Python Sampling is a commonly used data collection method in statistics. It can select a portion of samples from the data set for analysis to infer the characteristics of the entire data set. In the era of big data, the amount of data is huge, and using full samples for analysis is both time-consuming and not economically practical. Therefore, choosing an appropriate sampling method can improve the efficiency of data analysis. This article mainly introduces stratified sampling techniques in Python. What is stratified sampling? In sampling, stratified sampling
 How to develop a vulnerability scanner in Python
Jul 01, 2023 am 08:10 AM
How to develop a vulnerability scanner in Python
Jul 01, 2023 am 08:10 AM
Overview of how to develop a vulnerability scanner through Python In today's environment of increasing Internet security threats, vulnerability scanners have become an important tool for protecting network security. Python is a popular programming language that is concise, easy to read and powerful, suitable for developing various practical tools. This article will introduce how to use Python to develop a vulnerability scanner to provide real-time protection for your network. Step 1: Determine Scan Targets Before developing a vulnerability scanner, you need to determine what targets you want to scan. This can be your own network or anything you have permission to test
 How to use Python for scripting and execution in Linux
Oct 05, 2023 am 11:45 AM
How to use Python for scripting and execution in Linux
Oct 05, 2023 am 11:45 AM
How to use Python to write and execute scripts in Linux In the Linux operating system, we can use Python to write and execute various scripts. Python is a concise and powerful programming language that provides a wealth of libraries and tools to make scripting easier and more efficient. Below we will introduce the basic steps of how to use Python for script writing and execution in Linux, and provide some specific code examples to help you better understand and use it. Install Python
 Usage of sqrt() function in Python
Feb 21, 2024 pm 03:09 PM
Usage of sqrt() function in Python
Feb 21, 2024 pm 03:09 PM
Usage and code examples of the sqrt() function in Python 1. Function and introduction of the sqrt() function In Python programming, the sqrt() function is a function in the math module, and its function is to calculate the square root of a number. The square root means that a number multiplied by itself equals the square of the number, that is, x*x=n, then x is the square root of n. The sqrt() function can be used in the program to calculate the square root. 2. How to use the sqrt() function in Python, sq
 Teach you how to use Python programming to realize the docking of Baidu image recognition interface and realize the image recognition function.
Aug 25, 2023 pm 03:10 PM
Teach you how to use Python programming to realize the docking of Baidu image recognition interface and realize the image recognition function.
Aug 25, 2023 pm 03:10 PM
Teach you to use Python programming to implement the docking of Baidu's image recognition interface and realize the image recognition function. In the field of computer vision, image recognition technology is a very important technology. Baidu provides a powerful image recognition interface through which we can easily implement image classification, labeling, face recognition and other functions. This article will teach you how to use the Python programming language to realize the image recognition function by connecting to the Baidu image recognition interface. First, we need to create an application on Baidu Developer Platform and obtain
 Python programming practice: How to use Baidu Map API to generate static map functions
Jul 30, 2023 pm 09:05 PM
Python programming practice: How to use Baidu Map API to generate static map functions
Jul 30, 2023 pm 09:05 PM
Python programming practice: How to use Baidu Map API to generate static map functions Introduction: In modern society, maps have become an indispensable part of people's lives. When working with maps, we often need to obtain a static map of a specific area for display on a web page, mobile app, or report. This article will introduce how to use the Python programming language and Baidu Map API to generate static maps, and provide relevant code examples. 1. Preparation work To realize the function of generating static maps using Baidu Map API, I
