Query statistics in MySQL
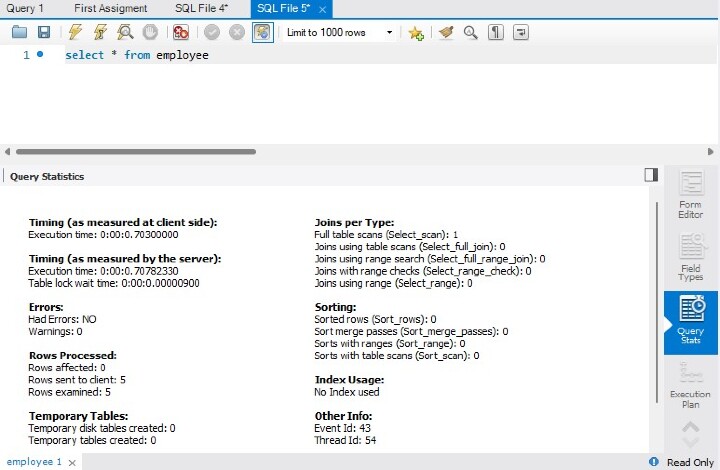
Important statistics collected for the executed query, including time, temporary tables, indexes, joins, etc., are collected in the "Query Statistics SQL Editor Results" tab (see the following two images).
Require
Enable queries and collect performance schema statistics.
performance_schema Statement detection enabled.
SQL Editor: Query Statistics

Visual Interpretation Plan
The Visual Explanation feature creates and presents a visual description of a MySQL EXPLAIN statement by leveraging additional data contained in the enhanced JSON format. All EXPLAIN formats, including standard format, raw extended JSON, and visual query plans, can be used to execute queries in MySQL Workbench.
Intuitive demonstration of use
Execute the query in the SQL Editor and select Execution Procedure from the query results menu to receive a visual description of the execution plan. In addition to the default visual explain view, the execution plan also contains a tabular explain view, similar to what you see when you run EXPLAIN in the MySQL client. For more information about how MySQL executes statements, see Optimizing Queries Using EXPLAIN.
Visual explanation convention
Visual explanation diagrams should be read from bottom to top, left to right. An overview of the graphical, textual, and informational conventions used to represent the various elements of a visual interpretation plan is given in the diagram example below. For more details, see -
Graphics Standard
Information and text conventions
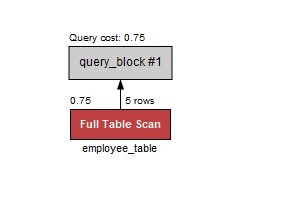
Visual explanation of the first graph The graph provides a visual description of the following query.
select * FROM employee_table
Visual explanation example

Graphic convention
Standard box: table
Rounded corner box: GROUP and SORT operations
Frame Box: Subquery
Diamond: Connection
Text and information conventions
Standard text below box: Table (or alias) name
Bold text below box: Key/index used
The number in the upper right corner of the box: the number of rows used in the filtered table
The number in the upper left corner of the box: the relative cost of accessing the table (requires MySQL 5.7 or higher)
The number on the right side of the nested loop (or hash join) diamond: the number of rows generated by the JOIN
Number above diamond: relative cost of JOIN (requires MySQL 5.7 or higher)
The following table shows the relevant colors and descriptions used in visual interpretation diagrams. For more information about cost estimates, see Optimizer Cost Model.
Visual explanation chart information
system name |
color |
Text on visualization chart |
Tooltip related information |
|---|---|---|---|
system |
blue |
Single line: system constant |
The cost is very low |
constant |
blue |
Single line: constant |
The cost is very low |
EQ_REF |
green |
Unique key lookup |
Low Cost - The optimizer is able to find an index that can be used to retrieve the required records. It's fast because the index search points directly to the page containing all rows of data |
refer to |
green |
Non-unique key lookup |
Low-Medium -- Low if there are fewer matching rows; higher as the number of rows increases |
full text |
yellow |
Full text index search |
Dedicated full-text search. Low - for this specialized search requirement |
REF_OR_NULL |
green |
Search by key to get NULL value |
Low-medium - if the number of matched rows is small; higher as the number of rows increases |
INDEX_MERGE |
green |
Index merge |
Medium - Looking for better index choices in queries to improve performance |
UNIQUE_SUBQUERY |
orange color |
Unique key lookup in subquery table |
Low -- for efficient subquery processing |
INDEX_SUBQUERY |
orange color |
Non-unique key lookup in subquery table |
Low -- for efficient subquery processing |
scope |
orange color |
Index range scan |
Medium -- Partial index scan |
index |
red |
Full index scan |
High - especially for large indexes |
all |
red |
Full table scan |
Very High - Very high cost for large tables, but less impact for small tables. No free index is found for the table, forcing the optimizer to search every row. It may also mean that the search is too broad and the index will be useless. |
unknown |
black |
unknown |
Note: This is the default value in case a match cannot be determined |
in conclusion
In this article, we learned how to get query statistics in MySQL Workbench and what different characteristics it has at the same time.
The above is the detailed content of Query statistics in MySQL. For more information, please follow other related articles on the PHP Chinese website!

Hot AI Tools

Undresser.AI Undress
AI-powered app for creating realistic nude photos

AI Clothes Remover
Online AI tool for removing clothes from photos.

Undress AI Tool
Undress images for free

Clothoff.io
AI clothes remover

AI Hentai Generator
Generate AI Hentai for free.

Hot Article

Hot Tools

Notepad++7.3.1
Easy-to-use and free code editor

SublimeText3 Chinese version
Chinese version, very easy to use

Zend Studio 13.0.1
Powerful PHP integrated development environment

Dreamweaver CS6
Visual web development tools

SublimeText3 Mac version
God-level code editing software (SublimeText3)

Hot Topics
 How do you alter a table in MySQL using the ALTER TABLE statement?
Mar 19, 2025 pm 03:51 PM
The article discusses using MySQL's ALTER TABLE statement to modify tables, including adding/dropping columns, renaming tables/columns, and changing column data types.
 How do I configure SSL/TLS encryption for MySQL connections?
Mar 18, 2025 pm 12:01 PM
Article discusses configuring SSL/TLS encryption for MySQL, including certificate generation and verification. Main issue is using self-signed certificates' security implications.[Character count: 159]
 How do you handle large datasets in MySQL?
Mar 21, 2025 pm 12:15 PM
Article discusses strategies for handling large datasets in MySQL, including partitioning, sharding, indexing, and query optimization.
 What are some popular MySQL GUI tools (e.g., MySQL Workbench, phpMyAdmin)?
Mar 21, 2025 pm 06:28 PM
Article discusses popular MySQL GUI tools like MySQL Workbench and phpMyAdmin, comparing their features and suitability for beginners and advanced users.[159 characters]
 How do you drop a table in MySQL using the DROP TABLE statement?
Mar 19, 2025 pm 03:52 PM
The article discusses dropping tables in MySQL using the DROP TABLE statement, emphasizing precautions and risks. It highlights that the action is irreversible without backups, detailing recovery methods and potential production environment hazards.
 How do you represent relationships using foreign keys?
Mar 19, 2025 pm 03:48 PM
Article discusses using foreign keys to represent relationships in databases, focusing on best practices, data integrity, and common pitfalls to avoid.
 How do you create indexes on JSON columns?
Mar 21, 2025 pm 12:13 PM
The article discusses creating indexes on JSON columns in various databases like PostgreSQL, MySQL, and MongoDB to enhance query performance. It explains the syntax and benefits of indexing specific JSON paths, and lists supported database systems.
 How do I secure MySQL against common vulnerabilities (SQL injection, brute-force attacks)?
Mar 18, 2025 pm 12:00 PM
Article discusses securing MySQL against SQL injection and brute-force attacks using prepared statements, input validation, and strong password policies.(159 characters)


