

Draw contour plots using Python Matplotlib

Matplotlib is a free and open source plotting library in Python. It is used to create 2D graphics and plots by using python scripts. To use matplotlib functionality, we need to install the library first.
Install using pip
We can easily install the latest stable package of Matplotlib from PyPi by executing the following command in the command prompt.
pip install Matplotlib
You can install Matplotlib via conda using the following command -
conda install -c conda-forge matplotlib
Contour plot is used to visualize three-dimensional data in a two-dimensional surface by plotting constant z slices, called contours.
It is plotted with the help of the contour function (Z) which is a function of two inputs X and Y (X and Y axis coordinates).
Z = fun(x,y)
Matplotlib provides two functions plt.contour and plt.contourf to draw contour plots.
contour() method
matplotlib.pyplot. The outline() method is used to draw outline lines. It returns QuadContourSet. The following is the syntax of the function -
contour([X, Y,] Z, [levels], **kwargs)
parameter
[X,Y]: Optional parameter, indicating the coordinate of the Z value.
Z: The height value of the drawn outline.
levels: Used to determine the number and location of contour lines/areas.
Example
Let us take an example of drawing contour lines using numpy trigonometric functions.
import numpy as np
import matplotlib.pyplot as plt

def f(x, y):
   return np.sin(x) ** 10 + np.cos(10 + y * x) * np.cos(x)

xlist = np.linspace(-4.0, 4.0, 800)
ylist = np.linspace(-4.0, 4.0, 800)

# A mesh is created with the given co-ordinates by this numpy function
X, Y = np.meshgrid(xlist, ylist)
Z = f(X,Y)

fig = plt.figure()
ax = fig.add_axes([0.1, 0.1, 0.8, 0.8])

cp = ax.contour(X, Y, Z)
fig.colorbar(cp) # Add a colorbar to a plot
ax.set_title('Contour Plot')

ax.set_xlabel('x (cm)')
ax.set_ylabel('y (cm)')
plt.show()
Output
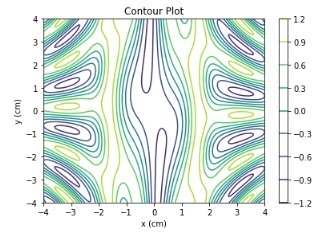
The f(x,y) function is defined using numpy trigonometric functions.
Example
Let’s take another example and draw contour lines.
import numpy as np
import matplotlib.pyplot as plt

def f(x, y):
    return np.sqrt(X**2 + Y**2)

xlist = np.linspace(-10, 10, 400)
ylist = np.linspace(-10, 10, 400)

# create a mesh
X, Y = np.meshgrid(xlist, ylist)

Z = f(X, Y)

fig = plt.figure(figsize=(6,5))
ax = fig.add_axes([0.1, 0.1, 0.8, 0.8])

cp = ax.contour(X, Y, Z)
ax.set_title('Contour Plot')
ax.set_xlabel('x (cm)')
ax.set_ylabel('y (cm)')
plt.show()
Output
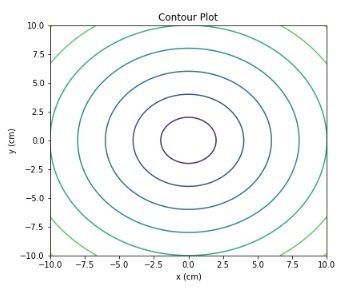
The z function is the sum of the square roots of the x and y coordinate values. Implemented using the numpy.sqrt() function.
contourf() function
matplotlib.pyplot provides a method contourf() to draw filled contours. The following is the syntax of the function -
contourf([X, Y,] Z, [levels], **kwargs)
where,
[X,Y]: Optional parameter, indicating the coordinate of the Z value.
Z: The height value of the drawn outline.
levels: Used to determine the number and location of contour lines/areas.
Example
Let us take another example and use the contourf() method to draw a contour map.
import numpy as np
import matplotlib.pyplot as plt

xlist = np.linspace(-8, 8, 800)
ylist = np.linspace(-8, 8, 800)

X, Y = np.meshgrid(xlist, ylist)
Z = np.sqrt(X**2 + Y**2)

fig = plt.figure(figsize=(6,5))
ax = fig.add_axes([0.1, 0.1, 0.8, 0.8])

cp = ax.contourf(X, Y, Z)
fig.colorbar(cp) # Add a colorbar to a plot
ax.set_title('Filled Contours Plot')
#ax.set_xlabel('x (cm)')
ax.set_ylabel('y (cm)')
plt.show()
Output
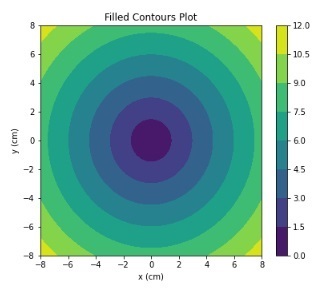
Using the fig.colorbar() method, we add color to the drawing. The z function is the sum of the square roots of the x and y coordinate values.
Example
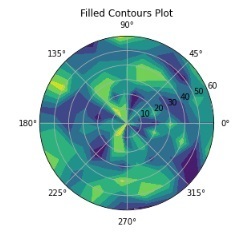
In this example, we will use the matplotlib.plt.contourf() method to plot a polar contour plot.
import numpy as np
import matplotlib.pyplot as plt

a = np.radians(np.linspace(0, 360, 20))
b = np.arange(0, 70, 10)

Y, X = np.meshgrid(b, a)
values = np.random.random((a.size, b.size))

fig, ax = plt.subplots(subplot_kw=dict(projection='polar'))
ax.set_title('Filled Contours Plot')
ax.contourf(X, Y, values)

plt.show()
Output
In all the above examples, we used the numpy.meshgrid() function to generate arrays of X and Y coordinates.
The above is the detailed content of Draw contour plots using Python Matplotlib. For more information, please follow other related articles on the PHP Chinese website!

Hot AI Tools

Undresser.AI Undress
AI-powered app for creating realistic nude photos

AI Clothes Remover
Online AI tool for removing clothes from photos.

Undress AI Tool
Undress images for free

Clothoff.io
AI clothes remover

Video Face Swap
Swap faces in any video effortlessly with our completely free AI face swap tool!

Hot Article
Hot Tools

Notepad++7.3.1
Easy-to-use and free code editor

SublimeText3 Chinese version
Chinese version, very easy to use

Zend Studio 13.0.1
Powerful PHP integrated development environment

Dreamweaver CS6
Visual web development tools

SublimeText3 Mac version
God-level code editing software (SublimeText3)
Hot Topics
 1387
1387
 52
52

 How to solve the permissions problem encountered when viewing Python version in Linux terminal?
Apr 01, 2025 pm 05:09 PM
How to solve the permissions problem encountered when viewing Python version in Linux terminal?
Apr 01, 2025 pm 05:09 PM
Solution to permission issues when viewing Python version in Linux terminal When you try to view Python version in Linux terminal, enter python...
 How to efficiently copy the entire column of one DataFrame into another DataFrame with different structures in Python?
Apr 01, 2025 pm 11:15 PM
How to efficiently copy the entire column of one DataFrame into another DataFrame with different structures in Python?
Apr 01, 2025 pm 11:15 PM
When using Python's pandas library, how to copy whole columns between two DataFrames with different structures is a common problem. Suppose we have two Dats...
 How to teach computer novice programming basics in project and problem-driven methods within 10 hours?
Apr 02, 2025 am 07:18 AM
How to teach computer novice programming basics in project and problem-driven methods within 10 hours?
Apr 02, 2025 am 07:18 AM
How to teach computer novice programming basics within 10 hours? If you only have 10 hours to teach computer novice some programming knowledge, what would you choose to teach...
 How to avoid being detected by the browser when using Fiddler Everywhere for man-in-the-middle reading?
Apr 02, 2025 am 07:15 AM
How to avoid being detected by the browser when using Fiddler Everywhere for man-in-the-middle reading?
Apr 02, 2025 am 07:15 AM
How to avoid being detected when using FiddlerEverywhere for man-in-the-middle readings When you use FiddlerEverywhere...
 How does Uvicorn continuously listen for HTTP requests without serving_forever()?
Apr 01, 2025 pm 10:51 PM
How does Uvicorn continuously listen for HTTP requests without serving_forever()?
Apr 01, 2025 pm 10:51 PM
How does Uvicorn continuously listen for HTTP requests? Uvicorn is a lightweight web server based on ASGI. One of its core functions is to listen for HTTP requests and proceed...
 What are some popular Python libraries and their uses?
Mar 21, 2025 pm 06:46 PM
What are some popular Python libraries and their uses?
Mar 21, 2025 pm 06:46 PM
The article discusses popular Python libraries like NumPy, Pandas, Matplotlib, Scikit-learn, TensorFlow, Django, Flask, and Requests, detailing their uses in scientific computing, data analysis, visualization, machine learning, web development, and H
 How to dynamically create an object through a string and call its methods in Python?
Apr 01, 2025 pm 11:18 PM
How to dynamically create an object through a string and call its methods in Python?
Apr 01, 2025 pm 11:18 PM
In Python, how to dynamically create an object through a string and call its methods? This is a common programming requirement, especially if it needs to be configured or run...
 How to solve permission issues when using python --version command in Linux terminal?
Apr 02, 2025 am 06:36 AM
How to solve permission issues when using python --version command in Linux terminal?
Apr 02, 2025 am 06:36 AM
Using python in Linux terminal...
