

A time series is a series of data points recorded at fixed time intervals. It is used to study trends in patterns, relationships between variables, and changes over a defined period of time. Common examples of time series include stock prices, weather patterns, and economic indicators.
Analyze time series data through statistical and mathematical techniques. The main purpose of time series is to identify patterns and trends in previous data to predict future values.
The data is said to be stationary, if it doesn't change with the time. It is necessary to check if the data is stationary or not. There are different ways to check if time series data is stationary, let's see them one by one.
Augmented Dickey-Fuller(ADF) is a statistical test which checks for the presence of the unit roots available in the time series data. The unit root is the data which is non stationary. It returns the test static and p value as the output.
In the output, if the p-value is lower than 0.05, it indicates non-stationary time series data. Below is an example of ADF stationary data. We have a function in Python called adfuller(), which is available in the statsmodel package to check whether the time series data is stationary.
In this example we are finding the ADF statistic and p-value of the Augmented Dickey Fuller using the adfuller() function of the statsmodel package of python.
from statsmodels.tsa.stattools import adfuller
import pandas as pd
data = pd.read_csv('https://raw.githubusercontent.com/selva86/datasets/master/a10.csv',parse_dates=['date'], index_col='date')
t_data = data.loc[:, 'value'].values
result = adfuller(t_data)
print("The result of adfuller function:",result)
print('ADF Statistic:', result[0])
print('p-value:', result[1])
Following is the output produced after executing the program above –
The result of adfuller function: (3.145185689306744, 1.0, 15, 188, {'1%': -3.465620397124192, '5%': -2.8770397560752436, '10%': -2.5750324547306476}, 549.6705685364172)
ADF Statistic: 3.145185689306744
p-value: 1.0
Another test to check unit root is the KPSS test. Its abbreviation is Kwiatkowski-Phillips-Schmidt-Shin. We have a function called kpss() in the statsmodels package for checking the unit root in time series data.
The following is an example of finding unit roots in time series data.
from statsmodels.tsa.stattools import kpss
import pandas as pd
data = pd.read_csv('https://raw.githubusercontent.com/selva86/datasets/master/a10.csv',parse_dates=['date'], index_col='date')
t_data = data.loc[:, 'value'].values
from statsmodels.tsa.stattools import kpss
result = kpss(data)
print("The result of kpss function:",result)
print('KPSS Statistic:', result[0])
print('p-value:', result[1])
The following is the output of the kpss() function in the statsmodels package.
The result of kpss function: (2.0131256386303322, 0.01, 9, {'10%': 0.347, '5%': 0.463, '2.5%': 0.574, '1%': 0.739})
KPSS Statistic: 2.0131256386303322
p-value: 0.01
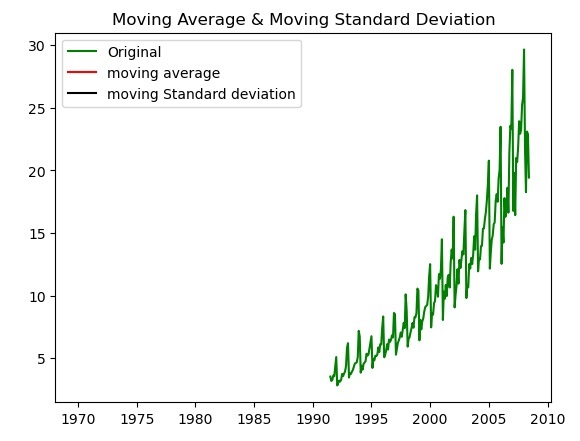
Another way to check time series data is to plot the moving average and moving standard deviation of the given time series data and check whether the data remains constant. If the data changes over time in the chart, the time series data is non-stationary.
The following is the example for checking the data variation by plotting the moving average and moving standard deviation using the matplotlib library plot() function.
import pandas as pd
import matplotlib.pyplot as plt
data = pd.read_csv('https://raw.githubusercontent.com/selva86/datasets/master/a10.csv',parse_dates=['date'], index_col='date')
t_data = data.loc[:, 'value'].values
moving_avg = t_data.mean()
moving_std = t_data.std()
plt.plot(data, color='green', label='Original')
plt.plot(moving_avg, color='red', label='moving average')
plt.plot(moving_std, color='black', label='moving Standard deviation')
plt.legend(loc='best')
plt.title('Moving Average & Moving Standard Deviation')
plt.show()
The following is the output of normalizing the time series data by plotting the moving average and moving standard deviation.
The above is the detailed content of How to check if time series data is stationary using Python?. For more information, please follow other related articles on the PHP Chinese website!


![[Web front-end] Node.js quick start](https://img.php.cn/upload/course/000/000/067/662b5d34ba7c0227.png)


