
 Backend Development
Python Tutorial
Python for time series analysis: forecasting and anomaly detection
Backend Development
Python Tutorial
Python for time series analysis: forecasting and anomaly detection
Python for time series analysis: forecasting and anomaly detection


Python has become the language of choice for data scientists and analysts, offering a comprehensive range of data analysis libraries and tools. In particular, Python excels in time series analysis and excels in forecasting and anomaly detection. With its simplicity, versatility, and strong support for statistical and machine learning techniques, Python provides an ideal platform for extracting valuable insights from time-dependent data.
This article explores Python’s superior capabilities for time series analysis, focusing on forecasting and anomaly detection. By delving into the practical aspects of these tasks, we highlight how Python's libraries and tools enable accurate forecasting and identification of anomalies in time series data. Through real-world examples and demonstrative output, we demonstrate Python's efficiency and utility in solving time series analysis challenges. Join us on a Python journey to perform time series analysis and uncover hidden treasures in time-related data.
Prediction using Python
Forecasting allows us to predict future values based on past observations. Python provides several high-performance libraries such as NumPy, pandas, and scikit-learn that facilitate time series forecasting. In addition, statistical models and specialized libraries such as Prophet provide more advanced forecasting capabilities.
In the task of predicting next month's sales at a retail store, we first load the time series data into a pandas DataFrame and perform the necessary preparations. Once the data is ready, we can explore various forecasting methods such as moving averages, exponential smoothing, and ARIMA models for analysis and forecasting.
Example
The following is the sample code−
import pandas as pd
import statsmodels.api as sm

# Load and preprocess the time series data
sales_data = pd.read_csv('sales_data.csv', parse_dates=['Date'])
sales_data.set_index('Date', inplace=True)

# Fit the ARIMA model
model = sm.tsa.ARIMA(sales_data, order=(1, 1, 1))
model_fit = model.fit(disp=0)

# Make predictions
predictions = model_fit.predict(start='2023-07-01', end='2023-08-01', dynamic=False)
In this example, we load sales data from a CSV file, set the date column as the index, and fit an ARIMA(1, 1, 1) model to the data. Finally, we make our predictions for the next month.
Using Python for anomaly detection
Anomaly detection involves identifying unusual patterns in time series data. Python provides a variety of techniques and libraries for effective anomaly detection, including popular methods based on moving averages and standard deviations.
Suppose we have a sensor dataset containing hourly temperature readings. We're looking for exceptions, such as rapid increases or decreases in temperature. The following is a code example using a moving average and standard deviation strategy −
Example
import pandas as pd

# Load the time series data
sensor_data = pd.read_csv('sensor_data.csv', parse_dates=['Timestamp'])
sensor_data.set_index('Timestamp', inplace=True)

# Calculate moving averages and standard deviations
window_size = 6
rolling_mean = sensor_data['Temperature'].rolling(window=window_size).mean()
rolling_std = sensor_data['Temperature'].rolling(window=window_size).std()

# Detect anomalies
anomalies = sensor_data[(sensor_data['Temperature'] > rolling_mean + 2 * rolling_std) |
                        (sensor_data['Temperature'] < rolling_mean - 2 * rolling_std)]
In this example, we use a 6-hour window size to calculate the moving average and standard deviation of the temperature measurements. We are then able to spot anomalies by locating data points that deviate significantly from the moving average.
Python visualization for time series analysis
Python provides powerful visualization libraries that can enhance our understanding of time series data, beyond prediction and anomaly detection. Visualization helps visually identify patterns, trends, and anomalies to improve insight and make informed decisions.
Let’s extend the previous example and incorporate Python’s visualization capabilities to gain a deeper understanding of the data.
Prediction Visualization
After using the ARIMA model for sales forecasting, we can display the expected sales together with the actual sales data. Use this visualization to easily compare expected and actual numbers.
Example
import matplotlib.pyplot as plt

plt.figure(figsize=(10, 6))
plt.plot(sales_data.index, sales_data['Sales'], label='Actual Sales')
plt.plot(predictions.index, predictions, color='red', linestyle='--', label='Predicted Sales')
plt.title('Sales Forecasting')
plt.xlabel('Date')
plt.ylabel('Sales')
plt.legend()
plt.show()
In this example, the matplotlib library is used to generate a line graph that visually represents actual and forecast sales data. This graphical representation allows us to evaluate the accuracy of the forecast model and identify any differences between predicted and observed values.
Anomaly detection visualization
Anomaly detection visualization requires creating a chart to display the time series data, the calculated moving average and the detected anomalies. This visual representation allows for clear identification and analysis of abnormal data points. This is an example −
Example
import pandas as pd
import matplotlib.pyplot as plt

sensor_data = pd.read_csv('sensor_data.csv', parse_dates=['Timestamp'])
sensor_data.set_index('Timestamp', inplace=True)

window_size = 6
rolling_mean = sensor_data['Temperature'].rolling(window=window_size).mean()
rolling_std = sensor_data['Temperature'].rolling(window=window_size).std()

anomalies = sensor_data[(sensor_data['Temperature'] > rolling_mean + 2 * rolling_std) |
                        (sensor_data['Temperature'] < rolling_mean - 2 * rolling_std)]

plt.figure(figsize=(10, 6))
plt.plot(sensor_data.index, sensor_data['Temperature'], label='Temperature')
plt.plot(sensor_data.index, rolling_mean, color='red', linestyle='--', label='Moving Average')
plt.scatter(anomalies.index, anomalies['Temperature'], color='orange', label='Anomalies')
plt.title('Anomaly Detection: Temperature Sensor')
plt.xlabel('Timestamp')
plt.ylabel('Temperature')
plt.legend()
plt.show()
This code example loads time series data from a CSV file and sets the timestamp column as the index. It then calculates the moving average and standard deviation of the temperature readings using a specific window size. Anomalies can be detected by comparing the temperature values with a calculated moving average and standard deviation.
in conclusion
In summary, Python proves to be a valuable tool for time series analysis, especially in the areas of forecasting and anomaly detection. Its extensive library, including statsmodels, pandas, and scikit-learn, provides a powerful ecosystem tailored for working with time series data. By leveraging the power of these libraries, accurate forecasting models such as ARIMA can be built and techniques such as moving averages and standard deviation can be used to identify anomalies. Additionally, Python's visualization libraries, such as matplotlib, enable users to create visually compelling plots that deepen their understanding of time series data. Regardless of the level of expertise, Python provides beginners and experienced data scientists with the necessary resources to spot trends, make accurate predictions, and identify anomalies in time series data sets.
The above is the detailed content of Python for time series analysis: forecasting and anomaly detection. For more information, please follow other related articles on the PHP Chinese website!

Hot AI Tools

Undresser.AI Undress
AI-powered app for creating realistic nude photos

AI Clothes Remover
Online AI tool for removing clothes from photos.

Undress AI Tool
Undress images for free

Clothoff.io
AI clothes remover

AI Hentai Generator
Generate AI Hentai for free.

Hot Article
Hot Tools

Notepad++7.3.1
Easy-to-use and free code editor

SublimeText3 Chinese version
Chinese version, very easy to use

Zend Studio 13.0.1
Powerful PHP integrated development environment

Dreamweaver CS6
Visual web development tools

SublimeText3 Mac version
God-level code editing software (SublimeText3)
Hot Topics
 1377
1377
 52
52

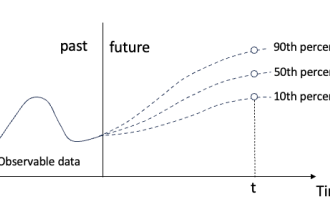 Quantile regression for time series probabilistic forecasting
May 07, 2024 pm 05:04 PM
Quantile regression for time series probabilistic forecasting
May 07, 2024 pm 05:04 PM
Do not change the meaning of the original content, fine-tune the content, rewrite the content, and do not continue. "Quantile regression meets this need, providing prediction intervals with quantified chances. It is a statistical technique used to model the relationship between a predictor variable and a response variable, especially when the conditional distribution of the response variable is of interest When. Unlike traditional regression methods, quantile regression focuses on estimating the conditional magnitude of the response variable rather than the conditional mean. "Figure (A): Quantile regression Quantile regression is an estimate. A modeling method for the linear relationship between a set of regressors X and the quantiles of the explained variables Y. The existing regression model is actually a method to study the relationship between the explained variable and the explanatory variable. They focus on the relationship between explanatory variables and explained variables
 SIMPL: A simple and efficient multi-agent motion prediction benchmark for autonomous driving
Feb 20, 2024 am 11:48 AM
SIMPL: A simple and efficient multi-agent motion prediction benchmark for autonomous driving
Feb 20, 2024 am 11:48 AM
Original title: SIMPL: ASimpleandEfficientMulti-agentMotionPredictionBaselineforAutonomousDriving Paper link: https://arxiv.org/pdf/2402.02519.pdf Code link: https://github.com/HKUST-Aerial-Robotics/SIMPL Author unit: Hong Kong University of Science and Technology DJI Paper idea: This paper proposes a simple and efficient motion prediction baseline (SIMPL) for autonomous vehicles. Compared with traditional agent-cent
 How to use MySQL database for forecasting and predictive analytics?
Jul 12, 2023 pm 08:43 PM
How to use MySQL database for forecasting and predictive analytics?
Jul 12, 2023 pm 08:43 PM
How to use MySQL database for forecasting and predictive analytics? Overview: Forecasting and predictive analytics play an important role in data analysis. MySQL, a widely used relational database management system, can also be used for prediction and predictive analysis tasks. This article will introduce how to use MySQL for prediction and predictive analysis, and provide relevant code examples. Data preparation: First, we need to prepare relevant data. Suppose we want to do sales forecasting, we need a table with sales data. In MySQL we can use
 What is the difference between AI inference and training? do you know?
Mar 26, 2024 pm 02:40 PM
What is the difference between AI inference and training? do you know?
Mar 26, 2024 pm 02:40 PM
If I want to sum up the difference between AI training and reasoning in one sentence, I think "one minute on stage, ten years off stage" is the most appropriate. Xiao Ming has been dating his long-cherished goddess for many years and has quite a lot of experience in the techniques and tips for asking her out, but he is still confused about the mystery. Can accurate predictions be achieved with the help of AI technology? Xiao Ming thought over and over again and summarized the variables that may affect whether the goddess accepts the invitation: whether it is a holiday, the weather is bad, too hot/cold, in a bad mood, sick, he has another appointment, relatives are coming to the house... ..etc. The picture weights and sums these variables. If it is greater than a certain threshold, the goddess must accept the invitation. So, how much weight do these variables have, and what are the thresholds? This is a very complex question and difficult to pass
 Learning cross-modal occupancy knowledge: RadOcc using rendering-assisted distillation technology
Jan 25, 2024 am 11:36 AM
Learning cross-modal occupancy knowledge: RadOcc using rendering-assisted distillation technology
Jan 25, 2024 am 11:36 AM
Original title: Radocc: LearningCross-ModalityOccupancyKnowledgethroughRenderingAssistedDistillation Paper link: https://arxiv.org/pdf/2312.11829.pdf Author unit: FNii, CUHK-ShenzhenSSE, CUHK-Shenzhen Huawei Noah's Ark Laboratory Conference: AAAI2024 Paper Idea: 3D Occupancy Prediction is an emerging task that aims to estimate the occupancy state and semantics of 3D scenes using multi-view images. However, due to the lack of geometric priors, image-based scenarios
 How to use PHP to implement anomaly detection and fraud analysis
Jul 30, 2023 am 09:42 AM
How to use PHP to implement anomaly detection and fraud analysis
Jul 30, 2023 am 09:42 AM
How to use PHP to implement anomaly detection and fraud analysis Abstract: With the development of e-commerce, fraud has become a problem that cannot be ignored. This article introduces how to use PHP to implement anomaly detection and fraud analysis. By collecting user transaction data and behavioral data, combined with machine learning algorithms, user behavior is monitored and analyzed in real time in the system, potential fraud is identified, and corresponding measures are taken to deal with it. Keywords: PHP, anomaly detection, fraud analysis, machine learning 1. Introduction With the rapid development of e-commerce, the number of transactions people conduct on the Internet
 Microsoft 365 enables Python in Excel
Sep 22, 2023 pm 10:53 PM
Microsoft 365 enables Python in Excel
Sep 22, 2023 pm 10:53 PM
1. Enabling Python in Excel Python in Excel is currently in the testing phase. If you want to use this feature, please make sure it is the Windows version of Microsoft 365, join the Microsoft 365 preview program, and select the Beta channel. Click [File] > [Account] in the upper left corner of the Excel page. You can find the following information on the left side of the page: After completing the above steps, open a blank workbook: click the [Formula] tab, select [Insert Python] - [Python in Excel]. Click [Trial Preview Version] in the pop-up dialog box. Next, we can start to experience the wonderful uses of Python! 2,
 Musk is optimistic and OpenAI is entering. Is Tesla's long-term value a robot?
May 27, 2023 pm 02:51 PM
Musk is optimistic and OpenAI is entering. Is Tesla's long-term value a robot?
May 27, 2023 pm 02:51 PM
Technology geek Musk and his Tesla have always been at the forefront of global technological innovation. Recently, at Tesla's 2023 shareholder meeting, Musk once again disclosed more ambitious plans for future development, including cars, energy storage, and humanoid robots. Musk seems very optimistic about humanoid robots and believes that Tesla's long-term value in the future may lie in robots. It is worth mentioning that OpenAI, the parent company of ChatGPT, has also invested in a Norwegian robotics company with the intention of building the first commercial robot EVE. The competition between Optimus and EVE has also triggered a craze for the concept of humanoid robots in the domestic secondary market. Driven by the concept, which links in the humanoid robot industry chain will benefit? What are the investment targets? Laying out automobiles, energy storage, and humanoid robots as global technologies
