

A journey to enhance contemporary debugging: Part 2

In Part 1, we learned how to write and execute JavaScript using DevTools. In Part 2, we'll cover how to debug JavaScript and adopt a workflow to resolve JavaScript errors and diagnose issues more efficiently.
Debugging JavaScript using DevTools
Debugger Keywords
You can use the debugger keyword directly in the code to call the debugging function of the JavaScript runtime (if available). Adding the keyword debugger in your code has the same effect as manually setting breakpoints through the DevTools UI. In Chrome, the debugger keyword does not work when DevTools is closed.
Debugger Control
Debugger controls provide fine-grained control of the debugging process. Use them to efficiently navigate through JavaScript code while pausing at breakpoints. Each debugger control listed in this section corresponds to a button in DevTools that you can select when paused at a breakpoint.
continue
Leave the current breakpoint and resume code execution normally. This does not affect other breakpoints that are not yet paused.
Use Continue when the currently paused breakpoint is not helpful and you want the code to resume normal execution.
cross
Execute the code line by line (click one line at a time) until you reach the function call. At this point, the function call has been "skipped" and you are not stepping into that specific function call.
Use Step Over when the problem you are trying to solve is limited to the current function and does not require looking at external function calls.
Step into
Similar to Step Over, except that in this case you navigate to the external function call by going to the first line of the external function call.
Use Step Into when you are interested in step-by-step execution and any external function calls.
go out
When you step out of a function, Step Out will continue with the rest of the function's code but will not debug it.
Use Step Out when you are not interested in the rest of the current function and want to continue debugging outside it.
Call stack
When paused at a breakpoint, the call stack is active. The execution path leading to the current pause breakpoint is shown in the call stack, with the top call being the most recent call.
Each call in the stack contains:
- Function name
- File name containing the function
- The line of code where the function is located
Clicking on any call in the stack navigates to the corresponding location in the source code and highlights the relevant line. To copy the stack trace to the clipboard, right-click on a call and select Copy Stack Trace. In the call stack context menu, you can also select Restart Framework.
Rewrite function when paused at breakpoint
Consider the following use case: the debugger pauses midway through a callback function triggered by a click event handler, and you are trying to debug why the retrieval of target does not appear to be working as expected.
You see an attempt to access the target property as part of the this keyword, but you then recall that it is the properties portion of the event object passed as an argument to the callback function.
You can override this function using live editing to verify that your changes are valid and inject new JavaScript into the V8 engine.
Monitoring events
When you write event handlers for events such as scrolling, you can first use console.log to see what the passed parameters (event objects) look like. A quick tip to accomplish this is to use the monitorEvents shortcut. Paste the following code into the Console Panel and scroll the page:
monitorEvents(window, "resize");
Please note that the event object is logged to the console for inspection.
debug
When you want the debugger to pause on the first line of a function during its execution, you can do either of the following:
- Add breakpoints through the DevTools UI.
- Add debugger statements to functions.
Another technique is to execute debug(fn) which is part of the command line API. This function takes as its argument the function you wish to debug and will break at the first line of execution of that function.
Interrupt attribute access
This technique enables you to pause the debugger when a property of the object you are interested in is accessed in any way (read or write). To break while reading or writing an object's properties, execute the following command (via Console Panel or Code Snippet):
Object.defineProperty(document.body, 'scrollTop', {
	get: function () {
		debugger;
	},
	set: function (val) {
		debugger;
	}
});
This will apply the getters and setters to the scrollTop property of the document.body object. In custom getters and setters, there are debugger statements. You can also use Object.observe to interrupt property addition of the specified object:
var watchMe = {};
Object.observe(watchMe, function() {
  debugger;
});
使用console.log的条件断点
除了调试器关键字之外,要通过 DevTools 设置断点,您可以在行间距内单击要中断的代码行。这种设置断点的方法具有额外的功能:您可以设置一个条件断点,该断点将指示 DevTools 仅当某个表达式计算结果为 true 时才在断点处暂停。例如,您可以设置条件断点,仅在存在错误参数时才暂停。
设置条件断点:
- 在装订线内右键单击。
- 选择添加条件断点。
- 输入您希望 DevTools 计算的表达式。
- 按Enter。

您还可以使用条件断点技术快速插入 console.log 语句作为要计算的表达式。由于 console.log 的计算结果为 undefined,DevTools 不会暂停,但由于表达式仍在执行,因此您可以通过这种方式检查变量的值。
使用监视表达式
当调试器在断点处暂停时,您可以使用Escape键在抽屉模式下调出控制台面板。您输入的代码将在与您暂停时相同的上下文中进行计算,这意味着您可以访问作用域内的变量。
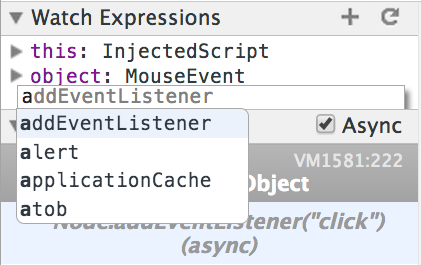
监视表达式是一种简化作用域定期检查技术的工具(例如,通过 console.log)变量。监视表达式是源面板中的一个窗格。您可以使用加号和减号按钮添加或删除监视表达式。需要监视的典型对象是 this 对象;请注意当您未在断点处暂停时它如何引用全局窗口对象。
当您单步执行代码时,监视表达式通常会更新。但是,如果没有,请单击刷新按钮。
异常
考虑以下脚本:
function a() {
    return b();
}

function b() {
    return c();
}

function c() {
    console.trace('The Trace');
    return 42;
}

a();
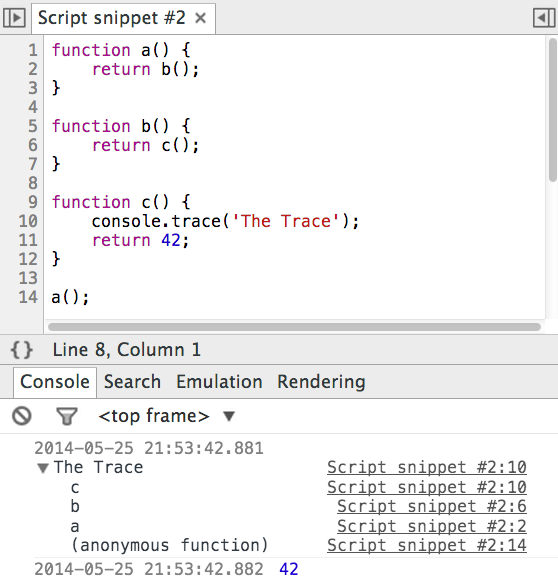
共有三个声明的函数。函数 a 调用函数 b,然后函数 b 调用函数 c。该脚本通过调用函数 a 来启动链。 console.trace 语句将调用该方法的位置处的堆栈跟踪记录到控制台。使用 console.trace 显示使用 console.trace 的输出。
请注意,函数名称及其调用行显示在跟踪消息中。您可以通过“源代码”面板单击要转到源代码中相应位置的行号。此技术也适用于片段。
调试器提供了多种处理异常的模式:
- 在未捕获的异常上暂停。
- 在捕获和未捕获的异常上暂停。
- 不要因异常而暂停。
2.从外到内调试
当您必须调试一个您不太了解的站点时,您可以使用不同的调试技术。在这种方法中,您可以挂钩您认为会触发的事件,并在此类事件发生时请求 DevTools 中断。 “外部>内部”入口点有两类:
- DOM 修改
- 事件监听器断点
DOM 修改中断
您的任务是调试网页,特别是 DOM。节点在页面的生命周期中添加和删除,您需要检查实现此操作的 JavaScript。通过以下步骤设置 DOM 断点:
- 右键单击“元素面板”中的 DOM 节点。
- 从中断上下文菜单中选择首选 DOM 断点。
- 当您在断点处暂停时,您可以看到一条消息,其中解释了调试器暂停的原因,如在断点处暂停的原因中所示。
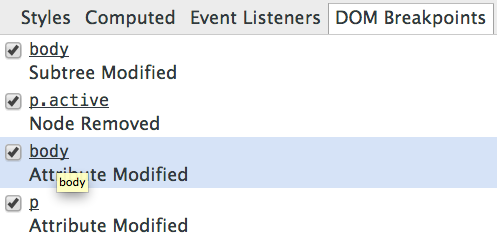
每次设置 DOM 断点时,您都可以在DOM 断点元素面板中的strong>窗格。在此窗格中,列出了您设置的每个断点,您可以通过以下方式与此窗格交互:
- 打开和关闭复选框以启用或禁用断点。
- 单击节点名称(带下划线)可在 DOM 树视图中导航到该节点。
- 右键单击并选择删除所有 DOM 断点以禁用并删除所有 DOM 断点。
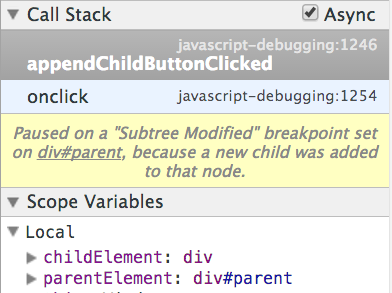
子树修改
描述:当根节点(设置了断点)的树发生更改时,就会发生子树修改。这可以包括添加或删除节点。
用例:DOM 中存在一个空的 div 容器,并且页面加载时会发生 Ajax 请求,该请求会在原始容器中附加一些新节点。在容器上添加子树修改断点,以查看代码中向 DOM 添加新节点的确切位置。
消息示例: 在 子树上暂停 已修改 在 body 上设置的断点,因为其后代 p 已被删除。或者:在 子树上暂停 在 <code class="inline">div#parent 上设置修改的 断点,因为新的子节点已添加到该节点。
属性修改
说明:当添加、删除或修改节点上的属性名称或值时,会触发属性修改。这包括所有属性,例如 class、data-* 或 style。
用例:页面上看似随机的时间点发生了视觉变化,您将其范围缩小到在 body 元素上动态设置的类。您希望调查此动态类添加的原因。
消息示例: 在 在 <code class="inline">p 上设置的属性 Modified 断点处暂停。
节点删除
描述:节点删除断点在从包含设置断点的父节点中删除节点时触发。
用例:您正在构建一个待办事项列表应用,并希望验证当用户删除待办事项时,它也会从 DOM 中删除。您可以设置节点删除断点来确保发生此行为。
消息示例: 在 节点已删除的 <code <code class="inline">div#container 上暂停。
事件监听器断点
在 DevTools 中,您可以启用许多预定义的事件侦听器断点。这些提供属于页面的 JavaScript 的入口点。
考虑一个简单的 about:blank 页面。通过以下步骤在此页面上设置 click 事件侦听器断点:
- 导航到源面板中的事件侦听器断点窗格。
- 打开
Mouse事件侦听器类别。 - 启用
Click事件侦听器。
您现在已经设置了断点。如果您单击该页面,请注意没有任何反应。现在在控制台面板中执行以下 JavaScript 代码。
document.addEventListener('click', console.log.bind(console))
当您为已注册事件侦听器的同一事件设置断点时,调试器会在执行事件侦听器回调的点之前暂停。
您可以为多种类型的事件注册断点,例如计时器、触摸事件等,如下表所列。
| 活动类别 | 事件示例 |
|---|---|
动画 |
请求动画帧、取消动画帧、动画帧触发 |
控制 |
调整大小、滚动、缩放、聚焦、模糊、选择、更改、提交、重置 |
剪贴板 |
复制、剪切、粘贴、复制前、剪切前、粘贴前 |
DOM 突变 |
DOMActivate、DOMFocusIn、DOMFocusOut、DOMAttrModified、DOMCharacterDataModified、DOMNodeInserted、DOMNodeInsertedIntoDocument、DOMNodeRemoved、DOMNodeRemovedFromDocument、DOMSubtreeModified、DOMContentLoaded |
设备 |
设备方向、设备运动 |
拖放 |
dragenter、dragover、dragleave、drop |
键盘 |
按键、按键、按键、输入 |
加载 |
加载、卸载前、卸载、中止、错误、hashchange、popstate |
鼠标 |
单击、dblclick、mousedown、mouseup、mouseover、mousemove、mouseout、mousewheel、wheel |
计时器 |
setTimer、clearTimer、timerFired |
触摸 |
触摸开始、触摸移动、触摸结束、触摸取消 |
WebGL |
webglErrorFired、webglWarningFired |
The "outside-in debugging" technique can be useful when you need to debug a third-party website with broken functionality, or even when you're curious about how something on the page you're viewing is content is running.
3.Extension
Many Chrome extensions exist, many of which enhance DevTools functionality. DevTools Extensions Gallery can be downloaded from DevTools Extensions Gallery
DevTools JavaScript Preprocessing
For DevTools extension authors, JavaScript preprocessing capabilities are a worthwhile topic to learn. The preprocessor can intercept JavaScript source code before it enters the V8 engine, which means that JavaScript source code can be modified by DevTools before it enters the VM, all from extensions.
In addition to interception capabilities, the preprocessing API has programmatic access for reloading script sources. An extension can reload the JavaScript source at any point in its lifecycle without reloading the original web page.
4.Node
This section introduces tools that provide a level of integration between Node.js and Chrome development tools.
Node Inspector
DevTools has two parts:
- Front End: This is the part you use and interact with. It consists of HTML, CSS and JavaScript.
- Backend: When inspecting a page in Google Chrome, the backend lives inside Chrome. Messages are passed back and forth via the remote debugging protocol.
Any application can communicate via the remote debugging protocol and allow its users to debug via DevTools. Node Inspector is one such tool. Once installed, you can use Node Inspector to run any node script. This tool starts a web server that hosts the DevTools front-end. This particular version of DevTools does not use the Chrome backend, but instead uses Node Inspector's own backend.
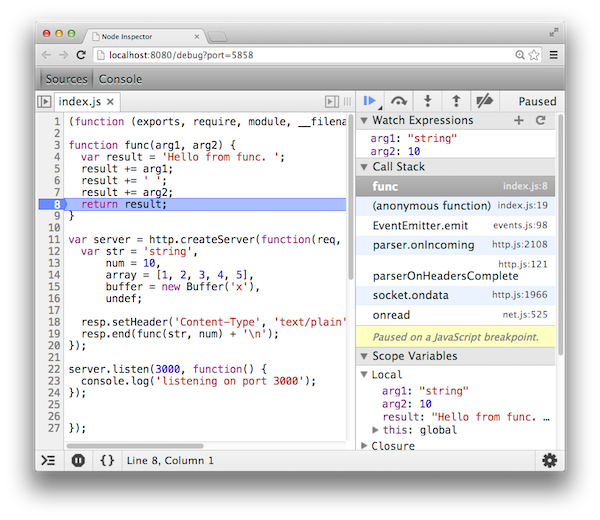
As you can see in the Node Inspector, DevTools pauses at the breakpoint. The call stack refers to the calls performed in Node.js. The browser's only involvement here is the DevTools UI.
Node Heap Dump
Use Node Heapdump to take a snapshot of the V8 heap at a certain point in the code. The current state of the V8 heap is serialized and output to a file.
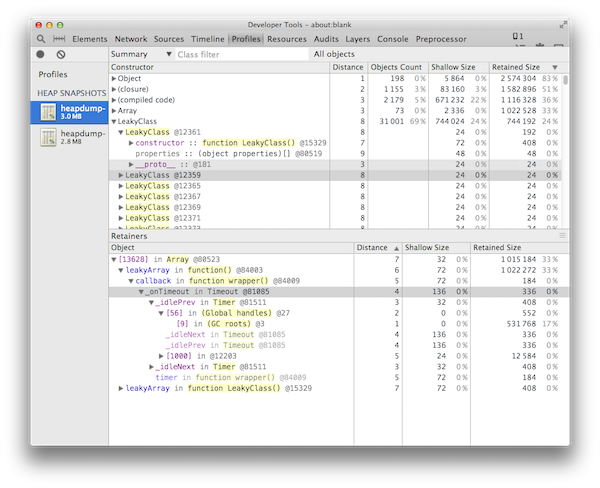
Compare two heap snapshots to discover which objects have not been garbage collected. This is useful for catching memory leaks.
in conclusion
That concludes this two-part series on the modern debugging experience. Hopefully by now you're comfortable writing and debugging JavaScript in Chrome DevTools. You're familiar with workflows that help with debugging, and you know some tips and tricks for working with a production site you've never worked with before. Next time you need to debug, be sure to try some of the techniques you learned here.
Thank you for reading!
The above is the detailed content of A journey to enhance contemporary debugging: Part 2. For more information, please follow other related articles on the PHP Chinese website!

Hot AI Tools

Undresser.AI Undress
AI-powered app for creating realistic nude photos

AI Clothes Remover
Online AI tool for removing clothes from photos.

Undress AI Tool
Undress images for free

Clothoff.io
AI clothes remover

AI Hentai Generator
Generate AI Hentai for free.

Hot Article
Hot Tools

Notepad++7.3.1
Easy-to-use and free code editor

SublimeText3 Chinese version
Chinese version, very easy to use

Zend Studio 13.0.1
Powerful PHP integrated development environment

Dreamweaver CS6
Visual web development tools

SublimeText3 Mac version
God-level code editing software (SublimeText3)
Hot Topics


 Replace String Characters in JavaScript
Mar 11, 2025 am 12:07 AM
Replace String Characters in JavaScript
Mar 11, 2025 am 12:07 AM
Detailed explanation of JavaScript string replacement method and FAQ This article will explore two ways to replace string characters in JavaScript: internal JavaScript code and internal HTML for web pages. Replace string inside JavaScript code The most direct way is to use the replace() method: str = str.replace("find","replace"); This method replaces only the first match. To replace all matches, use a regular expression and add the global flag g: str = str.replace(/fi
 Custom Google Search API Setup Tutorial
Mar 04, 2025 am 01:06 AM
Custom Google Search API Setup Tutorial
Mar 04, 2025 am 01:06 AM
This tutorial shows you how to integrate a custom Google Search API into your blog or website, offering a more refined search experience than standard WordPress theme search functions. It's surprisingly easy! You'll be able to restrict searches to y
 Build Your Own AJAX Web Applications
Mar 09, 2025 am 12:11 AM
Build Your Own AJAX Web Applications
Mar 09, 2025 am 12:11 AM
So here you are, ready to learn all about this thing called AJAX. But, what exactly is it? The term AJAX refers to a loose grouping of technologies that are used to create dynamic, interactive web content. The term AJAX, originally coined by Jesse J
 Example Colors JSON File
Mar 03, 2025 am 12:35 AM
Example Colors JSON File
Mar 03, 2025 am 12:35 AM
This article series was rewritten in mid 2017 with up-to-date information and fresh examples. In this JSON example, we will look at how we can store simple values in a file using JSON format. Using the key-value pair notation, we can store any kind
 10 jQuery Syntax Highlighters
Mar 02, 2025 am 12:32 AM
10 jQuery Syntax Highlighters
Mar 02, 2025 am 12:32 AM
Enhance Your Code Presentation: 10 Syntax Highlighters for Developers Sharing code snippets on your website or blog is a common practice for developers. Choosing the right syntax highlighter can significantly improve readability and visual appeal. T
 8 Stunning jQuery Page Layout Plugins
Mar 06, 2025 am 12:48 AM
8 Stunning jQuery Page Layout Plugins
Mar 06, 2025 am 12:48 AM
Leverage jQuery for Effortless Web Page Layouts: 8 Essential Plugins jQuery simplifies web page layout significantly. This article highlights eight powerful jQuery plugins that streamline the process, particularly useful for manual website creation
 10 JavaScript & jQuery MVC Tutorials
Mar 02, 2025 am 01:16 AM
10 JavaScript & jQuery MVC Tutorials
Mar 02, 2025 am 01:16 AM
This article presents a curated selection of over 10 tutorials on JavaScript and jQuery Model-View-Controller (MVC) frameworks, perfect for boosting your web development skills in the new year. These tutorials cover a range of topics, from foundatio
 What is 'this' in JavaScript?
Mar 04, 2025 am 01:15 AM
What is 'this' in JavaScript?
Mar 04, 2025 am 01:15 AM
Core points This in JavaScript usually refers to an object that "owns" the method, but it depends on how the function is called. When there is no current object, this refers to the global object. In a web browser, it is represented by window. When calling a function, this maintains the global object; but when calling an object constructor or any of its methods, this refers to an instance of the object. You can change the context of this using methods such as call(), apply(), and bind(). These methods call the function using the given this value and parameters. JavaScript is an excellent programming language. A few years ago, this sentence was
