

将Transforming a WordPress Server Dashboard into a Widget


回想一下,所有小部件提供程序都必须实现 Provider 接口。它们还必须位于名为 widget 的文件夹内,并位于名称空间 AX\StatBoard\Widget 下。如果我们想添加一种新的指标,只需创建一个相应的类,并创建一个对象并使用 add_provider 方法将其添加到 Widget 类中。
RAM 使用情况小部件
我们想要显示的第一条信息是当前正在使用的 RAM 量以及当前空闲的 RAM 量。
在本例中,free -m 是我们的朋友 - 它告诉我们 RAM 使用情况。 -m 开关是以兆字节为单位输出结果。
[vagrant@vagrant-centos64 ~]$ free -m
             total       used       free     shared    buffers     cached
Mem:           589        366        223          0          9         57
-/+ buffers/cache:        299        290
Swap:            0          0          0
我们将类命名为 Ram。相应的文件将为 widget/ram.php。我们在这里只是编写基础并实现 get_title 。
<?php
namespace AX\StatBoard\Widget;

class Ram implements Provider {
  function __construct() {
  }

  public function get_title() {
    return "Ram Usage";
  }

?>
get_metric 来实际运行必要的 shell 命令并提取信息。稍后我将解释 get_metric 的更多细节。<?php
function get_metric() {
$df = `free -m | grep -E "(Mem|Swap)" | awk '{print $1, $2, $3, $4}'`;
$df = explode("\n", $df);
if ( is_array( $df ) && 2 <= count( $df ) ) {
$df = array_map( function ( $line ) {
if ( empty( $line ) ) {
return;
}
$segment = preg_split( '/\s+/', $line );
return array(
'type' => trim( $segment[0]," :" ),
'total' => (int)$segment[1],
'used' => (int)$segment[2],
'free' => (int)$segment[3],
);
}, $df );
return $df;
}
return false;
}
?>
free -m | grep -E "内存|交换" | awk '{print $1, $2, $3, $4}' .它的输出看起来与此类似。[vagrant@vagrant-centos64 ~]$ free -m | grep -E "Mem|Swap" | awk '{print $1, $2, $3, $4}'
Mem: 589 541 47
Swap: 255 0 255
[vagrant@vagrant-centos64 ~]$
array_map 循环遍历数组的所有元素,对于每一行,我们用空格分隔,然后返回一个包含元素的关联数组:
-
type:第一个字段 -
total:第二个字段 -
used:第三个字段 -
free:第四个字段
get_content 的时候了。 public function get_content() {
$metric = $this->get_metric();
$data = array(
array('Type', 'Used(MB)', 'Free(MB)')
);
foreach ($metric as $item) {
if (empty($item)) {
continue;
}
if ($item['type'] !== 'Mem' && $item['type'] !== 'Swap') {
continue;
}
if ( 0 == ($item['free'] + $item['used'])) {
continue;
}
$data[] = array(
$item['type'],$item['used'], $item['free']
);
}
$data = json_encode($data);
echo <<<EOD
<div id="widget_ram_usage"></div>
<script type="text/javascript">
google.setOnLoadCallback(function () {
var data = google.visualization.arrayToDataTable({$data});
var options = {
isStacked: true
};
var chart = new google.visualization.ColumnChart(document.getElementById('widget_ram_usage'));
chart.draw(data, options);
})
</script>
EOD;
}
get_metric() 来获取必要的数据。然后,我们只需循环它并格式化它以匹配 Google 图表数据要求。最后,我们使用 json_encode 将它们转换为 JavaScript 对象表示法(或 JSON)。然后,我们输出一个 HTML 代码,其中包含 div 元素来保存图表对象。 div 元素中。
安装的软件
我们将介绍的第二个小部件是显示已安装软件的小部件。它是一个小部件,旨在显示我们在服务器上有哪些常见软件包以及哪个版本。
widget/software.php:<?php
namespace AX\StatBoard\Widget;
class Software implements Provider {
function __construct() {
}
public function get_title() {
return "Installed Software";
}
function get_metric() {
$cmds = array();
$package = array(
'php' => '-v',
'node' => '-v',
'mysql' => '-V',
'vim' => '--version',
'python' => '-V',
'ruby' => '-v',
'java' => '-version',
'curl' => '-V');
foreach ( $package as $cmd=>$version_query ) {
if ( NULL == $cmds[$cmd] = shell_exec( "which $cmd" ) ) {
$cmds[ $cmd ] = 'Not installed';
continue;
}
$version = shell_exec( "$cmd $version_query" );
$version = explode( "\n", $version );
if ( is_array( $version ) ) {
$version = array_shift( $version );
}
$cmds[ $cmd ] .= '<br>' . $version;
}
return $cmds;
}
get_title ,它只返回一个简单的字符串。对于 get_metric(),我们想知道是否安装了特定的软件。如果有,则获取其版本信息。 php -v 显示版本信息,mysql --version 显示MySQL信息。 shell_exec 将返回 false。此时,我们可以判断该软件没有安装;否则,我们可以解析结果以显示版本信息。然后,我们逐行分割结果,并检索第一行作为版本信息。这是因为我们需要的信息只能在第一行找到。 get_content 方法了。 public function get_content() {
$cmds = $this->get_metric();
$content = '';
foreach ( $cmds as $cmd => $info ) {
$content .= "<p><strong>$cmd</strong> $info</p>";
}
echo $content;
}

磁盘使用情况
现在我们将解决磁盘使用问题。我们将处理此任务的类命名为 Disk。让我们先制作基本骨架。
<?php
namespace AX\StatBoard\Widget;

class Disk implements Provider {
  function __construct() {
  }
  public function get_title() {
    return "Disk Usage";
  }
}
Provider 接口。我们在这里为我们的小部件设置一个标题。接下来是我们课程的核心:获取磁盘使用情况的方法。<?php
function get_metric() {
$df = `df -h`;
$df = explode("\n", $df);
if (is_array($df) && count($df)>=2) {
array_shift($df); //Get rid the first line
$df = array_map(function ($line) {
if (empty($line)) {
return NULL;
}
$segment=preg_split('/\s+/', $line);
return array(
'filesystem' => $segment[0],
'size' => $segment[1],
'used' => $segment[2],
'available' => $segment[3],
'use_percent' => $segment[4],
);
}, $df);
return $df;
}
return false;
}
df 命令有了一些了解,因此理解以下命令应该很容易:df 输出:[vagrant@vagrant-centos64 ~]$ df -h Filesystem Size Used Avail Use% Mounted on /dev/sda1 7.3G 1.4G 5.6G 20% / tmpfs 295M 0 295M 0% /dev/shm /vagrant 60G 55G 4.9G 92% /vagrant /data/GeoIP 60G 55G 4.9G 92% /data/GeoIP /var/webapps 60G 55G 4.9G 92% /var/webapps /var/www/html 60G 55G 4.9G 92% /var/www/html
get_content. public function get_content() {
$metric = $this->get_metric();
$data = array(
array( 'Disk', 'Space' )
);
$disk_container = array();
$data_partition = array(
array('Filesystem', 'Free(GB)', 'Used(GB)')
);
foreach ( $metric as $disk ) {
$size = intval( $disk['size'] );
if ( 'M' == substr( $disk['size'], -1 ) ) {
$size = round( $size / 1024, 2 );
}
$used = intval( $disk['used'] );
if ('M' == substr( $disk['used'], -1 ) ) {
$used = round( $used / 1024, 2 );
}
if ( empty( $size ) ) {
continue;
}
$data[] = array( $disk['filesystem'], $size );
$data_partition[] = array($disk['filesystem'], $size - $used, $used);
}
}
[  ['File System', 'Free', 'Used',
  ['/dev/sda1', 10, 24],
  ['/dev/sda2', 28, 19]]
- 第一个图表显示了每个已安装文件系统的总空间。对于此数据,我们将使用饼图。
- 第二个图表用于显示每个已安装文件系统的磁盘使用情况。为此,我们将使用条形图。
为此,我们将方法修改为以下内容:
  public function get_content() {
    $metric = $this->get_metric();
    $data = array(
      array('Disk', 'Space')
    );

    $disk_container = array();
    $data_partition = array(
      array('Filesystem', 'Free(GB)', 'Used(GB)')
    );
    foreach ($metric as $disk) {
      $size = intval($disk['size']);
      if ('M' == substr($disk['size'], -1)) {
        $size = round($size / 1024, 2);
      }
      $used = intval($disk['used']);
      if ('M' == substr($disk['used'], -1)) {
        $used = round($used / 1024, 2);
      }

      if (empty($size)) {
        continue;
      }
      $data[] = array($disk['filesystem'], $size);
      $data_partition[] = array($disk['filesystem'], $size - $used, $used);
    }
    $data = json_encode($data);
    $data_partition = json_encode($data_partition);

    echo <<<EOD
      <div id="widget_disk_usage"></div>
      <div id="widget_disk_partion"></div>
      <script type="text/javascript">
      google.load("visualization", "1", {packages:["corechart"]});
      google.setOnLoadCallback(function () {
        var data = google.visualization.arrayToDataTable({$data});
        var options = {
          is3D: true,
        };
        var chart = new google.visualization.PieChart(document.getElementById('widget_disk_usage'));
        chart.draw(data, options);

        var data2 = google.visualization.arrayToDataTable({$data_partition});
        var options2 = {
          isStacked: true
        };
        var chart2 = new google.visualization.ColumnChart(document.getElementById('widget_disk_partion'));
        chart2.draw(data2, options2);

      })
    </script>
EOD;
  }
div 元素来包含信息 <div id="widget_disk_usage"></div>
<div id="widget_disk_partion"></div>

服务器信息
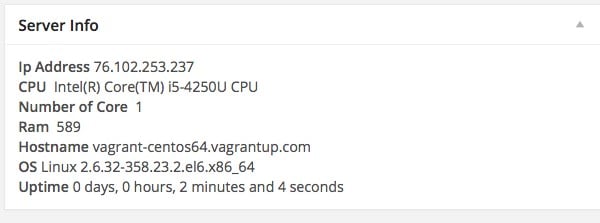
这个小部件向我们显示信息:Linux 内核、CPU 架构、正常运行时间、IP 地址。我们这里不需要图表,一个简单的数据表就可以完成这项工作。调用该类是Server。这是 widget/server.php
<?php
namespace AX\StatBoard\Widget;
use DateTime;

class Server implements Provider {
  function __construct() {
  }

  public function get_title() {
    return "Server Info";
  }

  /**
   * Return server info: OS, Kernel, Uptime, and hostname
   * @return array with 3 metric:
   *          * hostname
   *          * os
   *          * uptime
   */
  function get_metric() {
    $server = array();
    $server['hostname'] = `hostname`;
    $server['os']       = `uname -sr`;
    $server['core']     = `grep -c ^processor /proc/cpuinfo`;
    $total_uptime_sec = time() - `cut -d. -f1 /proc/uptime`;

    $now = new DateTime("now");
    $server['uptime'] = $now->diff(new DateTime("@$total_uptime_sec"))->format('%a days, %h hours, %i minutes and %s seconds');

    // Get the external ip with ifconfig.me, a website that show you ip address in plaintext
    // when sending request with curl header
    $server['ip'] = `curl ifconfig.me`;
    $server['ram'] = `free -m | grep Mem | awk '{print $2}'`;
    $server['cpu'] =`cat /proc/cpuinfo | grep "model name" | awk '{print $4,$5,$6,$7}'`;

    return $server;
  }

}
get_title()。我们只是返回这个小部件的标题。
use DateTime 因为我们位于名称空间 AX\StatBoard\Widget 中,并且 DateTime 类来自全局命名空间。每次我们想要使用 DateTime 时,我们都必须输入 \DateTime。因此,我们使用命名空间导入来使 DateTime 名称在我们当前的命名空间中可用。 get_metric 中,我们运行 shell 命令来获取结果并将其分配回来。主机名
显示您的服务器主机名。
名称-sr
显示Linux内核信息:
[vagrant@vagrant-centos64 ~]$ uname -sr
Linux 2.6.32-358.23.2.el6.x86_64
grep -c ^处理器/proc/cpuinfo
-c 开关打印输入字符串中匹配行的计数。 /proc/cpuinfo 包含处理器信息。我们 grep 它并计算文字处理器的出现次数。这是我的 32 核结果。
$ grep -c ^processor /proc/cpuinfo
32
剪切-d。 -f1 /proc/uptime
此命令显示服务器已启动并运行的秒数。我们将秒数转换为“x 天 y 小时 z 分钟”的格式,以使其更加用户友好。
使用 DateTime::diff 我们可以轻松实现这一点。我们创建一个带有当前时间戳的 DateTime 对象,另一个带有时间戳的对象是当前时间戳减去正常运行时间的秒数。然后使用 format 方法将其格式化为人类友好的字符串。
这是我的结果,正常运行时间为 26194091 秒。
$ cut -d. -f1 /proc/uptime
26194091
卷曲 ifconfig.me
ifconfig.me 是一项在浏览器内直接访问时显示您的 IP 地址的服务。如果您使用 curl 向其发送请求,它将以单个字符串形式返回您的 IP 地址。
[vagrant@vagrant-centos64 ~]$ curl ifconfig.me
76.102.253.237
CPU型号
如上所述,/proc/cpuinfo存储了CPU信息。我们可以从中提取CPU型号。例如:[vagrant@vagrant-centos64 ~]$ cat /proc/cpuinfo | grep "model name" | awk '{print $4,$5,$6,$7}'
Intel(R) Core(TM) i5-4250U CPU
get_content 方法提供这些数据。这是 get_content,仅显示数据: public function get_content() {
$server = $this->get_metric();
echo <<<EOD
<strong>Ip Address</strong> {$server['ip']}<br>
<strong>CPU</strong> {$server['cpu']}<br>
<strong>Number of Core</strong> {$server['core']}<br>
<strong>Ram</strong> {$server['ram']}<br>
<strong>Hostname</strong> {$server['hostname']}<br>
<strong>OS</strong> {$server['os']}<br>
<strong>Uptime</strong> {$server['uptime']}<br>
EOD;
}
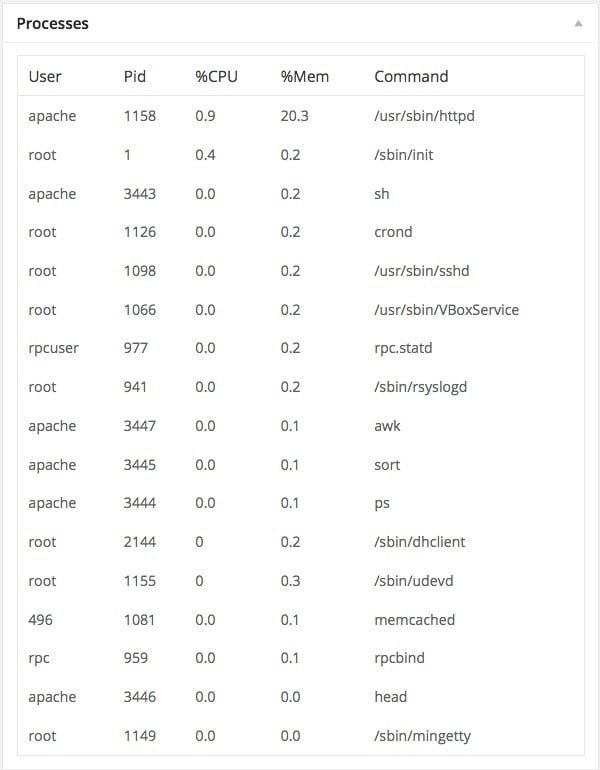
处理器
监控我们的处理器是其中之一我们可以展示的最重要的东西。我们想知道某个特定进程正在使用多少 CPU 和/或消耗了多少内存。我们将我们的类称为Process,首先从 get_title 和 get_metric 开始。我将在代码后面解释 get_metric 的更多细节:<?php
namespace AX\StatBoard\Widget;
class Process implements Provider {
public function get_title() {
return "Processes";
}
/**
* Return server info: OS, Kernel, Uptime, and hostname
* @return array with 3 metric:
* * hostname
* * os
* * uptime
*/
function get_metric() {
$processes = array();
$output = `ps -eo pcpu,pmem,pid,user,args,time,start | grep -v '\[' | sort -k 1 -r | head -30 | awk '{print $4,$3,$1,$2,$7,$6,$5}'`;
$output = explode("\n", $output);
if (!is_array($output) || count($output)<2) {
return false;
}
array_shift($output);
foreach ($output as $line) {
//$line = preg_split('/\s+/', $line);
$line = explode(' ', $line);
if (count($line)<6) {
continue;
}
//var_dump($line);
//echo count($line);
if (empty($processes[$line[6]])) {
$processes[$line[6]] = array_combine(array('user', 'pid', '%cpu', '%mem','start','time', 'command'), $line);
} else {
$processes[$line[6]]['%cpu'] += $line[2];
$processes[$line[6]]['%mem'] += $line[3];
}
}
return $processes;
}
}
-e 提供了广泛的信息,因为它允许我们查看每个进程。对于我们的小部件,我们只需要提取 COU、内存、PID、用户、参数、时间和启动。 -o 表示用户定义的格式,例如: ps -eo pcpu,pmem,pid,user,args,time,start。如果您尝试该命令,您将得到一些奇怪的过程,例如:[vagrant@vagrant-centos64 ~]$ ps -eo pcpu,pmem,pid,user,args,time,start %CPU %MEM PID USER COMMAND TIME STARTED 0.0 0.2 1 root /sbin/init 00:00:00 06:50:39 0.0 0.0 2 root [kthreadd] 00:00:00 06:50:39 0.0 0.0 3 root [migration/0] 00:00:00 06:50:39
grep 来消除这些进程。 grep 有 -v 开关使我们能够反转匹配。它返回的结果不包含我们传递给它的字符串。[vagrant@vagrant-centos64 ~]$ ps -eo pcpu,pmem,pid,user,args,time,start | grep -v '\[' %CPU %MEM PID USER COMMAND TIME STARTED 0.0 0.2 1 root /sbin/init 00:00:00 06:50:39 0.0 0.1 292 root /sbin/udevd -d 00:00:00 06:50:41 0.0 0.1 811 root /sbin/dhclient -H vagrant-c 00:00:00 06:50:48 0.0 0.2 948 root /sbin/rsyslogd -i /var/run/ 00:00:00 06:50:50 0.0 0.1 966 rpc rpcbind 00:00:00 06:50:50 0.0 0.2 984 rpcuser rpc.statd 00:00:00 06:50:50 0.0 0.0 1011 root rpc.idmapd 00:00:00 06:50:51 0.0 0.2 1073 root /usr/sbin/VBoxService 00:00:00 06:50:51
%MEM 排序。我们可以使用Linux的sort命令来做到这一点。 %MEM 是第二列。 sort -k 1。它按从最低到最高的顺序排序。我们实际上关心的是首先消耗大量内存的进程。为此,我们应该使用 sort -k 1 -r 反转顺序。一旦我们得到结果,我们可能只需要前30个过程。当然,这取决于您,因为您可以选择包含所有内容,但我想保持简短。 30 听起来是一个合理的数字。 [vagrant@vagrant-centos64 ~]$ ps -eo pcpu,pmem,pid,user,args,time,start | grep -v '\[' | sort -k 1 | head -30 | awk '{print $4,$3,$1,$2,$7,$6,$5}'
root 1151 0.0 0.0 00:00:00 -d /sbin/udevd
root 1152 0.0 0.0 00:00:00 -d /sbin/udevd
root 292 0.0 0.0 00:00:00 -d /sbin/udevd
root 811 0.0 0.0 vagrant-c -H /sbin/dhclient
root 1 0.0 0.1 06:50:39 00:00:00 /sbin/init
root 2153 0.0 0.1 -q -1 /sbin/dhclient
root 3642 0.0 0.1 00:00:00 -s /usr/sbin/anacron
vagrant 3808 0.0 0.1 pcpu,pmem,pid,user,a -eo ps
vagrant 3810 0.0 0.1 1 -k sort
vagrant 3811 0.0 0.1 00:00:00 -30 head
vagrant 3812 0.0 0.1 $4,$3,$1,$2,$7,$ {print awk
root 948 0.0 0.1 /var/run/ -i /sbin/rsyslogd
rpc 966 0.0 0.1 06:50:50 00:00:00 rpcbind
root 1073 0.0 0.2 06:50:51 00:00:00 /usr/sbin/VBoxService
root 1105 0.0 0.2 06:50:51 00:00:00 /usr/sbin/sshd
root 1121 0.0 0.2 06:50:52 00:00:00 crond
rpcuser 984 0.0 0.2 06:50:50 00:00:00 rpc.statd
496 1088 0.0 0.3 -p -d memcached
vagrant 3544 0.0 0.3 00:00:00 vagrant@pts/0 sshd:
vagrant 3545 0.0 0.3 06:59:27 00:00:00 -bash
root 1113 0.0 1.7 06:50:52 00:00:00 /usr/sbin/httpd
apache 1157 0.0 4.2 06:50:53 00:00:01 /usr/sbin/httpd
apache 3438 0.0 4.2 06:55:39 00:00:01 /usr/sbin/httpd
foreach 循环它。我们将同名进程分组到一个元素中,并将 CPU 百分比和内存添加到其中。<?php
//...
// inside get_content
foreach ( $output as $line ) {
//$line = preg_split( '/\s+/', $line );
$line = explode( ' ', $line );
if ( 6 > count( $line ) ) {
continue;
}
if ( empty( $processes[ $line[6] ] ) ) {
$processes[ $line[6]] = array_combine( array( 'user', 'pid', '%cpu', '%mem','start','time', 'command' ), $line );
} else {
$processes[ $line[6] ]['%cpu'] += $line[2];
$processes[ $line[6] ]['%mem'] += $line[3];
}
}
//...
array_combine 从两个数组创建一个关联数组:一个用于键,一个用于值。 get_content 方法。只是提醒我们必须实现三个方法: get_title, get_metric 和 get_content.对于这个过程,我们只想展示一个简单的表格。 get_content 方法很简单。 public function get_content() {
$processes = $this->get_metric();
$html = '<table class="wp-list-table widefat"><thead><tr>
<th>User</th>
<th>Pid</th>
<th>%CPU</th>
<th>%Mem</th>
<th>Command</th>
</tr></thead><tbody>';
foreach ($processes as $process) {
$html .= "<tr>
<td>{$process['user']}</td>
<td>{$process['pid']}</td>
<td>{$process['%cpu']}</td>
<td>{$process['%mem']}</td>
<td>{$process['command']}</td>
</tr>";
}
$html .= '</tbody></table>';
echo $html;
}
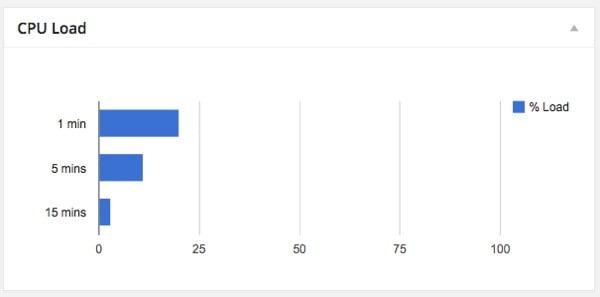
平均负载
Linux 有一个命令可以显示过去一分钟、五分钟和 15 分钟内 CPU 和 IO 的平均负载。让我们把它压缩成一个小部件。称之为 Cpuload,并创建我们的 widget/cpuload.php
<?php
namespace AX\StatBoard\Widget;

class Cpuload implements Provider {
  function __construct() {
  }

  public function get_title() {
    return "CPU Load";
  }
  function get_metric() {    $number_of_core = intval(`/bin/grep -c processor /proc/cpuinfo`);    $loadAvg = `cat /proc/loadavg | /usr/bin/awk '{print $1,$2,$3}'`;    $loadAvg = explode(' ', $loadAvg);    if ($loadAvg <3) {      return false;    }    $loadTimes = array('1 min', '5 mins', '15 mins');    return array_map(      function ($loadtime, $value, $number_of_core) {        return array($loadtime, round($value * 100 / $number_of_core, 2), $value);      },        $loadTimes,        $loadAvg,        array_fill(0, 3, $number_of_core)      );  }

}
/proc/cpuinfo 来统计 CPU 核心数,并统计包含“processor”一词的行数。我们在服务器信息部分对此进行了介绍。
/proc/loadavg保存平均负载信息。前三列分别是1分钟、5分钟和15分钟的负载。 awk 在这里用于过滤掉我们需要的字段。➜ ~ cat /proc/loadavg
0.01 0.04 0.05 1/217 16089
➜ ~ cat /proc/loadavg | awk '{print $1, $2, $3}'
0.01 0.04 0.05
array_map 循环遍历 $loadAvg 数组,并除以我们拥有的核心数。请注意,我们创建了 2 个与 $loadAvg 长度相同的额外数组,一个用于键,另一个用于保存核心数,以便将所有这些一一传递给 array_map。 get_content 的时间: public function get_content() {
$metrics = $this->get_metric();
if ( ! $metrics ) {
return false;
}
// see https://google-developers.appspot.com/chart/interactive/docs/gallery/barchart#Data_Format for more detai of format
$data = array( array( 'Duration', '% Load' ) );
foreach ( $metrics as $key=>$metric ) {
array_push( $data, array( $metric[0], $metric[1] ) );
}
$data = json_encode( $data );
echo <<<EOD
<div id="avg_load"></div>
<script type="text/javascript">
google.load("visualization", "1", {packages:["corechart"]});
google.setOnLoadCallback(drawChart);
function drawChart() {
var data = google.visualization.arrayToDataTable($data);
var options = {
hAxis: {
titleTextStyle: {color: 'red'},
minValue:0,
maxValue:100
}
};
var chart = new google.visualization.BarChart(document.getElementById('avg_load'));
chart.draw(data, options);
}
</script>
EOD;
}
json_encode 将其转换为与条形图数据格式匹配的 JavaScript 表示法数组。 [ ["Duration","% Load"], ["1 min",20], ["5 mins",11], ["15 mins",3]]
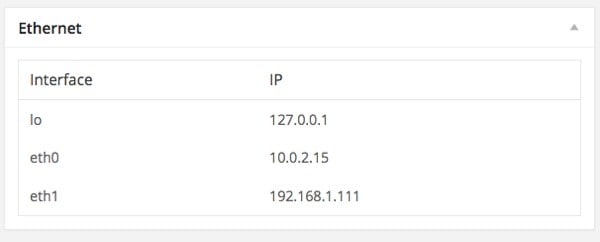
以太网接口
我们要处理的下一个小部件是以太网接口。某些服务器可以有多个以太网接口,并为其分配不同的 IP 地址。
看到这些信息非常有用。我们将这个类称为 Ethernet,从 widget/ethernet.php 的基本内容开始。
<?php
/**
 * Adopt from https://github.com/afaqurk/linux-dash/blob/master/sh/ip.php
 *
 */
namespace AX\StatBoard\Widget;

class Ethernet implements Provider {
  function __construct() {
  }

  public function get_title() {
    return "Ethernet";
  }

  function get_metric() {
    $ethernet = array();
    $output = shell_exec("ip -oneline link show | awk '{print $2}' | sed 's/://'");
    if (!$output) { // It didn't work with "ip" , so we do it with ifconfig
      $output = shell_exec(
        'ifconfig | /bin/grep -B1 "inet addr" | /usr/bin/awk \'' .
        '{ if ( $1 == "inet" ) { print $2 }' .
        'else if ( $2 == "Link" ) { printf "%s:",$1 } }\' | /usr/bin/awk' .
        ' -F: \'{ print $1","$3 }\''
      );
      $output = trim($output, " \n");
      $output = `ifconfig | grep "Link encap" | awk '{ print $1 }'`;
      $interfaces = explode("\n", $output);
      $output = `ifconfiga | grep "inet addr" | awk '{ print $2 }' | sed 's/addr://'`;
      $addreses = explode("\n", $output);
      $output = trim($output, " \n");
      return array_combine($interfaces, $addreses);
    }

    $output = trim($output, " \n");
    $interfaces = explode("\n", $output);
    $addreses = array();
    foreach ($interfaces as $interface) {
      $output = shell_exec("ip -oneline -family inet addr show $interface | awk '{print $4}' | cut -d'/' -f1");
      $addreses[] = $output;
    }
    return array_combine($interfaces, $addreses);
  }

}
get_metric,我们将尝试获取所有以太网接口名称,然后获取每个接口的 IP 地址,并将设备名称和 IP 地址结合起来返回。 ip 而不是 ifconfig; 因此,我们应该首先运行 ip 来获取以太网设备。$output = shell_exec("ip -oneline link show | awk '{print $2}' | sed 's/://'");
使用 IP 实用程序
带有 ip 命令和 -oneline 将仅在一行中显示输出,其中 link 和 show 将列出所有设备。我们使用 awk 获取第二列,其中包含设备名称;但是它包含 : 字符。我们使用 sed 将 : 替换为空字符串。
[vagrant@vagrant-centos64 sbin]$ ip -oneline link show
1: lo: <LOOPBACK,UP,LOWER_UP> mtu 16436 qdisc noqueue state UNKNOWN \    link/loopback 00:00:00:00:00:00 brd 00:00:00:00:00:00
2: eth0: <BROADCAST,MULTICAST,UP,LOWER_UP> mtu 1500 qdisc pfifo_fast state UP qlen 1000\    link/ether 08:00:27:08:c2:e4 brd ff:ff:ff:ff:ff:ff
3: eth1: <BROADCAST,MULTICAST,UP,LOWER_UP> mtu 1500 qdisc pfifo_fast state UP qlen 1000\    link/ether 08:00:27:eb:11:e4 brd ff:ff:ff:ff:ff:ff
[vagrant@vagrant-centos64 sbin]$ ip -oneline link show | awk '{print $2}'
lo:
eth0:
eth1:
[vagrant@vagrant-centos64 sbin]$ ip -oneline link show | awk '{print $2}' | sed 's/://'
lo
eth0
eth1
[vagrant@vagrant-centos64 sbin]$
shell_exec 成功运行,我们将继续使用 IP 实用程序。上面的输出被逐行分割成一个数组。$output = trim($output, " \n");
$interfaces = explode("\n", $output);
ip 命令 ip -oneline -family inet addr show device_name 来获取分配给设备的 IP 地址。 $addreses = array();
foreach ($interfaces as $interface) {
$output = shell_exec("ip -oneline -family inet addr show $interface | awk '{print $4}' | cut -d'/' -f1");
$addreses[] = $output;
}
[vagrant@vagrant-centos64 sbin]$ ip -oneline -family inet addr show eth1
3: eth1    inet 192.168.1.111/24 brd 192.168.1.255 scope global eth1
[vagrant@vagrant-centos64 sbin]$ ip -oneline -family inet addr show eth1 | awk '{print $4}'
192.168.1.111/24
[vagrant@vagrant-centos64 sbin]$ ip -oneline -family inet addr show eth1 | awk '{print $4}' | cut -d'/' -f1
192.168.1.111
[vagrant@vagrant-centos64 sbin]$
return array_combine($interfaces, $addreses);
使用 ifconfig 的服务器
在 ifconfig 的情况下,ip 的 shell_exec 将返回 false。在这种情况下,我们改为运行 ifconfig。 if (!$output) { // It didn't work with "ip" , so we do it with ifconfig
$output = `ifconfig | grep "Link encap" | awk '{ print $1 }'`;
$interfaces = explode("\n", $output);
$output = `ifconfig | grep "inet addr" | awk '{ print $2 }' | sed 's/addr://'`;
$addreses = explode("\n", $output);
$output = trim($output, " \n");
return array_combine($interfaces, $addreses);
}
ifconfig 直接在输出中显示 IP 地址,因此我们可以直接获取它们,而不是在设备数组上运行循环并获取每个设备的 IP 地址。[vagrant@vagrant-centos64 sbin]$ ifconfig
eth0 Link encap:Ethernet HWaddr 08:00:27:08:C2:E4
inet addr:10.0.2.15 Bcast:10.0.2.255 Mask:255.255.255.0
inet6 addr: fe80::a00:27ff:fe08:c2e4/64 Scope:Link
UP BROADCAST RUNNING MULTICAST MTU:1500 Metric:1
RX packets:4230 errors:0 dropped:0 overruns:0 frame:0
TX packets:2575 errors:0 dropped:0 overruns:0 carrier:0
collisions:0 txqueuelen:1000
RX bytes:444488 (434.0 KiB) TX bytes:2288676 (2.1 MiB)
eth1 Link encap:Ethernet HWaddr 08:00:27:EB:11:E4
inet addr:192.168.1.111 Bcast:192.168.1.255 Mask:255.255.255.0
inet6 addr: fe80::a00:27ff:feeb:11e4/64 Scope:Link
UP BROADCAST RUNNING MULTICAST MTU:1500 Metric:1
RX packets:4470 errors:0 dropped:0 overruns:0 frame:0
TX packets:2449 errors:0 dropped:0 overruns:0 carrier:0
collisions:0 txqueuelen:1000
RX bytes:1689803 (1.6 MiB) TX bytes:271675 (265.3 KiB)
lo Link encap:Local Loopback
inet addr:127.0.0.1 Mask:255.0.0.0
inet6 addr: ::1/128 Scope:Host
UP LOOPBACK RUNNING MTU:16436 Metric:1
RX packets:264 errors:0 dropped:0 overruns:0 frame:0
TX packets:264 errors:0 dropped:0 overruns:0 carrier:0
collisions:0 txqueuelen:0
RX bytes:15840 (15.4 KiB) TX bytes:15840 (15.4 KiB)
[vagrant@vagrant-centos64 sbin]$ ifconfig | grep "Link encap"
eth0 Link encap:Ethernet HWaddr 08:00:27:08:C2:E4
eth1 Link encap:Ethernet HWaddr 08:00:27:EB:11:E4
lo Link encap:Local Loopback
[vagrant@vagrant-centos64 sbin]$ ifconfig | grep "Link encap" | awk '{ print $1 }'
eth0
eth1
lo
[vagrant@vagrant-centos64 sbin]$ ifconfig | grep "inet addr"
inet addr:10.0.2.15 Bcast:10.0.2.255 Mask:255.255.255.0
inet addr:192.168.1.111 Bcast:192.168.1.255 Mask:255.255.255.0
inet addr:127.0.0.1 Mask:255.0.0.0
[vagrant@vagrant-centos64 sbin]$ ifconfig | grep "inet addr" | awk '{ print $2 }'
addr:10.0.2.15
addr:192.168.1.111
addr:127.0.0.1
[vagrant@vagrant-centos64 sbin]$ ifconfig | grep "inet addr" | awk '{ print $2 }' | sed 's/addr://'
10.0.2.15
192.168.1.111
127.0.0.1
[vagrant@vagrant-centos64 sbin]$
get_content 中就很容易了,因为我们在这里只显示了一个简单的表格。 public function get_content() {
$interfaces = $this->get_metric();
$html = '<table class="wp-list-table widefat"><thead><tr>
<th>Interface</th>
<th>IP</th>
</tr></thead><tbody>';
foreach ( $interfaces as $interface => $ip ) {
$html .= "<tr>
<td>{$interface}</td>
<td>{$ip}</td>
</tr>";
}
$html .= '</tbody></table>';
echo $html;
}
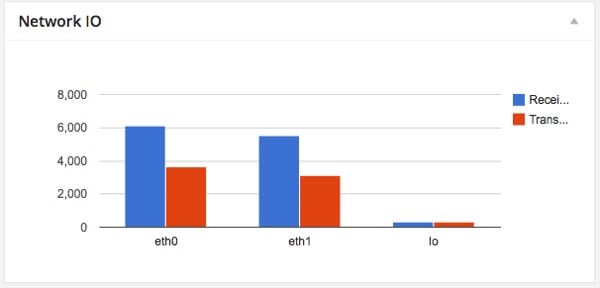
网络流量
网络流量或网络 IO 显示通过计算机网络传输包的状态。该信息是从 netstat 中提取的。
[vagrant@vagrant-centos64 sbin]$ netstat -i
Kernel Interface table
Iface       MTU Met    RX-OK RX-ERR RX-DRP RX-OVR    TX-OK TX-ERR TX-DRP TX-OVR Flg
eth0       1500   0     4828      0      0      0     2933      0      0      0 BMRU
eth1       1500   0     4806      0      0      0     2679      0      0      0 BMRU
lo        16436   0      276      0      0      0      276      0      0      0 LRU
widget/networkio.php 中获取我们的基本类 Networkio<?php
/**
* Adopt from https://github.com/afaqurk/linux-dash/blob/master/sh/ip.php
*
*/
namespace AX\StatBoard\Widget;
class Networkio implements Provider {
function __construct() {
}
public function get_title() {
return "Network IO";
}
function get_metric() { $ethernet = array(); $output = `netstat -i | grep -v -E '(Iface|Interface)' | awk '{print $1","$4","$8}'`; $lines = explode("\n", $output); foreach ($lines as $line) { $line = explode(',', $line); if (count($line)<3) { continue; } $ethernet[] = array($line[0], intval($line[1]), intval($line[2])); } return $ethernet; }}
[vagrant@vagrant-centos64 sbin]$ netstat -i
Kernel Interface table
Iface       MTU Met    RX-OK RX-ERR RX-DRP RX-OVR    TX-OK TX-ERR TX-DRP TX-OVR Flg
eth0       1500   0     5727      0      0      0     3400      0      0      0 BMRU
eth1       1500   0     5004      0      0      0     2797      0      0      0 BMRU
lo        16436   0      292      0      0      0      292      0      0      0 LRU

[vagrant@vagrant-centos64 sbin]$ netstat -i | grep -v -E '(Iface|Interface)'
eth0       1500   0     5736      0      0      0     3405      0      0      0 BMRU
eth1       1500   0     5004      0      0      0     2797      0      0      0 BMRU
lo        16436   0      292      0      0      0      292      0      0      0 LRU

[vagrant@vagrant-centos64 sbin]$ netstat -i | grep -v -E '(Iface|Interface)' | awk '{print $1","$4","$8}'
eth0,5760,3420
eth1,5004,2797
lo,292,292
[vagrant@vagrant-centos64 sbin]$
netstat 返回很多东西,我们使用 grep 来排除包含单词 Iface 或 Kernel 的行(前两行),我们只关心最后三行是我们的以太网设备及其包传输。 awk 用于打印出第一、四、八列的数据,分别表示接口名称、RX-OK、TX-OK。 在我们的get_metric中,我们将结果逐行拆分到一个数组中。因为每一行都包含用逗号分隔的数据,所以它们被再次分割成一个数组。
get_content。 public function get_content() {
$interfaces = $this->get_metric();
$data = array_merge(array(array('Interface', 'Receive(package)', 'Transfer(package)')), $interfaces);
$data = json_encode($data);
echo <<<EOD
<div id="nio_chart"></div>
<script type="text/javascript">
google.setOnLoadCallback(function () {
var data = google.visualization.arrayToDataTable({$data});
var options = {
};
var chart = new google.visualization.ColumnChart(document.getElementById('nio_chart'));
chart.draw(data, options);
})
</script>
EOD;
}
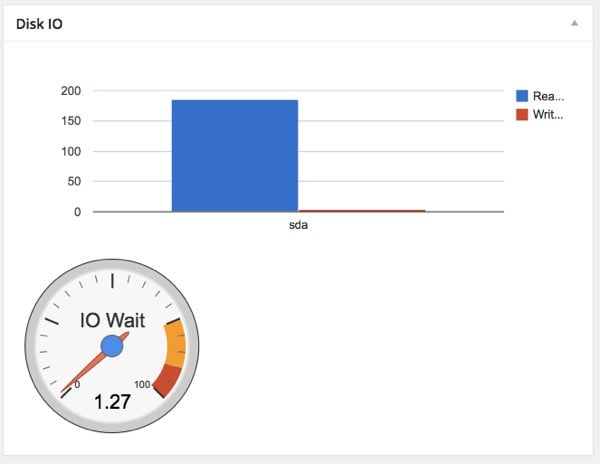
输入/输出统计
现在,我们处理 io stat。 IO 表示输入/输出。我们将了解每秒执行多少次读/写操作。我们还处理 io_wait。 IO等待是CPU空闲等待从硬盘读取结果的时间。
比如你正在读取MySQL数据,CPU会空闲下来等待结果。 io wait 按1秒或1000毫秒计算。如果您的代码需要 100 毫秒从硬盘读取数据,则 io_wait 为 100/1000 = 10%。 IO 等待越少,系统性能越好。
为了继续执行此操作,请确保系统上有 sysstat 软件包。
- 对于 Arch Linux,使用 pacman -S sysstat 安装
</p><p>
</li>
<li>对于 Debian/Ubuntu,您可以使用 <code class="inline">apt-get install sysstat
获取它们 - 对于 Fedora/Centos,您可以使用
yum install sysstat - 对于其他发行版,:请使用您的发行版包管理器进行安装
安装完成后,让我们评估一下我们将使用的一些命令。首先是第一件事:
[vagrant@vagrant-centos64 sbin]$ iostat
Linux 2.6.32-358.23.2.el6.x86_64 (vagrant-centos64.vagrantup.com)     04/27/2014 	_x86_64_	(1 CPU)

avg-cpu:  %user   %nice %system %iowait  %steal   %idle
           0.05    0.00    0.25    0.04    0.00   99.66

Device:            tps   Blk_read/s   Blk_wrtn/s   Blk_read   Blk_wrtn
sda               0.18         7.62         1.04     157826      21584
iowait 值感兴趣。从第七行开始的数据包含硬盘驱动器每秒的读/写块。 [vagrant@vagrant-centos64 ~]$ cat /sys/block/sda/queue/physical_block_size 512 [vagrant@vagrant-centos64 ~]$
有了上面的基本知识,让我们在 widget/iostat.php 中创建我们的类 Iostat 。
<?php

namespace AX\StatBoard\Widget;

class Iostat implements Provider {
  function __construct() {
  }

  public function get_title() {
    return "Disk IO";
  }


  /**
   * Make sure we install package sysstat
   * yum install sysstat
   * or apt-get install sysstat
   *
   * Return IO Stat information. CPU waiting time, disk read/write
   *
   */
  function get_metric() {
    $metric = array();

    $output = `iostat`;
    $number_of_core = intval(`/bin/grep -c processor /proc/cpuinfo`);

    $lines = explode("\n", $output);
    //We should have more than  4 lines
    if (!is_array($lines) || sizeof($lines)<4) {
      return false;
    }
    $avg_cpu = preg_split("/\s+/", $lines[3]);
    $metric['cpu'] = array(
      'user'    => floatval($avg_cpu[0]) * $number_of_core,
      'system'  => floatval($avg_cpu[2]) * $number_of_core,
      'io_wait' => floatval($avg_cpu[3]) * $number_of_core,
      'other'   => 100 - ($avg_cpu[0] + $avg_cpu[2] + $avg_cpu[3])
    );

    if (sizeof($lines) >=7) {
      for ($i=6,$l = sizeof($lines);$i<$l; $i++) {
        $line = preg_split("/\s+/", $lines[$i]);
        if (!is_array($line) || sizeof($line)<5) {
          continue;
        }
        // Calculate block size
        $block_size = shell_exec("cat /sys/block/{$lines[1]}/queue/physical_block_size");

        $metric['disk'][$line[0]] = array(
          'read'  => floatval($line[2]) * $block_size / 1024,
          'write' => floatval($line[3]) * $block_size / 1024,
        );

      }
    }

    return $metric;
  }

}
iostat 的输出,将其转换为数组,每一行都是一个元素。 get_content 并渲染我们的图表。 public function get_content() {
$metric = $this->get_metric();
$disk_io = array(
array('Disk', 'Read(MB)', 'Write(MB)'),
);
foreach ($metric['disk'] as $disk=>$stat) {
$disk_io[] = array($disk, $stat['read'], $stat['write']);
}
$disk_io = json_encode($disk_io);
$cpu_io = json_encode(array(
array('CPU Time', 'Percent'),
array('IO Wait', $metric['cpu']['io_wait']),
));
echo <<<EOD
<div id="widget_disk_io"></div>
<div id="widget_cpu_io_wait"></div>
<script type="text/javascript">
google.load('visualization', '1', {packages:['gauge']});
google.setOnLoadCallback(function () {
var data = google.visualization.arrayToDataTable({$cpu_io});
var goptions = {
redFrom: 80, redTo: 100,
yellowFrom:50, yellowTo: 80,
minorTicks: 5
};
var chart = new google.visualization.Gauge(document.getElementById('widget_cpu_io_wait'));
chart.draw(data, goptions);
var data2 = google.visualization.arrayToDataTable({$disk_io});
var chart2 = new google.visualization.ColumnChart(document.getElementById('widget_disk_io'));
chart2.draw(data2, {});
})
</script>
EOD;
}
The above is the detailed content of 将Transforming a WordPress Server Dashboard into a Widget. For more information, please follow other related articles on the PHP Chinese website!

Hot AI Tools

Undresser.AI Undress
AI-powered app for creating realistic nude photos

AI Clothes Remover
Online AI tool for removing clothes from photos.

Undress AI Tool
Undress images for free

Clothoff.io
AI clothes remover

Video Face Swap
Swap faces in any video effortlessly with our completely free AI face swap tool!

Hot Article
Hot Tools

Notepad++7.3.1
Easy-to-use and free code editor

SublimeText3 Chinese version
Chinese version, very easy to use

Zend Studio 13.0.1
Powerful PHP integrated development environment

Dreamweaver CS6
Visual web development tools

SublimeText3 Mac version
God-level code editing software (SublimeText3)
Hot Topics
 1386
1386
 52
52

 Is WordPress easy for beginners?
Apr 03, 2025 am 12:02 AM
Is WordPress easy for beginners?
Apr 03, 2025 am 12:02 AM
WordPress is easy for beginners to get started. 1. After logging into the background, the user interface is intuitive and the simple dashboard provides all the necessary function links. 2. Basic operations include creating and editing content. The WYSIWYG editor simplifies content creation. 3. Beginners can expand website functions through plug-ins and themes, and the learning curve exists but can be mastered through practice.
 What is the WordPress good for?
Apr 07, 2025 am 12:06 AM
What is the WordPress good for?
Apr 07, 2025 am 12:06 AM
WordPressisgoodforvirtuallyanywebprojectduetoitsversatilityasaCMS.Itexcelsin:1)user-friendliness,allowingeasywebsitesetup;2)flexibilityandcustomizationwithnumerousthemesandplugins;3)SEOoptimization;and4)strongcommunitysupport,thoughusersmustmanageper
 Can I learn WordPress in 3 days?
Apr 09, 2025 am 12:16 AM
Can I learn WordPress in 3 days?
Apr 09, 2025 am 12:16 AM
Can learn WordPress within three days. 1. Master basic knowledge, such as themes, plug-ins, etc. 2. Understand the core functions, including installation and working principles. 3. Learn basic and advanced usage through examples. 4. Understand debugging techniques and performance optimization suggestions.
 How much does WordPress cost?
Apr 05, 2025 am 12:13 AM
How much does WordPress cost?
Apr 05, 2025 am 12:13 AM
WordPress itself is free, but it costs extra to use: 1. WordPress.com offers a package ranging from free to paid, with prices ranging from a few dollars per month to dozens of dollars; 2. WordPress.org requires purchasing a domain name (10-20 US dollars per year) and hosting services (5-50 US dollars per month); 3. Most plug-ins and themes are free, and the paid price ranges from tens to hundreds of dollars; by choosing the right hosting service, using plug-ins and themes reasonably, and regularly maintaining and optimizing, the cost of WordPress can be effectively controlled and optimized.
 Should I use Wix or WordPress?
Apr 06, 2025 am 12:11 AM
Should I use Wix or WordPress?
Apr 06, 2025 am 12:11 AM
Wix is suitable for users who have no programming experience, and WordPress is suitable for users who want more control and expansion capabilities. 1) Wix provides drag-and-drop editors and rich templates, making it easy to quickly build a website. 2) As an open source CMS, WordPress has a huge community and plug-in ecosystem, supporting in-depth customization and expansion.
 How To Begin A WordPress Blog: A Step-By-Step Guide For Beginners
Apr 17, 2025 am 08:25 AM
How To Begin A WordPress Blog: A Step-By-Step Guide For Beginners
Apr 17, 2025 am 08:25 AM
Blogs are the ideal platform for people to express their opinions, opinions and opinions online. Many newbies are eager to build their own website but are hesitant to worry about technical barriers or cost issues. However, as the platform continues to evolve to meet the capabilities and needs of beginners, it is now starting to become easier than ever. This article will guide you step by step how to build a WordPress blog, from theme selection to using plugins to improve security and performance, helping you create your own website easily. Choose a blog topic and direction Before purchasing a domain name or registering a host, it is best to identify the topics you plan to cover. Personal websites can revolve around travel, cooking, product reviews, music or any hobby that sparks your interests. Focusing on areas you are truly interested in can encourage continuous writing
 Is WordPress still free?
Apr 04, 2025 am 12:06 AM
Is WordPress still free?
Apr 04, 2025 am 12:06 AM
The core version of WordPress is free, but other fees may be incurred during use. 1. Domain names and hosting services require payment. 2. Advanced themes and plug-ins may be charged. 3. Professional services and advanced features may be charged.
 Why would anyone use WordPress?
Apr 02, 2025 pm 02:57 PM
Why would anyone use WordPress?
Apr 02, 2025 pm 02:57 PM
People choose to use WordPress because of its power and flexibility. 1) WordPress is an open source CMS with strong ease of use and scalability, suitable for various website needs. 2) It has rich themes and plugins, a huge ecosystem and strong community support. 3) The working principle of WordPress is based on themes, plug-ins and core functions, and uses PHP and MySQL to process data, and supports performance optimization.
