
 Backend Development
Python Tutorial
How to add annotations to bar plots in Python's Matplotlib?
Backend Development
Python Tutorial
How to add annotations to bar plots in Python's Matplotlib?
How to add annotations to bar plots in Python's Matplotlib?

Introduction
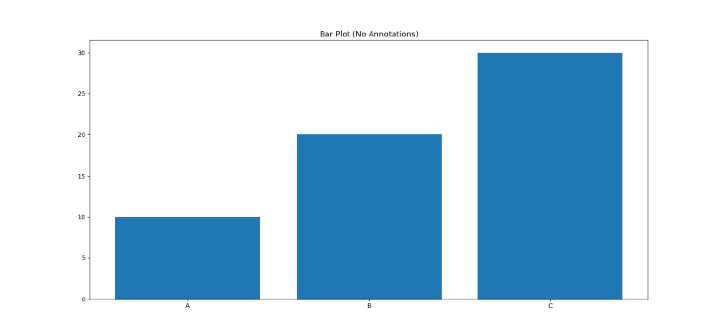
Bar chart is a commonly used chart in data visualization. They are the first choice of many data scientists because they are easy to generate and understand. However, when we need to visualize other information, bar charts may not be sufficient.
comments are useful in this case. In a bar chart, you can use annotations to better understand the data.
Grammar and Usage
Use Matplotlib's annotate() function. The method accepts many inputs, such as the text to be annotated, where the annotation should be placed, and several formatting choices, including font size, color, and style. The basic syntax of the annotate() function is as follows:
ax.annotate(text, xy, xytext=None, arrowprops=None, **kwargs)
text - The text string to display as a comment
xy - (x, y) coordinates of the point to annotate
xytext - The (x, y) coordinates of the text location. If not specified, xy will be used.
arrowprops - A dictionary of arrow properties such as color, width, style, etc.
**kwargs - Additional keyword arguments for styling the annotation text, such as font size, color, etc.
You can use the annotate() method to mark certain data points or add more information to the plot. Additionally, it can be used to generate graphical components such as arrows or other markers that indicate specific plot points.
To annotate the bars in a bar chart using Matplotlib, we can utilize this algorithm -
Import necessary libraries
Use plt.figure() to create a graphics object.
Use Fig.add_subplot() to add a subplot to the figure.
Use ax.bar() to create a bar chart.
Loop through the bars and add annotations using ax.annotate().
Pass the height, width and text to be displayed to the annotate() function
Use plt.show() to render graphics
Example
import matplotlib.pyplot as plt
# Create a figure object
fig = plt.figure()
# Add a subplot to the figure
ax = fig.add_subplot(111)
# Create the bar plot
bars = ax.bar(['A', 'B', 'C'], [10, 20, 30])
# Loop through the bars and add annotations
for bar in bars:
height = bar.get_height()
ax.annotate(f'{height}', xy=(bar.get_x() + bar.get_width() / 2, height), xytext=(0, 3),
textcoords="offset points", ha='center', va='bottom')
# Show the plot
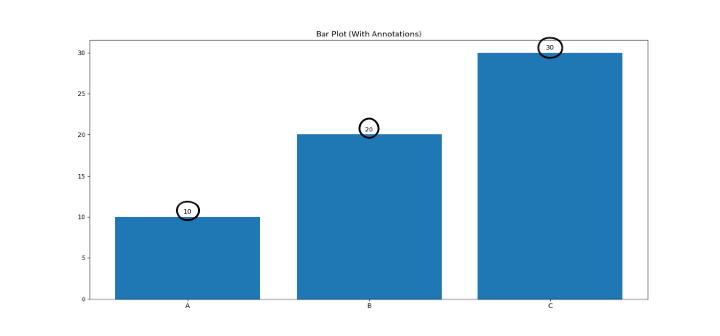
plt.title('Bar Plot (With Annotations)')
plt.show()
First create a graphics object and attach a subgraph to it. Then, use the plt.bar() method to generate a bar chart and save the generated bar chart in a variable named bars. Loop through the bar chart and add annotations using the plt.annotate() method.
The first option is the text you want to annotate, in this case the height of the bar. The xy parameter is then used to indicate the position of the annotation, which is an (x, y) coordinate pair.
The xytext option is used to indicate the offset of the text relative to the xy coordinates. Finally, specify the horizontal and vertical alignment of the text using the ha and va options.
It’s worth noting that the plt.annotate() method gives you a number of options for customizing the annotations in the bar chart. You can design an annotation that exactly suits your personal needs by experimenting with different values for the xy, xytext, ha, and va variables.
in conclusion
You can add unique annotations to bar plots in Matplotlib to help interpret the data presented using the annotate() function. This article outlines a step-by-step algorithm that allows you to easily add this functionality to your own applications. Just follow the instructions and you can create useful and beautiful annotated bar charts.
The above is the detailed content of How to add annotations to bar plots in Python's Matplotlib?. For more information, please follow other related articles on the PHP Chinese website!

Hot AI Tools

Undresser.AI Undress
AI-powered app for creating realistic nude photos

AI Clothes Remover
Online AI tool for removing clothes from photos.

Undress AI Tool
Undress images for free

Clothoff.io
AI clothes remover

AI Hentai Generator
Generate AI Hentai for free.

Hot Article
Hot Tools

Notepad++7.3.1
Easy-to-use and free code editor

SublimeText3 Chinese version
Chinese version, very easy to use

Zend Studio 13.0.1
Powerful PHP integrated development environment

Dreamweaver CS6
Visual web development tools

SublimeText3 Mac version
God-level code editing software (SublimeText3)
Hot Topics


 How to convert XML files to PDF on your phone?
Apr 02, 2025 pm 10:12 PM
How to convert XML files to PDF on your phone?
Apr 02, 2025 pm 10:12 PM
It is impossible to complete XML to PDF conversion directly on your phone with a single application. It is necessary to use cloud services, which can be achieved through two steps: 1. Convert XML to PDF in the cloud, 2. Access or download the converted PDF file on the mobile phone.
 Is the conversion speed fast when converting XML to PDF on mobile phone?
Apr 02, 2025 pm 10:09 PM
Is the conversion speed fast when converting XML to PDF on mobile phone?
Apr 02, 2025 pm 10:09 PM
The speed of mobile XML to PDF depends on the following factors: the complexity of XML structure. Mobile hardware configuration conversion method (library, algorithm) code quality optimization methods (select efficient libraries, optimize algorithms, cache data, and utilize multi-threading). Overall, there is no absolute answer and it needs to be optimized according to the specific situation.
 What is the function of C language sum?
Apr 03, 2025 pm 02:21 PM
What is the function of C language sum?
Apr 03, 2025 pm 02:21 PM
There is no built-in sum function in C language, so it needs to be written by yourself. Sum can be achieved by traversing the array and accumulating elements: Loop version: Sum is calculated using for loop and array length. Pointer version: Use pointers to point to array elements, and efficient summing is achieved through self-increment pointers. Dynamically allocate array version: Dynamically allocate arrays and manage memory yourself, ensuring that allocated memory is freed to prevent memory leaks.
 Is there any mobile app that can convert XML into PDF?
Apr 02, 2025 pm 08:54 PM
Is there any mobile app that can convert XML into PDF?
Apr 02, 2025 pm 08:54 PM
An application that converts XML directly to PDF cannot be found because they are two fundamentally different formats. XML is used to store data, while PDF is used to display documents. To complete the transformation, you can use programming languages and libraries such as Python and ReportLab to parse XML data and generate PDF documents.
 How to convert xml into pictures
Apr 03, 2025 am 07:39 AM
How to convert xml into pictures
Apr 03, 2025 am 07:39 AM
XML can be converted to images by using an XSLT converter or image library. XSLT Converter: Use an XSLT processor and stylesheet to convert XML to images. Image Library: Use libraries such as PIL or ImageMagick to create images from XML data, such as drawing shapes and text.
 How to control the size of XML converted to images?
Apr 02, 2025 pm 07:24 PM
How to control the size of XML converted to images?
Apr 02, 2025 pm 07:24 PM
To generate images through XML, you need to use graph libraries (such as Pillow and JFreeChart) as bridges to generate images based on metadata (size, color) in XML. The key to controlling the size of the image is to adjust the values of the <width> and <height> tags in XML. However, in practical applications, the complexity of XML structure, the fineness of graph drawing, the speed of image generation and memory consumption, and the selection of image formats all have an impact on the generated image size. Therefore, it is necessary to have a deep understanding of XML structure, proficient in the graphics library, and consider factors such as optimization algorithms and image format selection.
 Is there a mobile app that can convert XML into PDF?
Apr 02, 2025 pm 09:45 PM
Is there a mobile app that can convert XML into PDF?
Apr 02, 2025 pm 09:45 PM
There is no APP that can convert all XML files into PDFs because the XML structure is flexible and diverse. The core of XML to PDF is to convert the data structure into a page layout, which requires parsing XML and generating PDF. Common methods include parsing XML using Python libraries such as ElementTree and generating PDFs using ReportLab library. For complex XML, it may be necessary to use XSLT transformation structures. When optimizing performance, consider using multithreaded or multiprocesses and select the appropriate library.
 What is the process of converting XML into images?
Apr 02, 2025 pm 08:24 PM
What is the process of converting XML into images?
Apr 02, 2025 pm 08:24 PM
To convert XML images, you need to determine the XML data structure first, then select a suitable graphical library (such as Python's matplotlib) and method, select a visualization strategy based on the data structure, consider the data volume and image format, perform batch processing or use efficient libraries, and finally save it as PNG, JPEG, or SVG according to the needs.
