How to create and customize Venn diagrams in Python?
A Venn diagram is a diagram used to represent the relationship between sets. To create a Venn diagram we will use matplotlib.
Matplotlib is a commonly used data visualization library in Python for creating interactive charts and graphs. It is also used to create interactive images and charts. Matplotlib provides many functions to customize charts and graphs. In this tutorial, we will illustrate three examples to customize Venn diagrams.
The Chinese translation ofExample
is:Example
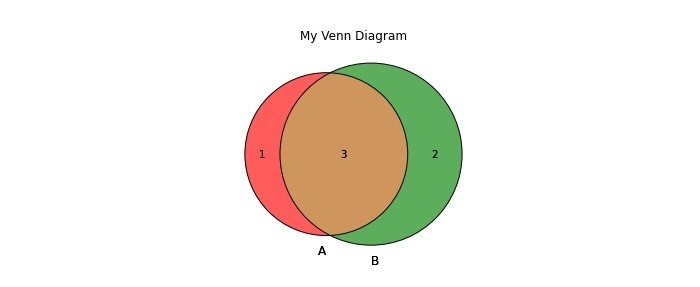
This is a simple example of creating the intersection of two Venn diagrams; first, we import the necessary libraries and import venns. We then created the dataset as a Python set, after which we created a Venn diagram using the “venn2()” function. Next, we customize the graph by setting the line width to 1 using "lw"; finally, we represent the graph using "plt.show()"; and finally, this code shows the simple intersection of two Venns.
import matplotlib.pyplot as plt
from matplotlib_venn import venn2, venn2_circles, venn3, venn3_circles
set1 = set(['A' , 'B', 'C', 'D'])
set2 = set(['B', 'C', 'D', 'E', 'F'])
set3 = set(['C', 'E', 'F', 'G'])
venn2([set1, set2])
venn2([set1, set2])
venn2_circles([set1, set2], lw=1)
plt.title("My Venn Diagram")
plt.show()
Output

Example
is:Example
This example shows three disjoint Venn diagrams, namely 'cir1', 'cir2' and 'cir3'. In this example, we first imported venns and matplotlib, then created three datasets and set up different elements in different Venn diagrams. We represent this as a Venn diagram using the ‘venn3()’ function and finally plot it using ‘plt.show()’.
import matplotlib.pyplot as plt
from matplotlib_venn import venn3

# create sets for primary colors
cir1 = set(['apple', 'cherry', 'strawberry'])
cir2 = set(['banana', 'lemon', 'pineapple'])
cir3 = set(['blueberry', 'grape', 'plum'])

# create Venn diagram
venn3([cir1, cir2, cir3], ('cir1', 'cir2', 'cir3'))

# display the diagram
plt.show()
Output

Example
is:Example
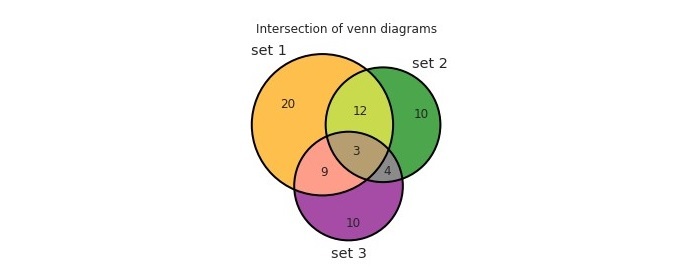
This example demonstrates three intersecting Venn diagrams, namely "set 1", "set 2" and "set 3", then we use "venn3()" to depict the Venn diagram, we also use "set_labels() ” Mark it and set it to appear a different color. Next, we give the outline a linewidth of 2 using "linewidth". Finally, we set the title to "Intersection of Venn Diagram" and plot it using "plt.show()".
from matplotlib_venn import venn3, venn3_circles
from matplotlib import pyplot as plt
venn3(subsets=(20, 10, 12, 10, 9, 4, 3), set_labels=('set 1', 'set 2', 'set 3'), set_colors=("orange", "green", "purple"), alpha=0.7)
venn3_circles(subsets=(20, 10, 12, 10, 9, 4, 3), linewidth=2)
plt.title("Intersection of venn diagrams")
plt.show()
Output

We learned that Matplotlib is a very powerful library for creating Venn diagrams; it provides many functions for customizing Venn diagrams to describe information; developers can use this Python library to easily create Venn diagrams, and Further customize the Venn diagram by changing the color of the circles, adjusting the font size and style, Venn diagrams are very helpful for visually representing the relationships between multiple sets. It has several advantages; it helps visualize information and understand and remember complex topics. Mathematicians use it to easily present complex data
The above is the detailed content of How to create and customize Venn diagrams in Python?. For more information, please follow other related articles on the PHP Chinese website!

Hot AI Tools

Undresser.AI Undress
AI-powered app for creating realistic nude photos

AI Clothes Remover
Online AI tool for removing clothes from photos.

Undress AI Tool
Undress images for free

Clothoff.io
AI clothes remover

AI Hentai Generator
Generate AI Hentai for free.

Hot Article

Hot Tools

Notepad++7.3.1
Easy-to-use and free code editor

SublimeText3 Chinese version
Chinese version, very easy to use

Zend Studio 13.0.1
Powerful PHP integrated development environment

Dreamweaver CS6
Visual web development tools

SublimeText3 Mac version
God-level code editing software (SublimeText3)

Hot Topics
 1376
1376
 52
52
 How to use mysql after installation
Apr 08, 2025 am 11:48 AM
The article introduces the operation of MySQL database. First, you need to install a MySQL client, such as MySQLWorkbench or command line client. 1. Use the mysql-uroot-p command to connect to the server and log in with the root account password; 2. Use CREATEDATABASE to create a database, and USE select a database; 3. Use CREATETABLE to create a table, define fields and data types; 4. Use INSERTINTO to insert data, query data, update data by UPDATE, and delete data by DELETE. Only by mastering these steps, learning to deal with common problems and optimizing database performance can you use MySQL efficiently.
 How does PS feathering control the softness of the transition?
Apr 06, 2025 pm 07:33 PM
The key to feather control is to understand its gradual nature. PS itself does not provide the option to directly control the gradient curve, but you can flexibly adjust the radius and gradient softness by multiple feathering, matching masks, and fine selections to achieve a natural transition effect.
 Do mysql need to pay
Apr 08, 2025 pm 05:36 PM
MySQL has a free community version and a paid enterprise version. The community version can be used and modified for free, but the support is limited and is suitable for applications with low stability requirements and strong technical capabilities. The Enterprise Edition provides comprehensive commercial support for applications that require a stable, reliable, high-performance database and willing to pay for support. Factors considered when choosing a version include application criticality, budgeting, and technical skills. There is no perfect option, only the most suitable option, and you need to choose carefully according to the specific situation.
 How to set up PS feathering?
Apr 06, 2025 pm 07:36 PM
PS feathering is an image edge blur effect, which is achieved by weighted average of pixels in the edge area. Setting the feather radius can control the degree of blur, and the larger the value, the more blurred it is. Flexible adjustment of the radius can optimize the effect according to images and needs. For example, using a smaller radius to maintain details when processing character photos, and using a larger radius to create a hazy feeling when processing art works. However, it should be noted that too large the radius can easily lose edge details, and too small the effect will not be obvious. The feathering effect is affected by the image resolution and needs to be adjusted according to image understanding and effect grasp.
 How to optimize database performance after mysql installation
Apr 08, 2025 am 11:36 AM
MySQL performance optimization needs to start from three aspects: installation configuration, indexing and query optimization, monitoring and tuning. 1. After installation, you need to adjust the my.cnf file according to the server configuration, such as the innodb_buffer_pool_size parameter, and close query_cache_size; 2. Create a suitable index to avoid excessive indexes, and optimize query statements, such as using the EXPLAIN command to analyze the execution plan; 3. Use MySQL's own monitoring tool (SHOWPROCESSLIST, SHOWSTATUS) to monitor the database health, and regularly back up and organize the database. Only by continuously optimizing these steps can the performance of MySQL database be improved.
 What impact does PS feathering have on image quality?
Apr 06, 2025 pm 07:21 PM
PS feathering can lead to loss of image details, reduced color saturation and increased noise. To reduce the impact, it is recommended to use a smaller feather radius, copy the layer and then feather, and carefully compare the image quality before and after feathering. In addition, feathering is not suitable for all cases, and sometimes tools such as masks are more suitable for handling image edges.
 How to optimize MySQL performance for high-load applications?
Apr 08, 2025 pm 06:03 PM
MySQL database performance optimization guide In resource-intensive applications, MySQL database plays a crucial role and is responsible for managing massive transactions. However, as the scale of application expands, database performance bottlenecks often become a constraint. This article will explore a series of effective MySQL performance optimization strategies to ensure that your application remains efficient and responsive under high loads. We will combine actual cases to explain in-depth key technologies such as indexing, query optimization, database design and caching. 1. Database architecture design and optimized database architecture is the cornerstone of MySQL performance optimization. Here are some core principles: Selecting the right data type and selecting the smallest data type that meets the needs can not only save storage space, but also improve data processing speed.
 Navicat's method to view MongoDB database password
Apr 08, 2025 pm 09:39 PM
It is impossible to view MongoDB password directly through Navicat because it is stored as hash values. How to retrieve lost passwords: 1. Reset passwords; 2. Check configuration files (may contain hash values); 3. Check codes (may hardcode passwords).


