

How to annotate a grouped bar chart in Python?

Introduction
As data visualization becomes an integral part of every data analysis project, bar charts become an excellent tool for representing categorical data. Grouped bar charts are especially useful when we want to compare multiple groups side by side.
Syntax and use cases
Annotations can be added to bar charts to provide additional information or illustrate the data presented. matplotlib's annotation functionality can be used to add these annotations to each bar plot. The function takes the following parameters -
text - The text to display in the annotation.
xy - The point (x, y) to annotate.
xytext - Determine text position.
ha - The horizontal alignment of the text (e.g. "center", "left", "right").
va - The vertical alignment of the text (e.g. "center", "top", "bottom").
Use comments to improve the readability and interpretability of grouped bar charts. Here are two instances where annotating bars in a grouped bar chart might be helpful -
Compare absolute and relative values
Comparing the absolute values of bars of different heights in a grouped bar chart can be difficult. Readers may find it easier to compare the absolute values of each group if the bar plots are labeled with corresponding values. By annotating the bar chart with relative values, readers can also get a clearer picture of the distribution of values within each category.
Highlight significant differences
To compare the means or proportions of multiple groups, you can use a group bar chart. Adding p-values or confidence intervals to bar plots may help readers identify significant differences between groups. Additionally, you can visually highlight bars with statistically significant differences by placing asterisks or other symbols above the bars. This helps readers understand the results of statistical analysis and draw inferences from the data.
Code and Description
algorithm
Import the necessary libraries: matplotlib and numpy
Create the dataset to plot
Use matplotlib’s subplots function to define graphics and axis objects
Use the bar function to draw a grouped bar chart
Loop through each bar and add text annotations using matplotlib’s annotation function
import matplotlib.pyplot as plt
import numpy as np
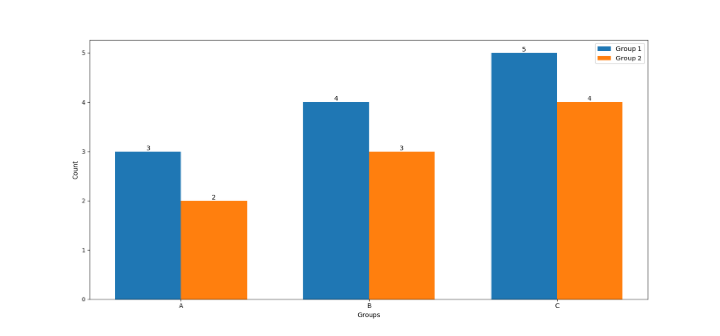
# create sample dataset
data = np.array([[3, 4, 5], [2, 3, 4]])
# define labels and groups
labels = ['Group 1', 'Group 2']
groups = ['A', 'B', 'C']
# define figure and axis objects
fig, ax = plt.subplots()
# plot the grouped bar chart
width = 0.35
x = np.arange(len(groups))
ax.bar(x - width/2, data[0], width, label=labels[0])
ax.bar(x + width/2, data[1], width, label=labels[1])
# add text annotations to each bar
for i, j in enumerate(data):
for x_val, y_val in zip(x, j):
ax.annotate(str(y_val), xy=(x_val+i*width-width/2, y_val), ha='center', va='bottom')
# add labels and legend
ax.set_xticks(x)
ax.set_xticklabels(groups)
ax.set_xlabel('Groups')
ax.set_ylabel('Count')
ax.legend()
plt.show()
First, import the essential libraries for the task, specifically the well-known numpy and matplotlib.
The example data set is generated by applying a numpy array of two rows and three columns. The labels for groups and bars are defined in order to correctly identify the plot.
To create a plot, figure and axis objects are generated through matplotlib's subplots function. Then use the bar function to draw a grouped bar chart, where the width of each bar is specified as 0.35. Then plot a bar chart for each group with the corresponding data, selected using the labels parameter.
The comment function is used inside a nested for loop to add a text comment to each bar. The function accepts the x and y coordinates of each bar and the height of the bar as a text annotation.
Plots are labeled using matplotlib's set_xticks, set_xticklabels, set_xlabel, set_ylabel, and legend functions, which allow the x- and y-axes to be correctly labeled, plot titles, and adding a legend to the plot.
in conclusion
Adding comments to grouped bar charts in Python can provide additional information or explanation of the data being presented. Using matplotlib's annotation functionality, we can easily add textual annotations to each bar plot by following the step-by-step algorithm outlined in this article.
The above is the detailed content of How to annotate a grouped bar chart in Python?. For more information, please follow other related articles on the PHP Chinese website!

Hot AI Tools

Undresser.AI Undress
AI-powered app for creating realistic nude photos

AI Clothes Remover
Online AI tool for removing clothes from photos.

Undress AI Tool
Undress images for free

Clothoff.io
AI clothes remover

AI Hentai Generator
Generate AI Hentai for free.

Hot Article
Hot Tools

Notepad++7.3.1
Easy-to-use and free code editor

SublimeText3 Chinese version
Chinese version, very easy to use

Zend Studio 13.0.1
Powerful PHP integrated development environment

Dreamweaver CS6
Visual web development tools

SublimeText3 Mac version
God-level code editing software (SublimeText3)
Hot Topics
 1377
1377
 52
52

 Do mysql need to pay
Apr 08, 2025 pm 05:36 PM
Do mysql need to pay
Apr 08, 2025 pm 05:36 PM
MySQL has a free community version and a paid enterprise version. The community version can be used and modified for free, but the support is limited and is suitable for applications with low stability requirements and strong technical capabilities. The Enterprise Edition provides comprehensive commercial support for applications that require a stable, reliable, high-performance database and willing to pay for support. Factors considered when choosing a version include application criticality, budgeting, and technical skills. There is no perfect option, only the most suitable option, and you need to choose carefully according to the specific situation.
 HadiDB: A lightweight, horizontally scalable database in Python
Apr 08, 2025 pm 06:12 PM
HadiDB: A lightweight, horizontally scalable database in Python
Apr 08, 2025 pm 06:12 PM
HadiDB: A lightweight, high-level scalable Python database HadiDB (hadidb) is a lightweight database written in Python, with a high level of scalability. Install HadiDB using pip installation: pipinstallhadidb User Management Create user: createuser() method to create a new user. The authentication() method authenticates the user's identity. fromhadidb.operationimportuseruser_obj=user("admin","admin")user_obj.
 Can mysql workbench connect to mariadb
Apr 08, 2025 pm 02:33 PM
Can mysql workbench connect to mariadb
Apr 08, 2025 pm 02:33 PM
MySQL Workbench can connect to MariaDB, provided that the configuration is correct. First select "MariaDB" as the connector type. In the connection configuration, set HOST, PORT, USER, PASSWORD, and DATABASE correctly. When testing the connection, check that the MariaDB service is started, whether the username and password are correct, whether the port number is correct, whether the firewall allows connections, and whether the database exists. In advanced usage, use connection pooling technology to optimize performance. Common errors include insufficient permissions, network connection problems, etc. When debugging errors, carefully analyze error information and use debugging tools. Optimizing network configuration can improve performance
 Navicat's method to view MongoDB database password
Apr 08, 2025 pm 09:39 PM
Navicat's method to view MongoDB database password
Apr 08, 2025 pm 09:39 PM
It is impossible to view MongoDB password directly through Navicat because it is stored as hash values. How to retrieve lost passwords: 1. Reset passwords; 2. Check configuration files (may contain hash values); 3. Check codes (may hardcode passwords).
 How to solve mysql cannot connect to local host
Apr 08, 2025 pm 02:24 PM
How to solve mysql cannot connect to local host
Apr 08, 2025 pm 02:24 PM
The MySQL connection may be due to the following reasons: MySQL service is not started, the firewall intercepts the connection, the port number is incorrect, the user name or password is incorrect, the listening address in my.cnf is improperly configured, etc. The troubleshooting steps include: 1. Check whether the MySQL service is running; 2. Adjust the firewall settings to allow MySQL to listen to port 3306; 3. Confirm that the port number is consistent with the actual port number; 4. Check whether the user name and password are correct; 5. Make sure the bind-address settings in my.cnf are correct.
 Does mysql need the internet
Apr 08, 2025 pm 02:18 PM
Does mysql need the internet
Apr 08, 2025 pm 02:18 PM
MySQL can run without network connections for basic data storage and management. However, network connection is required for interaction with other systems, remote access, or using advanced features such as replication and clustering. Additionally, security measures (such as firewalls), performance optimization (choose the right network connection), and data backup are critical to connecting to the Internet.
 How to optimize MySQL performance for high-load applications?
Apr 08, 2025 pm 06:03 PM
How to optimize MySQL performance for high-load applications?
Apr 08, 2025 pm 06:03 PM
MySQL database performance optimization guide In resource-intensive applications, MySQL database plays a crucial role and is responsible for managing massive transactions. However, as the scale of application expands, database performance bottlenecks often become a constraint. This article will explore a series of effective MySQL performance optimization strategies to ensure that your application remains efficient and responsive under high loads. We will combine actual cases to explain in-depth key technologies such as indexing, query optimization, database design and caching. 1. Database architecture design and optimized database architecture is the cornerstone of MySQL performance optimization. Here are some core principles: Selecting the right data type and selecting the smallest data type that meets the needs can not only save storage space, but also improve data processing speed.
 How to use AWS Glue crawler with Amazon Athena
Apr 09, 2025 pm 03:09 PM
How to use AWS Glue crawler with Amazon Athena
Apr 09, 2025 pm 03:09 PM
As a data professional, you need to process large amounts of data from various sources. This can pose challenges to data management and analysis. Fortunately, two AWS services can help: AWS Glue and Amazon Athena.
