

How to create a bar chart in React using Material UI and Devexpress?

Material UI is a popular CSS library that we can use to style React applications. It contains various pre-styled React components that we can use directly in our application by importing them into the code.
'dx-react-chart-material-ui' is an NPM package of Devexpress that can connect devexpress's material-ui and 'dx-react-chart' libraries. "dx-react-chart" is used to create charts and Material UI is used to style charts.
Users can execute the following command to install Material UI in React applications.
npm install @mui/material @emotion/react @emotion/styled
Additionally, execute the following command to install the Devexpress NPM package.
npm i @devexpress/dx-react-chart
grammar
Users can create bar charts using Devexpress according to the following syntax.
<Chart data = {data}>
   <BarSeries valueField = "price" argumentField = "fruit" />
   <Title text = "Fruit price" />
</Chart>
In the above syntax, we use the "Chart", "BarSeries" and "Title" components of DevExpress. The "Chart" component displays a chart, the "BarSeries" component displays a bar chart, and the "Title" component displays a title.
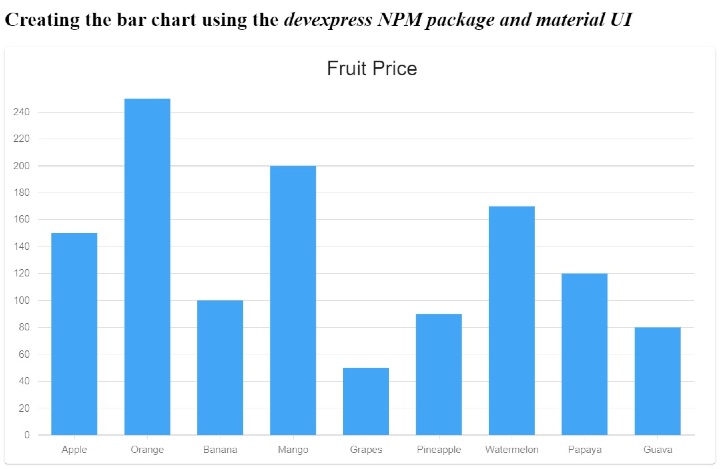
Example 1 (simple bar chart)
In the example below, we imported the "Paper" component from Material UI. Additionally, we imported the required components from the "devexpress" NPM package.
We also define the data[] array containing the chart data. It contains the name and price of the fruit. Let's create a simple bar chart to compare fruit prices. In the output, the user can observe the bar graph.
import React, { useState } from "react";
import Paper from "@mui/material/Paper";
import {
   Chart,
   BarSeries,
   Title,
   ArgumentAxis,
   ValueAxis,
} from "@devexpress/dx-react-chart-material-ui";
import { Animation } from "@devexpress/dx-react-chart";

const data = [
   { fruit: "Apple", price: 150 },
   { fruit: "Orange", price: 250 },
   { fruit: "Banana", price: 100 },
   { fruit: "Mango", price: 200 },
   { fruit: "Grapes", price: 50 },
   { fruit: "Pineapple", price: 90 },
   { fruit: "Watermelon", price: 170 },
   { fruit: "Papaya", price: 120 },
   { fruit: "Guava", price: 80 },
];

function App() {
   return (
      <div>
         <h2>
            Creating the{" "}
            bar chart using the <i>  devexpress NPM   package and material UI </i>
         </h2>
         <Paper>
            <Chart data = {data}>
               <ArgumentAxis />
               <ValueAxis max = {200} />
               <BarSeries valueField = "price" argumentField = "fruit" />
               <Title text = "Fruit Price" />
               <Animation />
            </Chart>
         </Paper>
      </div>
   );
}
export default App;
Output
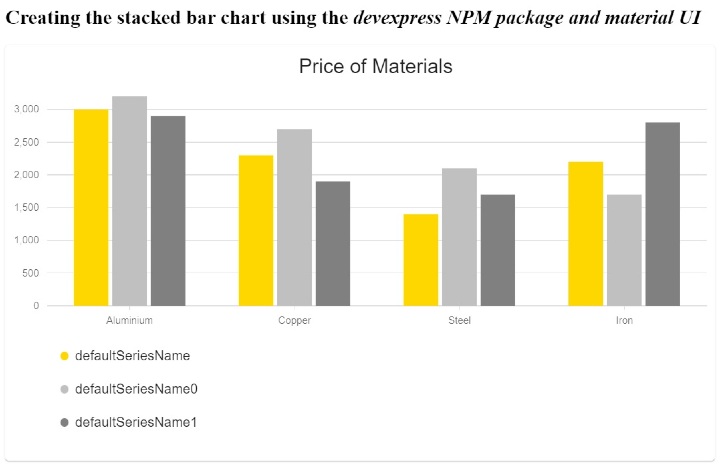
Example 2 (side-by-side bar chart)
In the example below, we demonstrate how to create a side-by-side bar chart. The data contains material name and price according to color.
This chart contains a series of 3 bars for a single material, each bar representing a different color. We use the "Barseries" component to create a bar for each material. Additionally, we set the component's title.
In the output, the user can observe side-by-side bar charts, each bar comparing the prices of different materials based on color.
import React from "react";
import Paper from "@mui/material/Paper";
import {
   Chart,
   BarSeries,
   Title,
   ArgumentAxis,
   ValueAxis,
   Legend,
} from "@devexpress/dx-react-chart-material-ui";
import { Stack, Animation } from "@devexpress/dx-react-chart";

const chartData = [
   { material: "Aluminium", yellow: 3000, silver: 3200, grey: 2900 },
   { material: "Copper", yellow: 2300, silver: 2700, grey: 1900 },
   { material: "Steel", yellow: 1400, silver: 2100, grey: 1700 },
   { material: "Iron", yellow: 2200, silver: 1700, grey: 2800 },
];

function App() {
  return (
      <div>
      <h2>
         Creating the{" "}
         stacked bar chart using the <i> devexpress NPM package and material UI </i>
      </h2>
      <Paper>
         <Chart data = {chartData}>
            <ArgumentAxis />
            <ValueAxis />

            <BarSeries
               Name = "yellow color"
               valueField = "yellow"
               argumentField = "material"
               color = "#ffd700"
            />
            <BarSeries
               Name = "Silver color"
               valueField = "silver"
               argumentField = "material"
               color = "#c0c0c0"
            />
            <BarSeries
               Name = "grey color"
               valueField = "grey"
               argumentField = "material"
               color = "grey"
            />
            <Animation />
            <Legend position = "bottom" />
            <Title text = "Price of Materials" />
            <Stack />
         </Chart>
         </Paper>
      </div>
   );
}
export default App;
Output
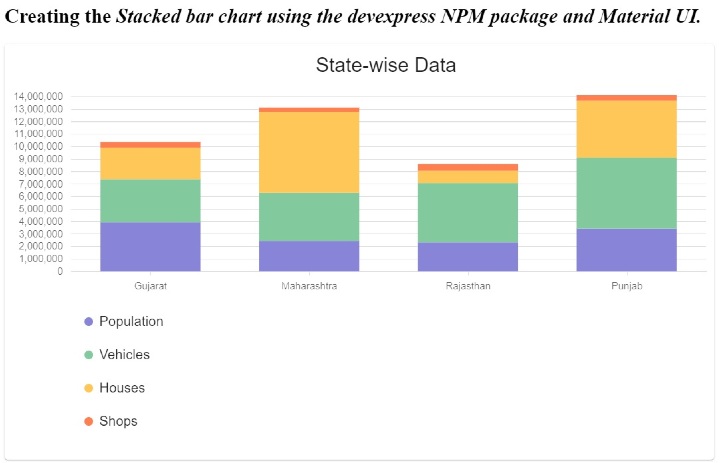
Example 3 (Stacked Bar Chart)
In the example below, we demonstrate how to create a stacked bar chart. We prepared population, vehicle, house and store data by state to create bar charts.
In the example below, we demonstrate how to create a stacked bar chart. We prepared population, vehicle, house and store data by state to create bar charts.
import React from "react";
import Paper from "@mui/material/Paper";
import {
   Chart,
   BarSeries,
   Title,
   ArgumentAxis,
   ValueAxis,
   Legend,
} from "@devexpress/dx-react-chart-material-ui";
import { Stack, Animation } from "@devexpress/dx-react-chart";

const chartData = [
   { state: "Gujarat", population: 3938223, vehicles: 3456800, houses: 2535447, shops: 454464 },
   { state: "Maharashtra", population: 2446456, vehicles: 3864500, houses: 6485534, shops: 344654 },
   { state: "Rajasthan", population: 2332543, vehicles: 4756549, houses: 981496, shops: 545621 },
   { state: "Punjab", population: 3434657, vehicles: 5686564, houses: 4569847, shops: 448734 },
];

function App() {
   return (
      <div>
         <h2>
            Creating the{" "}
            <i>
               Stacked bar chart using the devexpress NPM package and Material UI.
            </i>
         </h2>
         <Paper>
            <Chart data = {chartData}>
               <ArgumentAxis />
               <ValueAxis max = {50000000} />

               <BarSeries
                  name = "Population"
                  valueField = "population"
                  argumentField = "state"
                  color = "#8884d8"
               />
               <BarSeries
                  name = "Vehicles"
                  valueField = "vehicles"
                  argumentField = "state"
                  color = "#82ca9d"
               />
               <BarSeries
                  name = "Houses"
                  valueField = "houses"
                  argumentField = "state"
                  color = "#ffc658"
               />
               <BarSeries
                  name = "Shops"
                  valueField = "shops"
                  argumentField = "state"
                  color = "#ff7f50"
               />
               <Animation />
               <Legend position = "bottom" />
               <Title text = "State-wise Data" />
               <Stack stacks = {[{ series: ["Population", "Vehicles", "Houses", "Shops"] }]} />
            </Chart>
         </Paper>
      </div>
   );
}

export default App;
Output
We learned to create and design charts using Devexpress and Material UI libraries. The Devexpress NPM package is a bridge between Material UI and the Devexpress charting library. Additionally, we learned about creating various types of bar charts in this tutorial.
The above is the detailed content of How to create a bar chart in React using Material UI and Devexpress?. For more information, please follow other related articles on the PHP Chinese website!

Hot AI Tools

Undresser.AI Undress
AI-powered app for creating realistic nude photos

AI Clothes Remover
Online AI tool for removing clothes from photos.

Undress AI Tool
Undress images for free

Clothoff.io
AI clothes remover

AI Hentai Generator
Generate AI Hentai for free.

Hot Article
Hot Tools

Notepad++7.3.1
Easy-to-use and free code editor

SublimeText3 Chinese version
Chinese version, very easy to use

Zend Studio 13.0.1
Powerful PHP integrated development environment

Dreamweaver CS6
Visual web development tools

SublimeText3 Mac version
God-level code editing software (SublimeText3)
Hot Topics
 1385
1385
 52
52

 What should I do if I encounter garbled code printing for front-end thermal paper receipts?
Apr 04, 2025 pm 02:42 PM
What should I do if I encounter garbled code printing for front-end thermal paper receipts?
Apr 04, 2025 pm 02:42 PM
Frequently Asked Questions and Solutions for Front-end Thermal Paper Ticket Printing In Front-end Development, Ticket Printing is a common requirement. However, many developers are implementing...
 Who gets paid more Python or JavaScript?
Apr 04, 2025 am 12:09 AM
Who gets paid more Python or JavaScript?
Apr 04, 2025 am 12:09 AM
There is no absolute salary for Python and JavaScript developers, depending on skills and industry needs. 1. Python may be paid more in data science and machine learning. 2. JavaScript has great demand in front-end and full-stack development, and its salary is also considerable. 3. Influencing factors include experience, geographical location, company size and specific skills.
 How to merge array elements with the same ID into one object using JavaScript?
Apr 04, 2025 pm 05:09 PM
How to merge array elements with the same ID into one object using JavaScript?
Apr 04, 2025 pm 05:09 PM
How to merge array elements with the same ID into one object in JavaScript? When processing data, we often encounter the need to have the same ID...
 Demystifying JavaScript: What It Does and Why It Matters
Apr 09, 2025 am 12:07 AM
Demystifying JavaScript: What It Does and Why It Matters
Apr 09, 2025 am 12:07 AM
JavaScript is the cornerstone of modern web development, and its main functions include event-driven programming, dynamic content generation and asynchronous programming. 1) Event-driven programming allows web pages to change dynamically according to user operations. 2) Dynamic content generation allows page content to be adjusted according to conditions. 3) Asynchronous programming ensures that the user interface is not blocked. JavaScript is widely used in web interaction, single-page application and server-side development, greatly improving the flexibility of user experience and cross-platform development.
 The difference in console.log output result: Why are the two calls different?
Apr 04, 2025 pm 05:12 PM
The difference in console.log output result: Why are the two calls different?
Apr 04, 2025 pm 05:12 PM
In-depth discussion of the root causes of the difference in console.log output. This article will analyze the differences in the output results of console.log function in a piece of code and explain the reasons behind it. �...
 TypeScript for Beginners, Part 2: Basic Data Types
Mar 19, 2025 am 09:10 AM
TypeScript for Beginners, Part 2: Basic Data Types
Mar 19, 2025 am 09:10 AM
Once you have mastered the entry-level TypeScript tutorial, you should be able to write your own code in an IDE that supports TypeScript and compile it into JavaScript. This tutorial will dive into various data types in TypeScript. JavaScript has seven data types: Null, Undefined, Boolean, Number, String, Symbol (introduced by ES6) and Object. TypeScript defines more types on this basis, and this tutorial will cover all of them in detail. Null data type Like JavaScript, null in TypeScript
 How to achieve parallax scrolling and element animation effects, like Shiseido's official website?
or:
How can we achieve the animation effect accompanied by page scrolling like Shiseido's official website?
Apr 04, 2025 pm 05:36 PM
How to achieve parallax scrolling and element animation effects, like Shiseido's official website?
or:
How can we achieve the animation effect accompanied by page scrolling like Shiseido's official website?
Apr 04, 2025 pm 05:36 PM
Discussion on the realization of parallax scrolling and element animation effects in this article will explore how to achieve similar to Shiseido official website (https://www.shiseido.co.jp/sb/wonderland/)...
 Can PowerPoint run JavaScript?
Apr 01, 2025 pm 05:17 PM
Can PowerPoint run JavaScript?
Apr 01, 2025 pm 05:17 PM
JavaScript can be run in PowerPoint, and can be implemented by calling external JavaScript files or embedding HTML files through VBA. 1. To use VBA to call JavaScript files, you need to enable macros and have VBA programming knowledge. 2. Embed HTML files containing JavaScript, which are simple and easy to use but are subject to security restrictions. Advantages include extended functions and flexibility, while disadvantages involve security, compatibility and complexity. In practice, attention should be paid to security, compatibility, performance and user experience.
