

Nine commonly used Python feature importance analysis methods

Feature importance analysis is used to understand the usefulness or value of each feature (variable or input) in making predictions. The goal is to identify the most important features that have the greatest impact on the model output, and it is a method often used in machine learning.
Why is feature importance analysis important?
If there is a feature containing dozens or even numbers A dataset of hundreds of features, each of which may contribute to the performance of your machine learning model. But not all features are created equal. Some may be redundant or irrelevant, which increases modeling complexity and may lead to overfitting.
Feature importance analysis can identify and focus on the most informative features, resulting in several advantages: 1. Provide insights: By analyzing the importance of features, we can gain insights into which features in the data have the greatest impact on the results, thus helping us better understand the nature of the data. 2. Optimize the model: By identifying key features, we can optimize the performance of the model, reduce unnecessary computing and storage overhead, and improve the training and prediction efficiency of the model. 3. Feature selection: Feature importance analysis can help us select the features with the most predictive power, thereby improving the accuracy and generalization ability of the model. 4. Explain the model: Feature importance analysis can also help us explain the prediction results of the model, reveal the patterns and causal relationships behind the model, and enhance the interpretability of the model
- Improvement Model performance
- Reduced overfitting
- Faster training and inference
- Enhanced Interpretability
# Let’s take a deeper look at some methods of feature importance analysis in Python.
Feature Importance Analysis Method
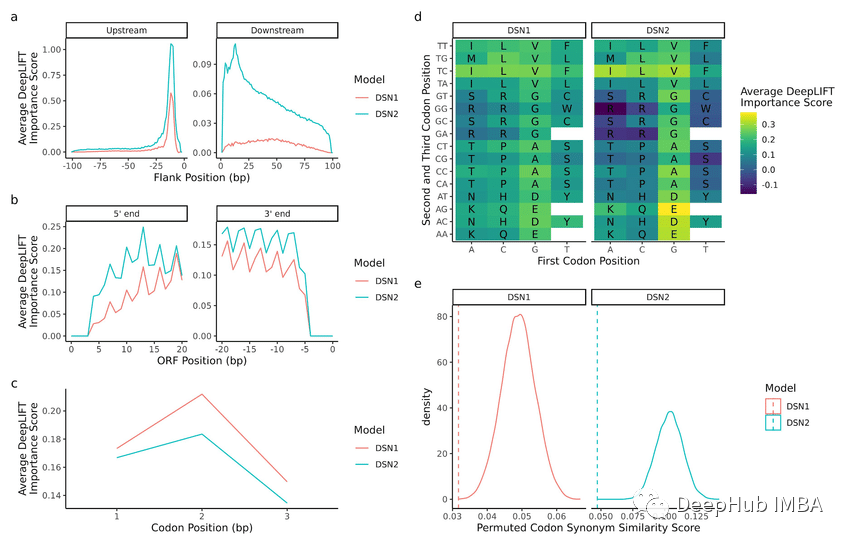
1. Permutation ImportancePermutationImportance
This method The values of each feature are randomly arranged, and then the degree of model performance degradation is monitored. If the decrease is larger, it means that the feature is more important
from sklearn.datasets import load_breast_cancer from sklearn.ensemble import RandomForestClassifier from sklearn.inspection import permutation_importance from sklearn.model_selection import train_test_split import matplotlib.pyplot as plt cancer = load_breast_cancer() X_train, X_test, y_train, y_test = train_test_split(cancer.data, cancer.target, random_state=1) rf = RandomForestClassifier(n_estimators=100, random_state=1) rf.fit(X_train, y_train) baseline = rf.score(X_test, y_test) result = permutation_importance(rf, X_test, y_test, n_repeats=10, random_state=1, scoring='accuracy') importances = result.importances_mean # Visualize permutation importances plt.bar(range(len(importances)), importances) plt.xlabel('Feature Index') plt.ylabel('Permutation Importance') plt.show()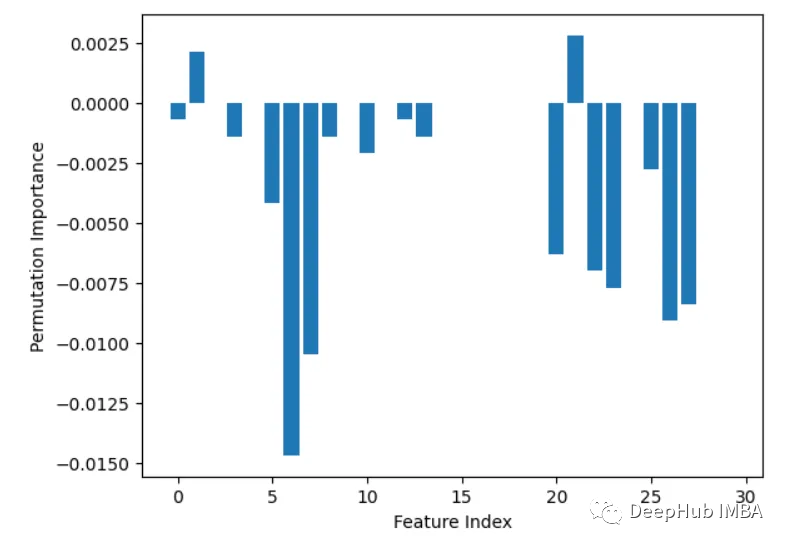
2. Built-in feature importance (coef_ or feature_importances_)
Some models, such as linear regression and random forests, can directly output feature importance scores. These show the contribution of each feature to the final prediction.
from sklearn.datasets import load_breast_cancer from sklearn.ensemble import RandomForestClassifier X, y = load_breast_cancer(return_X_y=True) rf = RandomForestClassifier(n_estimators=100, random_state=1) rf.fit(X, y) importances = rf.feature_importances_ # Plot importances plt.bar(range(X.shape[1]), importances) plt.xlabel('Feature Index') plt.ylabel('Feature Importance') plt.show()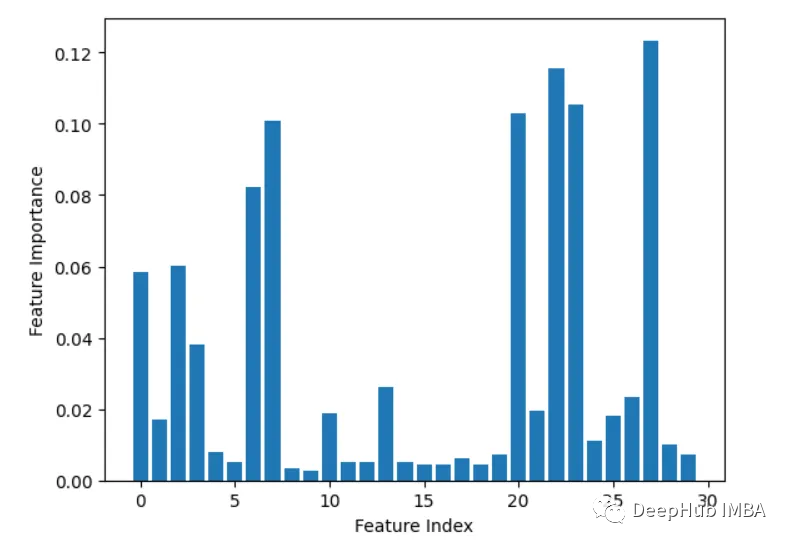
3. Leave-one-out
Iteratively delete one feature at a time and evaluate accuracy.
from sklearn.datasets import load_breast_cancer from sklearn.model_selection import train_test_split from sklearn.ensemble import RandomForestClassifier from sklearn.metrics import accuracy_score import matplotlib.pyplot as plt import numpy as np # Load sample data X, y = load_breast_cancer(return_X_y=True) # Split data into train and test sets X_train, X_test, y_train, y_test = train_test_split(X, y, test_size=0.3, random_state=1) # Train a random forest model rf = RandomForestClassifier(n_estimators=100, random_state=1) rf.fit(X_train, y_train) # Get baseline accuracy on test data base_acc = accuracy_score(y_test, rf.predict(X_test)) # Initialize empty list to store importances importances = [] # Iterate over all columns and remove one at a time for i in range(X_train.shape[1]):X_temp = np.delete(X_train, i, axis=1)rf.fit(X_temp, y_train)acc = accuracy_score(y_test, rf.predict(np.delete(X_test, i, axis=1)))importances.append(base_acc - acc) # Plot importance scores plt.bar(range(len(importances)), importances) plt.show()
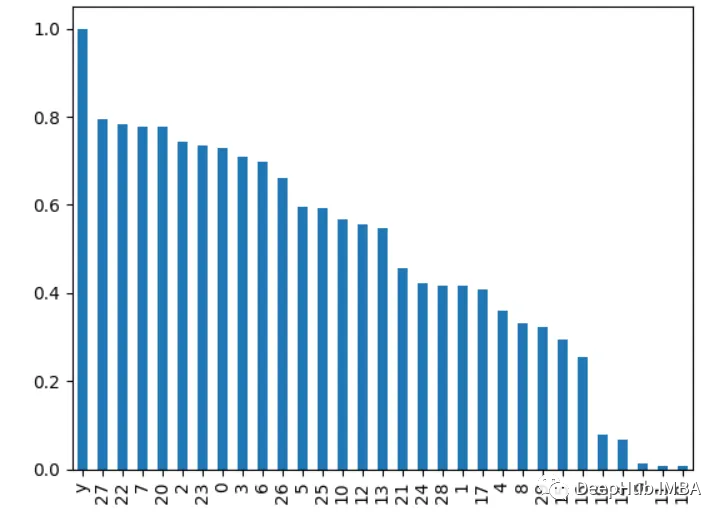
4. Correlation analysis
The content that needs to be rewritten is: Calculation features and goals Correlation between variables, the higher the correlation, the more important the feature
import pandas as pd from sklearn.datasets import load_breast_cancer X, y = load_breast_cancer(return_X_y=True) df = pd.DataFrame(X, columns=range(30)) df['y'] = y correlations = df.corrwith(df.y).abs() correlations.sort_values(ascending=False, inplace=True) correlations.plot.bar()
##5. Recursive Feature Elimination
Recursively remove features and see how it affects model performance. Features that result in larger drops when removed are more important.
from sklearn.ensemble import RandomForestClassifier from sklearn.feature_selection import RFE import pandas as pd from sklearn.datasets import load_breast_cancer import matplotlib.pyplot as plt X, y = load_breast_cancer(return_X_y=True) df = pd.DataFrame(X, columns=range(30)) df['y'] = y rf = RandomForestClassifier() rfe = RFE(rf, n_features_to_select=10) rfe.fit(X, y) print(rfe.ranking_)
The output is [6 4 11 12 7 11 18 21 8 16 10 3 15 14 19 17 20 13 11 11 12 9 11 5 11]
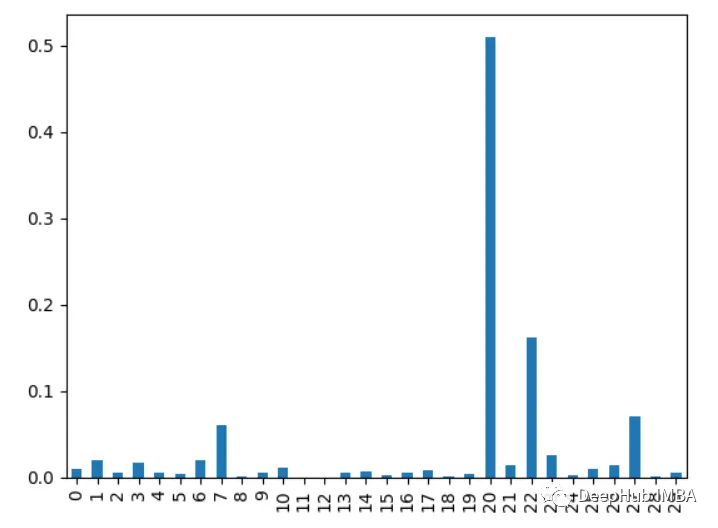
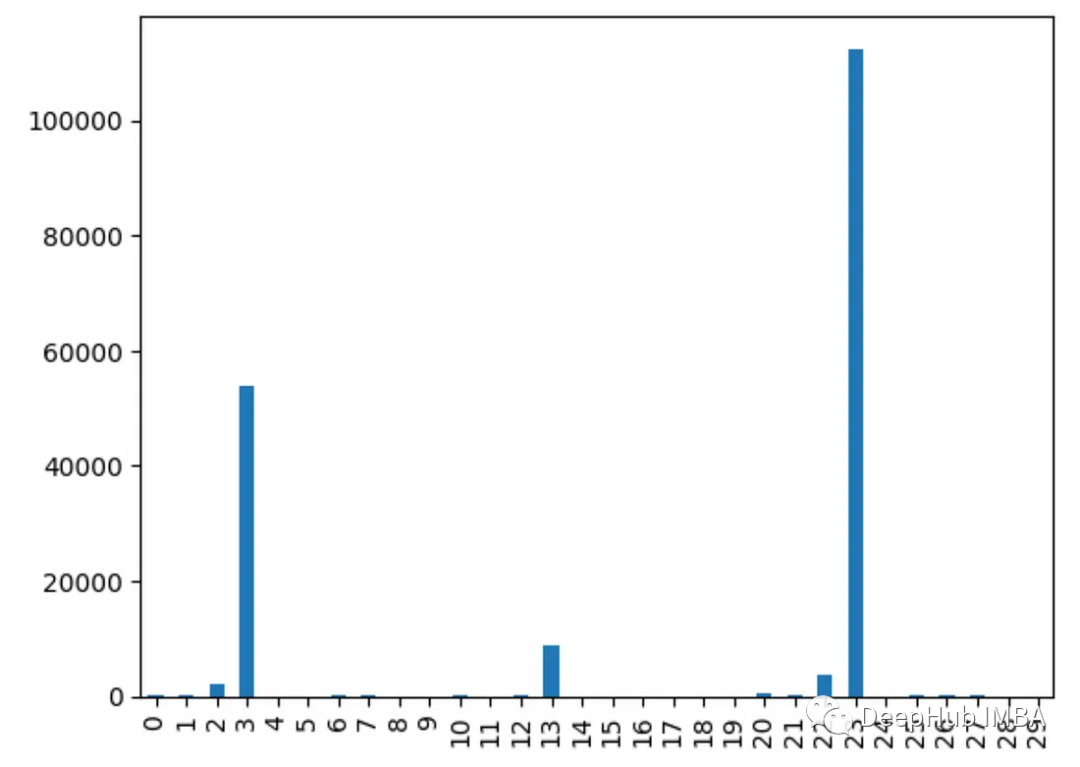
6. XGBoost feature importance
Calculate the number of times a feature is used in splitting data. This feature is used in all trees. More splits mean more important
import xgboost as xgb import pandas as pd from sklearn.datasets import load_breast_cancer import matplotlib.pyplot as plt X, y = load_breast_cancer(return_X_y=True) df = pd.DataFrame(X, columns=range(30)) df['y'] = y model = xgb.XGBClassifier() model.fit(X, y) importances = model.feature_importances_ importances = pd.Series(importances, index=range(X.shape[1])) importances.plot.bar()
7. Principal component analysis PCA
pair Perform principal component analysis on the features and view the explained variance ratio of each principal component. Characteristics with higher loads on the first few components are more important.
from sklearn.decomposition import PCA import pandas as pd from sklearn.datasets import load_breast_cancer import matplotlib.pyplot as plt X, y = load_breast_cancer(return_X_y=True) df = pd.DataFrame(X, columns=range(30)) df['y'] = y pca = PCA() pca.fit(X) plt.bar(range(pca.n_components_), pca.explained_variance_ratio_) plt.xlabel('PCA components') plt.ylabel('Explained Variance')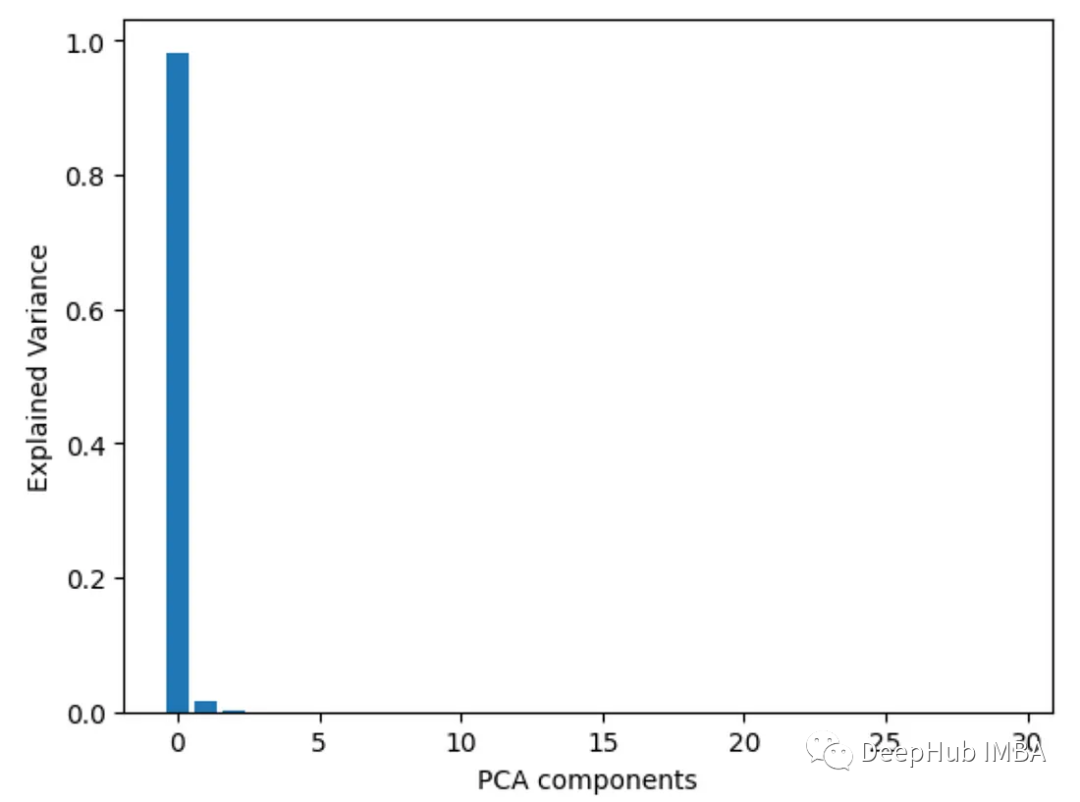
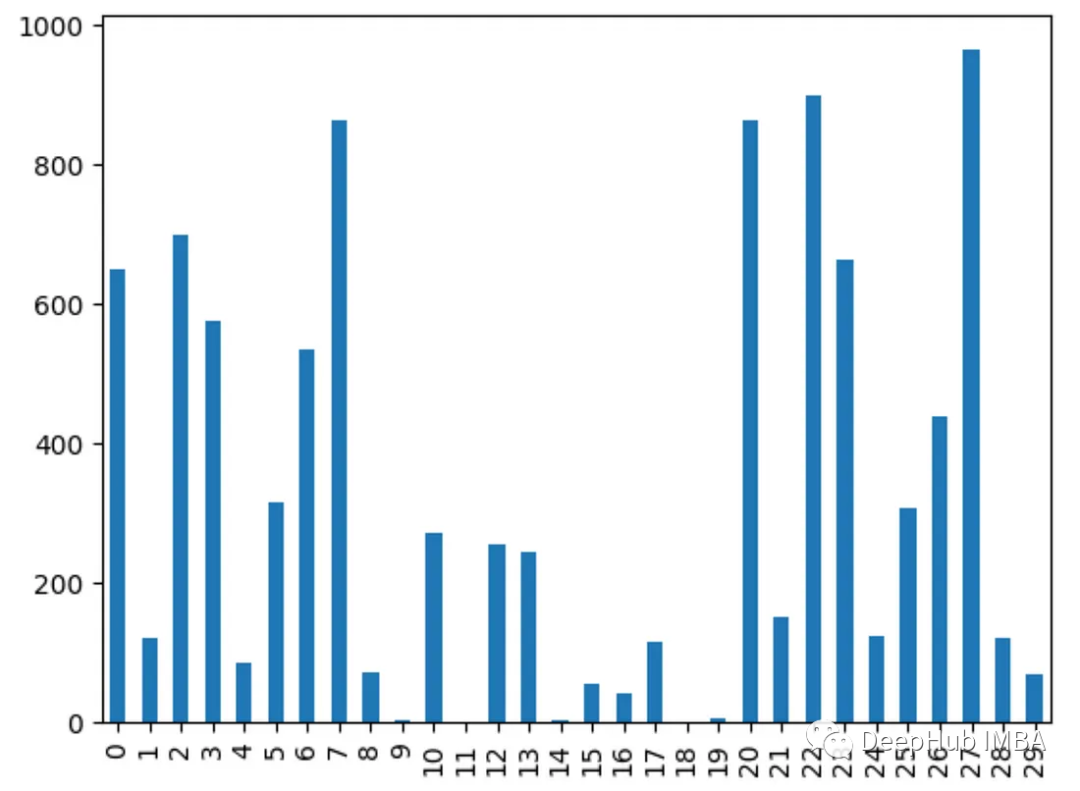
8. Analysis of variance ANOVA
Use f_classif() to obtain the analysis of variance of each feature f value. The higher the f value, the stronger the correlation between the feature and the target.
from sklearn.feature_selection import f_classif import pandas as pd from sklearn.datasets import load_breast_cancer import matplotlib.pyplot as plt X, y = load_breast_cancer(return_X_y=True) df = pd.DataFrame(X, columns=range(30)) df['y'] = y fval = f_classif(X, y) fval = pd.Series(fval[0], index=range(X.shape[1])) fval.plot.bar()
9. Chi-square test
Use the chi2() function to obtain the value of each feature Chi-square statistics. Features with higher scores are more likely to be independent of the target variable
from sklearn.feature_selection import chi2 import pandas as pd from sklearn.datasets import load_breast_cancer import matplotlib.pyplot as plt X, y = load_breast_cancer(return_X_y=True) df = pd.DataFrame(X, columns=range(30)) df['y'] = y chi_scores = chi2(X, y) chi_scores = pd.Series(chi_scores[0], index=range(X.shape[1])) chi_scores.plot.bar()
为什么不同的方法会检测到不同的特征?
由于不同的特征重要性方法,有时可以确定哪些特征是最重要的
1、他们用不同的方式衡量重要性:
有的使用不同特特征进行预测,监控精度下降
像XGBOOST或者回归模型使用内置重要性来进行特征的重要性排序
而PCA着眼于方差解释
2、不同模型有不同模型的方法:
线性模型偏向于处理线性关系,而树模型则更倾向于捕捉接近根节点的特征
3、交互作用:
有些方法可以获取特征之间的相互关系,而有些方法则不行,这会导致结果的不同
3、不稳定:
使用不同的数据子集,重要性值可能在同一方法的不同运行中有所不同,这是因为数据差异决定的
4、Hyperparameters:
通过调整超参数,例如主成分分析(PCA)组件或决策树的深度,也会对结果产生影响
所以不同的假设、偏差、数据处理和方法的可变性意味着它们并不总是在最重要的特征上保持一致。
选择特征重要性分析方法的一些最佳实践
- 尝试多种方法以获得更健壮的视图
- 聚合结果的集成方法
- 更多地关注相对顺序,而不是绝对值
- 差异并不一定意味着有问题,检查差异的原因会对数据和模型有更深入的了解
The above is the detailed content of Nine commonly used Python feature importance analysis methods. For more information, please follow other related articles on the PHP Chinese website!

Hot AI Tools

Undresser.AI Undress
AI-powered app for creating realistic nude photos

AI Clothes Remover
Online AI tool for removing clothes from photos.

Undress AI Tool
Undress images for free

Clothoff.io
AI clothes remover

Video Face Swap
Swap faces in any video effortlessly with our completely free AI face swap tool!

Hot Article
Hot Tools

Notepad++7.3.1
Easy-to-use and free code editor

SublimeText3 Chinese version
Chinese version, very easy to use

Zend Studio 13.0.1
Powerful PHP integrated development environment

Dreamweaver CS6
Visual web development tools

SublimeText3 Mac version
God-level code editing software (SublimeText3)
Hot Topics
 1386
1386
 52
52

 Can vs code run in Windows 8
Apr 15, 2025 pm 07:24 PM
Can vs code run in Windows 8
Apr 15, 2025 pm 07:24 PM
VS Code can run on Windows 8, but the experience may not be great. First make sure the system has been updated to the latest patch, then download the VS Code installation package that matches the system architecture and install it as prompted. After installation, be aware that some extensions may be incompatible with Windows 8 and need to look for alternative extensions or use newer Windows systems in a virtual machine. Install the necessary extensions to check whether they work properly. Although VS Code is feasible on Windows 8, it is recommended to upgrade to a newer Windows system for a better development experience and security.
 How to run programs in terminal vscode
Apr 15, 2025 pm 06:42 PM
How to run programs in terminal vscode
Apr 15, 2025 pm 06:42 PM
In VS Code, you can run the program in the terminal through the following steps: Prepare the code and open the integrated terminal to ensure that the code directory is consistent with the terminal working directory. Select the run command according to the programming language (such as Python's python your_file_name.py) to check whether it runs successfully and resolve errors. Use the debugger to improve debugging efficiency.
 Can visual studio code be used in python
Apr 15, 2025 pm 08:18 PM
Can visual studio code be used in python
Apr 15, 2025 pm 08:18 PM
VS Code can be used to write Python and provides many features that make it an ideal tool for developing Python applications. It allows users to: install Python extensions to get functions such as code completion, syntax highlighting, and debugging. Use the debugger to track code step by step, find and fix errors. Integrate Git for version control. Use code formatting tools to maintain code consistency. Use the Linting tool to spot potential problems ahead of time.
 Is the vscode extension malicious?
Apr 15, 2025 pm 07:57 PM
Is the vscode extension malicious?
Apr 15, 2025 pm 07:57 PM
VS Code extensions pose malicious risks, such as hiding malicious code, exploiting vulnerabilities, and masturbating as legitimate extensions. Methods to identify malicious extensions include: checking publishers, reading comments, checking code, and installing with caution. Security measures also include: security awareness, good habits, regular updates and antivirus software.
 Golang vs. Python: Concurrency and Multithreading
Apr 17, 2025 am 12:20 AM
Golang vs. Python: Concurrency and Multithreading
Apr 17, 2025 am 12:20 AM
Golang is more suitable for high concurrency tasks, while Python has more advantages in flexibility. 1.Golang efficiently handles concurrency through goroutine and channel. 2. Python relies on threading and asyncio, which is affected by GIL, but provides multiple concurrency methods. The choice should be based on specific needs.
 What is vscode What is vscode for?
Apr 15, 2025 pm 06:45 PM
What is vscode What is vscode for?
Apr 15, 2025 pm 06:45 PM
VS Code is the full name Visual Studio Code, which is a free and open source cross-platform code editor and development environment developed by Microsoft. It supports a wide range of programming languages and provides syntax highlighting, code automatic completion, code snippets and smart prompts to improve development efficiency. Through a rich extension ecosystem, users can add extensions to specific needs and languages, such as debuggers, code formatting tools, and Git integrations. VS Code also includes an intuitive debugger that helps quickly find and resolve bugs in your code.
 Python: Automation, Scripting, and Task Management
Apr 16, 2025 am 12:14 AM
Python: Automation, Scripting, and Task Management
Apr 16, 2025 am 12:14 AM
Python excels in automation, scripting, and task management. 1) Automation: File backup is realized through standard libraries such as os and shutil. 2) Script writing: Use the psutil library to monitor system resources. 3) Task management: Use the schedule library to schedule tasks. Python's ease of use and rich library support makes it the preferred tool in these areas.
 Python vs. JavaScript: The Learning Curve and Ease of Use
Apr 16, 2025 am 12:12 AM
Python vs. JavaScript: The Learning Curve and Ease of Use
Apr 16, 2025 am 12:12 AM
Python is more suitable for beginners, with a smooth learning curve and concise syntax; JavaScript is suitable for front-end development, with a steep learning curve and flexible syntax. 1. Python syntax is intuitive and suitable for data science and back-end development. 2. JavaScript is flexible and widely used in front-end and server-side programming.
