

Performance reporting controls in Mysql Workbench

The controls listed below can be used to inspect and export performance report data (see image below) -
Export - Exports all entries in the current performance report, including all queries and values and any associated data (including column headers). Opens the Export File dialog box.
Copy Selection - Copies a single entry from the current performance report along with any related data (and column headers). System clipboard saved. A typical example
Query Copy - This function copies the SQL statement that generates the performance report. System clipboard saved.
Refresh - The performance report has been refreshed (reloaded).
Performance Report Instructions
Performance Report: Report Analysis

Display the following groupings for each report -
Memory usage
Total Memory - Displays the total memory allocated.
Highest Memory by Event - Shows the events that consume the most memory.
Highest Memory by User - Shows the users consuming the most memory
Highest Memory by Host - Shows the hosts consuming the most memory.
Highest Memory by Thread - Shows the threads consuming the most memory.
I/O Hotspot
Main File I/O Activity Report - Shows the files with the most I/O usage in bytes.
Highest I/O for files by time - Shows top I/O usage by file and latency.
Top I/O by Event Category - Displays the top I/O data usage by event category.
Top I/O Time by Event Category - Displays the top I/O time consumers by event category.
Top I/O by User/Thread - Shows the top I/O time consumers by user and thread.
High-cost SQL statements
Statement Analysis - Lists statements with various aggregate statistics.
Top 5% of statements running time - Lists all statements that are in the top 5% of average running times (in microseconds).
Using Temporary Tables - Lists all statements that use temporary tables (accessing the highest percentage of disk temporary tables, followed by in-memory temporary tables).
With Sorting - Lists all normalization statements that have completed sorting (accessed in the following order of precedence: sort_merge_passes, sort_scans, and sort_rows).
Full table scan - Lists statements that have performed a full table scan. Access query performance and the WHERE clause (or clauses). If you are not using indexes, consider adding indexes to large tables.
Errors or Warnings - Lists statements that raised errors or warnings.
Database Architecture Statistics
Schema Object Overview (High Overhead) - Displays object count per schema. Note that this report may take longer to execute for instances with a large number of objects.
Schema Index Statistics - Displays general statistics related to the index.
Mode Table Statistics - Displays general statistics related to the table.
Schema table statistics (with InnoDB buffers) - Displays schema tables with InnoDB buffer statistics.
Tables with full table scans - Finds tables accessed via full table scans, sorted by the number of rows scanned (descending order).
Unused Indexes - Displays a list of indexes that have never been used since the server started or P_S data collection began.
Waiting event time (expert)
Global Waits by Time - Lists the most important global wait events by total time, ignoring idle (which may not be huge).
Wait Time by User - Lists the most common wait events by user and their total time, ignoring idle (which is probably not huge).
Wait classes by time - Lists the most important wait classes by total time, ignoring idle (which may not be huge).
Wait classes by average time - Lists the most important wait classes by average time, ignoring idle (which may not be huge).
InnoDB Statistics
InnoDB Buffer Stats by Schema - Summarizes the output of the INFORMATION_SCHEMA.INNODB_BUFFER_PAGE table, aggregated by schema.
InnoDB Buffer Stats by Table - Summarizes output for the INFORMATION_SCHEMA.INNODB_BUFFER_PAGE table, aggregated by schema and table name.
User resource usage
Overview - Displays a summary of resource usage for each user.
I/O Statistics - Shows I/O usage per user.
Statement Statistics - This displays statement execution statistics for each user.
in conclusion
In this article, we learned about the different performance reporting controls and how to obtain them using mysql Workbench.
The above is the detailed content of Performance reporting controls in Mysql Workbench. For more information, please follow other related articles on the PHP Chinese website!

Hot AI Tools

Undresser.AI Undress
AI-powered app for creating realistic nude photos

AI Clothes Remover
Online AI tool for removing clothes from photos.

Undress AI Tool
Undress images for free

Clothoff.io
AI clothes remover

Video Face Swap
Swap faces in any video effortlessly with our completely free AI face swap tool!

Hot Article
Hot Tools

Notepad++7.3.1
Easy-to-use and free code editor

SublimeText3 Chinese version
Chinese version, very easy to use

Zend Studio 13.0.1
Powerful PHP integrated development environment

Dreamweaver CS6
Visual web development tools

SublimeText3 Mac version
God-level code editing software (SublimeText3)
Hot Topics
 1389
1389
 52
52

 When might a full table scan be faster than using an index in MySQL?
Apr 09, 2025 am 12:05 AM
When might a full table scan be faster than using an index in MySQL?
Apr 09, 2025 am 12:05 AM
Full table scanning may be faster in MySQL than using indexes. Specific cases include: 1) the data volume is small; 2) when the query returns a large amount of data; 3) when the index column is not highly selective; 4) when the complex query. By analyzing query plans, optimizing indexes, avoiding over-index and regularly maintaining tables, you can make the best choices in practical applications.
 Can I install mysql on Windows 7
Apr 08, 2025 pm 03:21 PM
Can I install mysql on Windows 7
Apr 08, 2025 pm 03:21 PM
Yes, MySQL can be installed on Windows 7, and although Microsoft has stopped supporting Windows 7, MySQL is still compatible with it. However, the following points should be noted during the installation process: Download the MySQL installer for Windows. Select the appropriate version of MySQL (community or enterprise). Select the appropriate installation directory and character set during the installation process. Set the root user password and keep it properly. Connect to the database for testing. Note the compatibility and security issues on Windows 7, and it is recommended to upgrade to a supported operating system.
 Explain InnoDB Full-Text Search capabilities.
Apr 02, 2025 pm 06:09 PM
Explain InnoDB Full-Text Search capabilities.
Apr 02, 2025 pm 06:09 PM
InnoDB's full-text search capabilities are very powerful, which can significantly improve database query efficiency and ability to process large amounts of text data. 1) InnoDB implements full-text search through inverted indexing, supporting basic and advanced search queries. 2) Use MATCH and AGAINST keywords to search, support Boolean mode and phrase search. 3) Optimization methods include using word segmentation technology, periodic rebuilding of indexes and adjusting cache size to improve performance and accuracy.
 Difference between clustered index and non-clustered index (secondary index) in InnoDB.
Apr 02, 2025 pm 06:25 PM
Difference between clustered index and non-clustered index (secondary index) in InnoDB.
Apr 02, 2025 pm 06:25 PM
The difference between clustered index and non-clustered index is: 1. Clustered index stores data rows in the index structure, which is suitable for querying by primary key and range. 2. The non-clustered index stores index key values and pointers to data rows, and is suitable for non-primary key column queries.
 MySQL: Simple Concepts for Easy Learning
Apr 10, 2025 am 09:29 AM
MySQL: Simple Concepts for Easy Learning
Apr 10, 2025 am 09:29 AM
MySQL is an open source relational database management system. 1) Create database and tables: Use the CREATEDATABASE and CREATETABLE commands. 2) Basic operations: INSERT, UPDATE, DELETE and SELECT. 3) Advanced operations: JOIN, subquery and transaction processing. 4) Debugging skills: Check syntax, data type and permissions. 5) Optimization suggestions: Use indexes, avoid SELECT* and use transactions.
 The relationship between mysql user and database
Apr 08, 2025 pm 07:15 PM
The relationship between mysql user and database
Apr 08, 2025 pm 07:15 PM
In MySQL database, the relationship between the user and the database is defined by permissions and tables. The user has a username and password to access the database. Permissions are granted through the GRANT command, while the table is created by the CREATE TABLE command. To establish a relationship between a user and a database, you need to create a database, create a user, and then grant permissions.
 Explain different types of MySQL indexes (B-Tree, Hash, Full-text, Spatial).
Apr 02, 2025 pm 07:05 PM
Explain different types of MySQL indexes (B-Tree, Hash, Full-text, Spatial).
Apr 02, 2025 pm 07:05 PM
MySQL supports four index types: B-Tree, Hash, Full-text, and Spatial. 1.B-Tree index is suitable for equal value search, range query and sorting. 2. Hash index is suitable for equal value searches, but does not support range query and sorting. 3. Full-text index is used for full-text search and is suitable for processing large amounts of text data. 4. Spatial index is used for geospatial data query and is suitable for GIS applications.
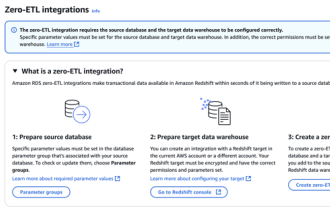 RDS MySQL integration with Redshift zero ETL
Apr 08, 2025 pm 07:06 PM
RDS MySQL integration with Redshift zero ETL
Apr 08, 2025 pm 07:06 PM
Data Integration Simplification: AmazonRDSMySQL and Redshift's zero ETL integration Efficient data integration is at the heart of a data-driven organization. Traditional ETL (extract, convert, load) processes are complex and time-consuming, especially when integrating databases (such as AmazonRDSMySQL) with data warehouses (such as Redshift). However, AWS provides zero ETL integration solutions that have completely changed this situation, providing a simplified, near-real-time solution for data migration from RDSMySQL to Redshift. This article will dive into RDSMySQL zero ETL integration with Redshift, explaining how it works and the advantages it brings to data engineers and developers.
