 Backend Development
 PHP Tutorial
 How to use PHP microservices to implement distributed service monitoring and management
How to use PHP microservices to implement distributed service monitoring and management

How to use PHP microservices to implement distributed service monitoring and management
Introduction:
With the continuous development of the Internet and the wide application of applications, the microservice architecture became a hot topic. One of the advantages of the microservice architecture is that it enables distributed service monitoring and management. This article will introduce how to use PHP to monitor and manage distributed services, and provide specific code examples.
Part 1: Overview of the importance of microservice architecture and distributed service monitoring and management
1.1 Overview of microservice architecture
Microservice architecture is to split a large application into a set of smaller Small, interconnected services. Each service has its own independently deployed and independently running container, and services interact through lightweight communication mechanisms. The advantages of microservice architecture include flexible deployment, high scalability, and flexible technology stack.
1.2 The Importance of Distributed Service Monitoring and Management
In the microservice architecture, as the number of services increases, the calling relationships between services also become complex. At the same time, different services may be developed and maintained by different teams, resulting in reduced observability of the system. Therefore, distributed service monitoring and management have become crucial. It can help us monitor the health status and performance indicators of services in real time, discover and solve problems in a timely manner, and improve the stability and reliability of the system.
Part 2: Solutions and code examples for using PHP microservices to implement distributed service monitoring and management
2.1 Solution introduction
In PHP microservices, we can use some open source Components to implement distributed service monitoring and management, such as Prometheus and Grafana. Prometheus is an open source monitoring system and provides powerful query and graphical display functions. Grafana is a powerful data visualization tool that integrates seamlessly with Prometheus.
2.2 Specific implementation steps
The following are the specific implementation steps:
(1) Install and configure Prometheus
First, we need to install and configure Prometheus. You can download the latest version from the official website and install and configure it according to the official documentation.
(2) Use Prometheus client library
In each PHP service, we need to use the Prometheus client library in order to expose the performance indicators of the service to Prometheus for collection and storage. It is recommended to use php-pm/prometheus-php as the Prometheus client library.
(3) Define indicators
In each PHP service, we need to define some indicators, such as request volume, request time, number of errors, etc. You can use Gauge, Counter, Histogram and other types provided by Prometheus to define and record indicators.
(4) Use Grafana for monitoring data visualization
Install and configure Grafana, and integrate it with Prometheus. Dashboards can be created in Grafana to display and monitor metrics for PHP microservices.
Part 3: Code Example
The following is a sample PHP microservice code:
<?php
use PrometheusCollectorRegistry;
use PrometheusStorageInMemory;
use PrometheusGauge;
use PrometheusCounter;

// 初始化CollectorRegistry
$registry = new CollectorRegistry(new InMemory());

// 定义和初始化指标
$requestCounter = new Counter($registry, 'requests_total', 'The total number of requests');
$errorCounter = new Counter($registry, 'errors_total', 'The total number of errors');
$requestDuration = new Gauge($registry, 'request_duration_seconds', 'The duration of requests');

// 处理请求的函数
function handleRequest()
{
  global $requestCounter, $errorCounter, $requestDuration;

  try {
    // 记录请求
    $requestCounter->inc();

    // 模拟处理请求
    sleep(rand(1, 5));

    // 模拟错误
    if (rand(0, 1)) {
      throw new Exception('Internal Server Error');
    }
  } catch (Exception $e) {
    // 记录错误
    $errorCounter->inc();

    // 返回错误信息
    return 'Internal Server Error';
  }

  // 记录请求时长
  $requestDuration->set(microtime(true) - $_SERVER["REQUEST_TIME_FLOAT"]);

  // 返回响应
  return 'OK';
}

// 处理请求
echo handleRequest();In the above example, we used Prometheus’s Counter and Gauge to record requests and the number of errors, as well as the length of the request. Through Grafana, we can visually display these indicators.
Conclusion:
This article introduces how to use PHP microservices to implement monitoring and management of distributed services, and provides specific code examples. By using Prometheus and Grafana, we are able to monitor and manage the performance indicators and health status of PHP microservices in real time, thereby improving the stability and reliability of the system. I hope this article can be helpful to readers in practice.
The above is the detailed content of How to use PHP microservices to implement distributed service monitoring and management. For more information, please follow other related articles on the PHP Chinese website!

Hot AI Tools

Undresser.AI Undress
AI-powered app for creating realistic nude photos

AI Clothes Remover
Online AI tool for removing clothes from photos.

Undress AI Tool
Undress images for free

Clothoff.io
AI clothes remover

AI Hentai Generator
Generate AI Hentai for free.

Hot Article

Hot Tools

Notepad++7.3.1
Easy-to-use and free code editor

SublimeText3 Chinese version
Chinese version, very easy to use

Zend Studio 13.0.1
Powerful PHP integrated development environment

Dreamweaver CS6
Visual web development tools

SublimeText3 Mac version
God-level code editing software (SublimeText3)

Hot Topics
 1377
1377
 52
52
 How to use Redis to implement distributed transaction management
Nov 07, 2023 pm 12:07 PM
How to use Redis to implement distributed transaction management Introduction: With the rapid development of the Internet, the use of distributed systems is becoming more and more widespread. In distributed systems, transaction management is an important challenge. Traditional transaction management methods are difficult to implement in distributed systems and are inefficient. Using the characteristics of Redis, we can easily implement distributed transaction management and improve the performance and reliability of the system. 1. Introduction to Redis Redis is a memory-based data storage system with efficient read and write performance and rich data
 How to implement student performance management function in Java?
Nov 04, 2023 pm 12:00 PM
How to implement student performance management function in Java? In the modern education system, student performance management is a very important task. By managing student performance, schools can better monitor students' learning progress, understand their weaknesses and strengths, and make more targeted teaching plans based on this information. In this article, we will discuss how to use Java programming language to implement student performance management functions. First, we need to determine the data structure of student grades. Typically, student grades can be represented as a
 What to do if the right-click menu management cannot be opened in Windows 10
Jan 04, 2024 pm 07:07 PM
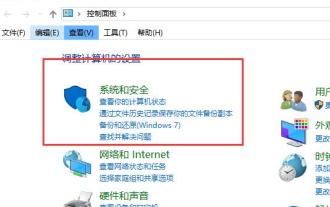
When we use the win10 system, when we use the mouse to right-click the desktop or the right-click menu, we find that the menu cannot be opened and we cannot use the computer normally. At this time, we need to restore the system to solve the problem. Win10 right-click menu management cannot be opened: 1. First open our control panel, and then click. 2. Then click under Security and Maintenance. 3. Click on the right to restore the system. 4. If it still cannot be used, check whether there is something wrong with the mouse itself. 5. If you are sure there is no problem with the mouse, press + and enter. 6. After the execution is completed, restart the computer.
 How to handle exceptions and errors in PHP microservices
Sep 25, 2023 pm 02:19 PM
How to handle exceptions and errors in PHP microservices Introduction: With the popularity of microservice architecture, more and more developers choose to use PHP to implement microservices. However, due to the complexity of microservices, exception and error handling have become an essential topic. This article will introduce how to correctly handle exceptions and errors in PHP microservices and demonstrate it through specific code examples. 1. Exception handling In PHP microservices, exception handling is essential. Exceptions are unexpected situations encountered by the program during operation, such as database connection failure, A
 How to use the Hyperf framework for cache management
Oct 21, 2023 am 08:36 AM
How to use the Hyperf framework for cache management Cache is one of the important means to improve application performance, and modern frameworks provide us with more convenient cache management tools. This article will introduce how to use the Hyperf framework for cache management and provide specific code examples. The Hyperf framework is a high-performance framework developed based on Swoole. It has a rich set of built-in components and tools, including powerful cache management functions. The Hyperf framework supports multiple cache drivers, such as Redis and Memcach.
 How to partition a disk
Feb 25, 2024 pm 03:33 PM
How to partition disk management With the continuous development of computer technology, disk management has become an indispensable part of our computer use. As an important part of disk management, disk partitioning can divide a hard disk into multiple parts, allowing us to store and manage data more flexibly. So, how to partition disk management? Below, I will give you a detailed introduction. First of all, we need to make it clear that there is not only one way to partition disks. We can flexibly choose the appropriate disk partitioning method according to different needs and purposes. often
 Analysis of solutions to transaction management problems encountered in MongoDB technology development
Oct 08, 2023 am 08:15 AM
Analysis of solutions to transaction management problems encountered in MongoDB technology development As modern applications become more and more complex and large, the transaction processing requirements for data are also getting higher and higher. As a popular NoSQL database, MongoDB has excellent performance and scalability in data management. However, MongoDB is relatively weak in data consistency and transaction management, posing challenges to developers. In this article, we will explore the transaction management issues encountered in MongoDB development and propose some solutions.
 How to add and manage users in Google Manager
Sep 02, 2024 pm 02:41 PM
How to add and manage users in Google Manager? Google Chrome supports multiple users to log in, so we don’t have to worry about logging in across devices. If we have many users, we need to add management. Some friends may not know how to operate. Don't worry, the editor has compiled a detailed step-by-step tutorial for everyone today. If you are interested, come and take a look with the editor. Detailed step-by-step tutorial instructions 1. After turning on the computer, find the installed Google Chrome icon on the desktop and double-click to open it, as shown in the picture below. 2. Click the three dots icon in the upper right corner of Google Chrome, as shown in the picture below. 3. Click the [Settings] option in the drop-down menu of Google Chrome, as shown in the figure below. 4. In the Google Chrome settings interface that opens, click [Manage ch


