

How to calculate studentized residuals in Python?

Studentized residuals are often used in regression analysis to identify potential outliers in the data. Outliers are points that differ significantly from the overall trend of the data and can have a significant impact on the fitted model. By identifying and analyzing outliers, you can better understand underlying patterns in your data and improve the accuracy of your models. In this article, we will take a closer look at studentized residuals and how to implement it in python.
What is studentized residual?
The term "studentized residuals" refers to a specific class of residuals whose standard deviation is divided by the estimate. Regression analysis residuals describe the difference between the observed value of the response variable and its expected value generated by the model. To find outliers in the data that may significantly affect the fitted model, studentized residuals were used.
The following formula is usually used to calculate studentized residuals -
studentized residual = residual / (standard deviation of residuals * (1 - hii)^(1/2))
Where "residual" refers to the difference between the observed response value and the expected response value, "residual standard deviation" refers to the estimate of the residual standard deviation, and "hii" refers to the value of each data point Leverage factor.
Calculate studentized residuals using Python
statsmodels package can be used to calculate studentized residuals in Python. As an illustration, consider the following -
grammar
OLSResults.outlier_test()
Where OLSResults refers to the linear model fitted using the ols() method of statsmodels.
df = pd.DataFrame({'rating': [95, 82, 92, 90, 97, 85, 80, 70, 82, 83],
   'points': [22, 25, 17, 19, 26, 24, 9, 19, 11, 16]})

model = ols('rating ~ points', data=df).fit()
stud_res = model.outlier_test()
Where "rating" and "score" refer to simple linear regression.
algorithm
Import numpy, pandas, Statsmodel api.
Create a data set.
Perform a simple linear regression model on the data set.
Calculate studentized residuals.
Print studentized residuals.
Example
Here is a demonstration of using the scikit-posthocs library to run Dunn's tests -
#import necessary packages and functions
import numpy as np
import pandas as pd
import statsmodels.api as sm
from statsmodels.formula.api import ols

#create dataset
df = pd.DataFrame({'rating': [95, 82, 92, 90, 97, 85, 80, 70, 82, 83], 'points': [22, 25, 17, 19, 26, 24, 9, 19, 11, 16]})
Next use the statsmodels OLS class to create a linear regression model -
#fit simple linear regression model
model = ols('rating ~ points', data=df).fit()
Using the outlier test() method, the studentized residuals of each observation in the data set can be generated in the DataFrame -
#calculate studentized residuals
stud_res = model.outlier_test()

#display studentized residuals
print(stud_res)
Output
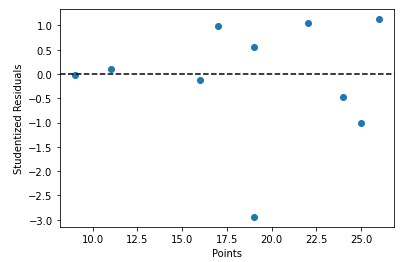
  student_resid   unadj_p   bonf(p)
0       1.048218  0.329376  1.000000
1      -1.018535  0.342328  1.000000
2       0.994962  0.352896  1.000000
3       0.548454  0.600426  1.000000
4       1.125756  0.297380  1.000000
5      -0.465472  0.655728  1.000000
6      -0.029670  0.977158  1.000000
7      -2.940743  0.021690  0.216903
8       0.100759  0.922567  1.000000
9      -0.134123  0.897080  1.000000
We can also quickly plot predictor values based on studentized residuals -
grammar
x = df['points']
y = stud_res['student_resid']

plt.scatter(x, y)
plt.axhline(y=0, color='black', linestyle='--')
plt.xlabel('Points')
plt.ylabel('Studentized Residuals')
Here we will use the matpotlib library to draw the chart with color = 'black' and lifestyle = '--'
algorithm
Import matplotlib’s pyplot library
Define predictor values
Define studentized residual
Create a scatterplot of predictors versus studentized residuals
Example
import matplotlib.pyplot as plt

#define predictor variable values and studentized residuals
x = df['points']
y = stud_res['student_resid']

#create scatterplot of predictor variable vs. studentized residuals
plt.scatter(x, y)
plt.axhline(y=0, color='black', linestyle='--')
plt.xlabel('Points')
plt.ylabel('Studentized Residuals')
Output
in conclusion
Identify and evaluate possible data outliers. Examining studentized residuals allows you to find points that deviate significantly from the overall trend of the data and explore why they affect the fitted model. Identifying significant observations Studentized residuals can be used to discover and evaluate influential data that have a significant impact on the fitted model. Look for high leverage spots. Studentized residuals can be used to identify high leverage points. Leverage is a measure of the influence of a certain point on the fitted model. Overall, using studentized residuals helps analyze and improve the performance of regression models.
The above is the detailed content of How to calculate studentized residuals in Python?. For more information, please follow other related articles on the PHP Chinese website!

Hot AI Tools

Undresser.AI Undress
AI-powered app for creating realistic nude photos

AI Clothes Remover
Online AI tool for removing clothes from photos.

Undress AI Tool
Undress images for free

Clothoff.io
AI clothes remover

AI Hentai Generator
Generate AI Hentai for free.

Hot Article
Hot Tools

Notepad++7.3.1
Easy-to-use and free code editor

SublimeText3 Chinese version
Chinese version, very easy to use

Zend Studio 13.0.1
Powerful PHP integrated development environment

Dreamweaver CS6
Visual web development tools

SublimeText3 Mac version
God-level code editing software (SublimeText3)
Hot Topics


 Residual analysis techniques in Python
Jun 10, 2023 am 08:52 AM
Residual analysis techniques in Python
Jun 10, 2023 am 08:52 AM
Python is a widely used programming language, and its powerful data analysis and visualization capabilities make it one of the preferred tools for data scientists and machine learning engineers. In these applications, residual analysis is a common technique used to evaluate model accuracy and identify any model bias. In this article, we will introduce several ways to use residual analysis techniques in Python. Understanding Residuals Before introducing residual analysis techniques in Python, let us first understand what residuals are. In statistics, the residual is the difference between the actual observed value and
 AssertionError: How to resolve Python assertion errors?
Jun 25, 2023 pm 11:07 PM
AssertionError: How to resolve Python assertion errors?
Jun 25, 2023 pm 11:07 PM
Assertions in Python are a useful tool for programmers to debug their code. It is used to verify that the internal state of the program meets expectations and raise an assertion error (AssertionError) when these conditions are false. During the development process, assertions are used during testing and debugging to check whether the status of the code matches the expected results. This article will discuss the causes, solutions, and how to correctly use assertions in your code. Cause of assertion error Assertion error pass
 How to develop a vulnerability scanner in Python
Jul 01, 2023 am 08:10 AM
How to develop a vulnerability scanner in Python
Jul 01, 2023 am 08:10 AM
Overview of how to develop a vulnerability scanner through Python In today's environment of increasing Internet security threats, vulnerability scanners have become an important tool for protecting network security. Python is a popular programming language that is concise, easy to read and powerful, suitable for developing various practical tools. This article will introduce how to use Python to develop a vulnerability scanner to provide real-time protection for your network. Step 1: Determine Scan Targets Before developing a vulnerability scanner, you need to determine what targets you want to scan. This can be your own network or anything you have permission to test
 Stratified sampling techniques in Python
Jun 10, 2023 pm 10:40 PM
Stratified sampling techniques in Python
Jun 10, 2023 pm 10:40 PM
Stratified Sampling Technique in Python Sampling is a commonly used data collection method in statistics. It can select a portion of samples from the data set for analysis to infer the characteristics of the entire data set. In the era of big data, the amount of data is huge, and using full samples for analysis is both time-consuming and not economically practical. Therefore, choosing an appropriate sampling method can improve the efficiency of data analysis. This article mainly introduces stratified sampling techniques in Python. What is stratified sampling? In sampling, stratified sampling
 How to use Python for scripting and execution in Linux
Oct 05, 2023 am 11:45 AM
How to use Python for scripting and execution in Linux
Oct 05, 2023 am 11:45 AM
How to use Python to write and execute scripts in Linux In the Linux operating system, we can use Python to write and execute various scripts. Python is a concise and powerful programming language that provides a wealth of libraries and tools to make scripting easier and more efficient. Below we will introduce the basic steps of how to use Python for script writing and execution in Linux, and provide some specific code examples to help you better understand and use it. Install Python
 Usage of sqrt() function in Python
Feb 21, 2024 pm 03:09 PM
Usage of sqrt() function in Python
Feb 21, 2024 pm 03:09 PM
Usage and code examples of the sqrt() function in Python 1. Function and introduction of the sqrt() function In Python programming, the sqrt() function is a function in the math module, and its function is to calculate the square root of a number. The square root means that a number multiplied by itself equals the square of the number, that is, x*x=n, then x is the square root of n. The sqrt() function can be used in the program to calculate the square root. 2. How to use the sqrt() function in Python, sq
 How to use support vector clustering technique in Python?
Jun 06, 2023 am 08:00 AM
How to use support vector clustering technique in Python?
Jun 06, 2023 am 08:00 AM
Support Vector Clustering (SVC) is an unsupervised learning algorithm based on Support Vector Machine (SVM), which can achieve clustering in unlabeled data sets. Python is a popular programming language with a rich set of machine learning libraries and toolkits. This article will introduce how to use support vector clustering technology in Python. 1. Principle of Support Vector Clustering SVC is based on a set of support vectors
 Python programming practice: How to use Baidu Map API to generate static map functions
Jul 30, 2023 pm 09:05 PM
Python programming practice: How to use Baidu Map API to generate static map functions
Jul 30, 2023 pm 09:05 PM
Python programming practice: How to use Baidu Map API to generate static map functions Introduction: In modern society, maps have become an indispensable part of people's lives. When working with maps, we often need to obtain a static map of a specific area for display on a web page, mobile app, or report. This article will introduce how to use the Python programming language and Baidu Map API to generate static maps, and provide relevant code examples. 1. Preparation work To realize the function of generating static maps using Baidu Map API, I
