
This paper is very interesting. It proposes two heart rate sound classification models based on the logarithmic spectrogram of the heart sound signal. We all know that spectrograms are widely used in speech recognition. This paper processes the heart sound signal as a speech signal and achieves good results
The heart sound signal is divided into frames of the same length and its logarithmic spectrogram features are extracted. The paper proposes Two deep learning models, Long Short-Term Memory (LSTM) and Convolutional Neural Network (CNN), are used to classify heartbeat sounds based on the extracted features.
Imaging diagnosis includes cardiac magnetic resonance imaging (MRI), CT scan, and myocardial perfusion imaging. The disadvantages of these technologies are also obvious: high requirements for modern machinery and professionals, and long diagnosis time.
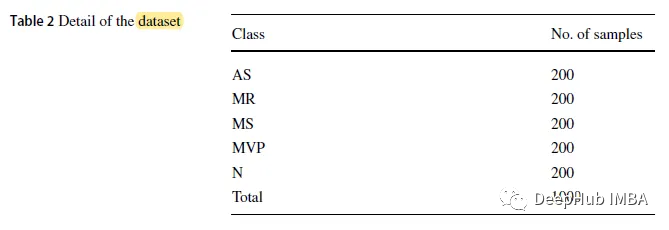
The data set used in the paper is a public data set, which contains 1000 signal samples in .wav format with a sampling frequency of 8 kHz. The data set is divided into 5 categories, including 1 normal category (N) and 4 abnormal categories: aortic stenosis (AS), mitral regurgitation (MR), mitral stenosis (MS) and mitral valve regurgitation (MR). Valve Prolapse (MVP)
Aortic stenosis (AS) is when the aortic valve is too small, narrow, or stiff. The typical murmur of aortic stenosis is a high-pitched "diamond-shaped" murmur.
Mitral regurgitation (MR) is when the heart's mitral valve fails to close properly, causing blood to flow back into the heart instead of being pumped out. When auscultating the fetal heart, the S1 sound may be very low (sometimes loud) until the murmur increases in volume by S2. A short, rumbling mid-diastolic murmur can be heard due to mitral turbulence after S3
Mitral stenosis (MS) is when the mitral valve is damaged and cannot fully open. Heart sound auscultation shows that S1 worsens in early mitral stenosis and becomes soft in severe mitral stenosis. As pulmonary hypertension develops, the S2 sound will be emphasized. Patients with pure MS have almost no left ventricular S3.
Mitral valve prolapse (MVP) is when the leaflets of the mitral valve prolapse into the left atrium during heart contraction. MVP is usually benign but may cause complications such as mitral regurgitation, endocarditis, and cord rupture. Signs include mid-systolic clicks and late-systolic murmurs (if reflux is present)
Sound signals have different lengths, so the sample rate needs to be fixed for each recorded file. To ensure that the sound signal contains at least one complete heart cycle, we trim the length. Based on the fact that an adult heartbeats 65-75 times per minute and the heartbeat cycle is about 0.8 seconds, we cut the signal samples into segments of 2.0 seconds, 1.5 seconds and 1.0 seconds
Based on Discrete Fourier Leaf transform (DFT) converts the original waveform of the heart sound signal into a logarithmic spectrogram. The DFT y(k) of the sound signal is Eq.(1), and the logarithmic spectrum s is defined as Eq.(2).
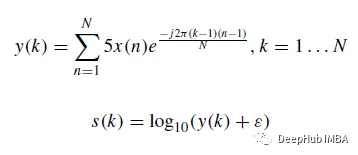
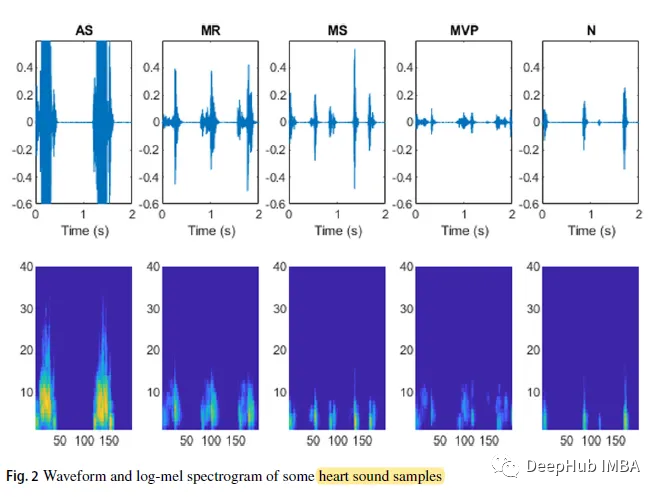
In the formula, N is the length of the vector x, and ε = 10^(- 6) is a small offset. The waveforms and logarithmic spectrograms of some heart sound samples are as follows:

The LSTM model is designed with 2 layers of direct connections, followed by 3 layers of fully connected. The third fully connected layer inputs the softmax classifier.
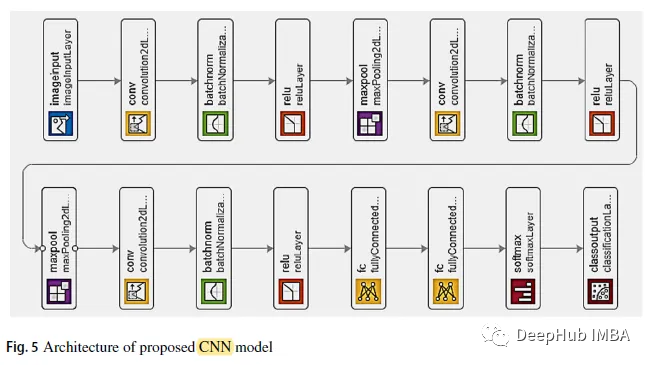
As shown in the figure above, after the first two convolutional layers are overlapping max pooling layers. The third convolutional layer is directly connected to the first fully connected layer. The second fully connected layer is fed to a softmax classifier with five class labels. Use BN and ReLU after each convolutional layer

The training set occupies 70% of the entire data set, while the test set contains the remaining part
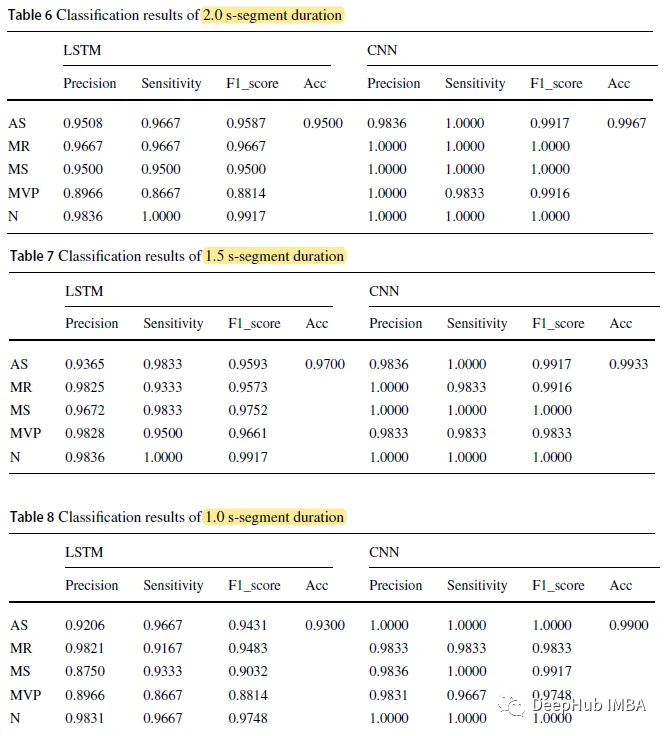
When the CNN model segment duration is 2.0 s, the highest accuracy is 0.9967; the LSTM accuracy with a segmentation time of 1.0 s is the lowest 0.9300.
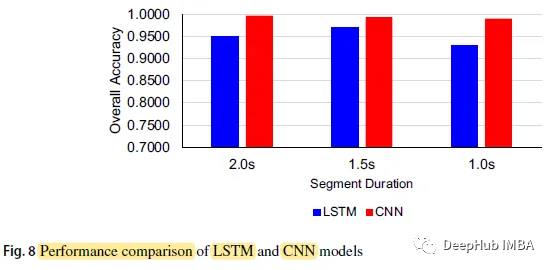
The overall accuracy of the CNN model is 0.9967, 0.9933 and 0.9900 respectively, and the segment duration is 2.0 seconds, 1.5 seconds and 1.0 seconds respectively, while the three figures of the LSTM model are 0.9500, 0.9700 and 0.9300
The prediction accuracy of the CNN model in each time period is higher than that of the LSTM model
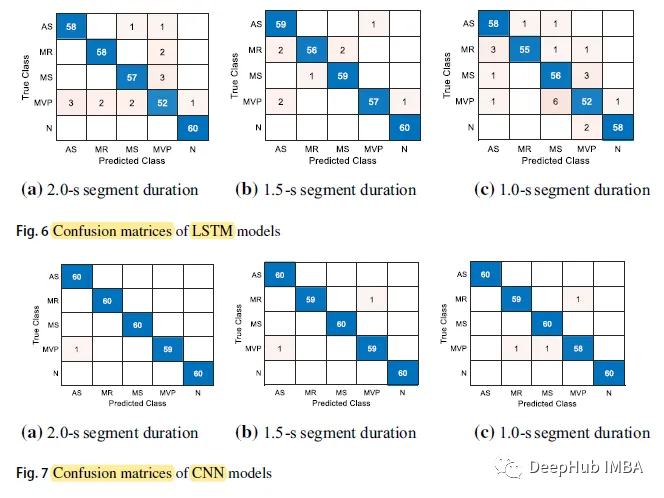
The following is the confusion matrix:
The N class (Normal) has the highest prediction accuracy, reaching 60 in 5 cases, while the MVP class has the lowest prediction accuracy among all cases.
The input time length of the LSTM model is 2.0 s, and the maximum prediction time is 9.8631 ms. The CNN model with a classification time of 1.0 s has the shortest prediction time, which is 4.2686 ms.
Compared with other SOTA, some studies have very high accuracy, but these studies only involve two categories (normal and abnormal), and Our study is divided into five categories
Compared with other studies using the same data set (0.9700), the paper study has significantly improved, with the highest accuracy of 0.9967.

The above is the detailed content of Deep learning heart sound classification based on logarithmic spectrogram. For more information, please follow other related articles on the PHP Chinese website!
 Computer screen shows no signal
 What does legacy startup mean?
 Introduction to Document in JS
 Euro-Italian Exchange official app
 How to download and save today's headline videos
 Reasons why website access prompts internal server error
 Implementation method of VUE next page function
 Bitcoin exchange
 What to do if the chm file cannot be opened


