

JavaScript function data visualization: a vivid way to display data


JavaScript Function Data Visualization: A vivid way to display data, specific code examples required
Summary: Data visualization is a method of presenting information through charts, graphs, and other visual elements Methods. In modern web development, JavaScript function data visualization has become a popular way to display data in a vivid and intuitive way. This article will introduce the concepts and benefits of JavaScript function data visualization and provide some specific code examples.
Introduction: With the rapid growth of data, data analysis and visualization have become important tools. In web development, JavaScript has become a popular choice due to its flexibility and wide support. Combined with JavaScript functions, we can easily transform data into meaningful visualization charts and graphs.
- The concept of JavaScript function data visualization
In JavaScript, we can write functions to process data and convert it into visual form. These functions can be predefined or customized and are used to generate various types of charts and graphs, such as line charts, bar charts, pie charts, etc. The purpose of functional data visualization is to intuitively display data through visual elements to help users better understand and analyze the data. - Advantages of JavaScript function data visualization
2.1 Vivid and intuitive: Displaying data through visual charts and graphs can more intuitively reflect the relationships and trends between data and help users better understand the data.
2.2 Highly interactive: Through JavaScript functions, we can add interactive functions to visual charts and graphs, such as mouse hover, click events, etc., to further enhance user experience and data analysis capabilities.
2.3 Flexible and customizable: JavaScript function data visualization provides a wealth of options and parameters, and can flexibly adjust the style, layout and data display of charts and graphs according to needs. - Specific examples of JavaScript function data visualization
The following are several common JavaScript function data visualization examples. The specific steps and codes are as follows:
3.1 Line chart
Steps :
1) Create an HTML element, such as
2) Write a JavaScript function to get the data and use a plug-in (such as Chart.js) to generate a line chart.
3) Call the function to render the line chart into HTML elements.
Code example:
// HTML
<div id="chart"></div>

// JavaScript
function drawLineChart() {
  // 获取数据
  let data = [10, 15, 20, 25, 30];

  // 创建折线图
  let chart = new Chart(document.getElementById('chart'), {
    type: 'line',
    data: {
      labels: ['Jan', 'Feb', 'Mar', 'Apr', 'May'],
      datasets: [{
        label: 'Sales',
        data: data,
        borderColor: 'blue',
        fill: false
      }]
    },
    options: {
      responsive: true,
      maintainAspectRatio: false
    }
  });
}

// 调用函数
drawLineChart();3.2 Bar chart
Steps:
1) Create an HTML element, such as
2) Write a JavaScript function to get the data and use a plug-in (such as Chart.js) to generate a histogram.
3) Call the function to render the histogram into HTML elements.
Code sample:
// HTML
<div id="chart"></div>

// JavaScript
function drawBarChart() {
  // 获取数据
  let data = [10, 15, 20, 25, 30];

  // 创建柱状图
  let chart = new Chart(document.getElementById('chart'), {
    type: 'bar',
    data: {
      labels: ['Jan', 'Feb', 'Mar', 'Apr', 'May'],
      datasets: [{
        label: 'Sales',
        data: data,
        backgroundColor: 'blue',
      }]
    },
    options: {
      responsive: true,
      maintainAspectRatio: false
    }
  });
}

// 调用函数
drawBarChart();- Conclusion
JavaScript function data visualization is a vivid and intuitive way to display data. By using JavaScript functions, we can easily transform data into charts and graphs and add interactive features to them. We hope that the code examples provided in this article can help readers better understand and apply JavaScript function data visualization technology.
The above is the detailed content of JavaScript function data visualization: a vivid way to display data. For more information, please follow other related articles on the PHP Chinese website!

Hot AI Tools

Undresser.AI Undress
AI-powered app for creating realistic nude photos

AI Clothes Remover
Online AI tool for removing clothes from photos.

Undress AI Tool
Undress images for free

Clothoff.io
AI clothes remover

AI Hentai Generator
Generate AI Hentai for free.

Hot Article
Hot Tools

Notepad++7.3.1
Easy-to-use and free code editor

SublimeText3 Chinese version
Chinese version, very easy to use

Zend Studio 13.0.1
Powerful PHP integrated development environment

Dreamweaver CS6
Visual web development tools

SublimeText3 Mac version
God-level code editing software (SublimeText3)
Hot Topics
 1386
1386
 52
52

 Use ddrescue to recover data on Linux
Mar 20, 2024 pm 01:37 PM
Use ddrescue to recover data on Linux
Mar 20, 2024 pm 01:37 PM
DDREASE is a tool for recovering data from file or block devices such as hard drives, SSDs, RAM disks, CDs, DVDs and USB storage devices. It copies data from one block device to another, leaving corrupted data blocks behind and moving only good data blocks. ddreasue is a powerful recovery tool that is fully automated as it does not require any interference during recovery operations. Additionally, thanks to the ddasue map file, it can be stopped and resumed at any time. Other key features of DDREASE are as follows: It does not overwrite recovered data but fills the gaps in case of iterative recovery. However, it can be truncated if the tool is instructed to do so explicitly. Recover data from multiple files or blocks to a single
 Open source! Beyond ZoeDepth! DepthFM: Fast and accurate monocular depth estimation!
Apr 03, 2024 pm 12:04 PM
Open source! Beyond ZoeDepth! DepthFM: Fast and accurate monocular depth estimation!
Apr 03, 2024 pm 12:04 PM
0.What does this article do? We propose DepthFM: a versatile and fast state-of-the-art generative monocular depth estimation model. In addition to traditional depth estimation tasks, DepthFM also demonstrates state-of-the-art capabilities in downstream tasks such as depth inpainting. DepthFM is efficient and can synthesize depth maps within a few inference steps. Let’s read about this work together ~ 1. Paper information title: DepthFM: FastMonocularDepthEstimationwithFlowMatching Author: MingGui, JohannesS.Fischer, UlrichPrestel, PingchuanMa, Dmytr
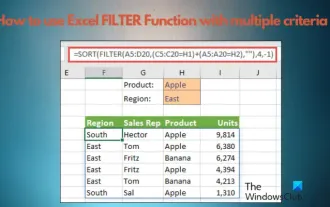 How to use Excel filter function with multiple conditions
Feb 26, 2024 am 10:19 AM
How to use Excel filter function with multiple conditions
Feb 26, 2024 am 10:19 AM
If you need to know how to use filtering with multiple criteria in Excel, the following tutorial will guide you through the steps to ensure you can filter and sort your data effectively. Excel's filtering function is very powerful and can help you extract the information you need from large amounts of data. This function can filter data according to the conditions you set and display only the parts that meet the conditions, making data management more efficient. By using the filter function, you can quickly find target data, saving time in finding and organizing data. This function can not only be applied to simple data lists, but can also be filtered based on multiple conditions to help you locate the information you need more accurately. Overall, Excel’s filtering function is a very practical
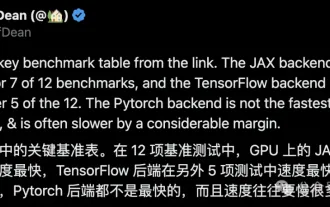 Google is ecstatic: JAX performance surpasses Pytorch and TensorFlow! It may become the fastest choice for GPU inference training
Apr 01, 2024 pm 07:46 PM
Google is ecstatic: JAX performance surpasses Pytorch and TensorFlow! It may become the fastest choice for GPU inference training
Apr 01, 2024 pm 07:46 PM
The performance of JAX, promoted by Google, has surpassed that of Pytorch and TensorFlow in recent benchmark tests, ranking first in 7 indicators. And the test was not done on the TPU with the best JAX performance. Although among developers, Pytorch is still more popular than Tensorflow. But in the future, perhaps more large models will be trained and run based on the JAX platform. Models Recently, the Keras team benchmarked three backends (TensorFlow, JAX, PyTorch) with the native PyTorch implementation and Keras2 with TensorFlow. First, they select a set of mainstream
 Slow Cellular Data Internet Speeds on iPhone: Fixes
May 03, 2024 pm 09:01 PM
Slow Cellular Data Internet Speeds on iPhone: Fixes
May 03, 2024 pm 09:01 PM
Facing lag, slow mobile data connection on iPhone? Typically, the strength of cellular internet on your phone depends on several factors such as region, cellular network type, roaming type, etc. There are some things you can do to get a faster, more reliable cellular Internet connection. Fix 1 – Force Restart iPhone Sometimes, force restarting your device just resets a lot of things, including the cellular connection. Step 1 – Just press the volume up key once and release. Next, press the Volume Down key and release it again. Step 2 – The next part of the process is to hold the button on the right side. Let the iPhone finish restarting. Enable cellular data and check network speed. Check again Fix 2 – Change data mode While 5G offers better network speeds, it works better when the signal is weaker
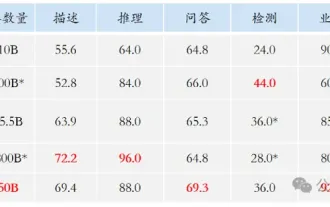 The vitality of super intelligence awakens! But with the arrival of self-updating AI, mothers no longer have to worry about data bottlenecks
Apr 29, 2024 pm 06:55 PM
The vitality of super intelligence awakens! But with the arrival of self-updating AI, mothers no longer have to worry about data bottlenecks
Apr 29, 2024 pm 06:55 PM
I cry to death. The world is madly building big models. The data on the Internet is not enough. It is not enough at all. The training model looks like "The Hunger Games", and AI researchers around the world are worrying about how to feed these data voracious eaters. This problem is particularly prominent in multi-modal tasks. At a time when nothing could be done, a start-up team from the Department of Renmin University of China used its own new model to become the first in China to make "model-generated data feed itself" a reality. Moreover, it is a two-pronged approach on the understanding side and the generation side. Both sides can generate high-quality, multi-modal new data and provide data feedback to the model itself. What is a model? Awaker 1.0, a large multi-modal model that just appeared on the Zhongguancun Forum. Who is the team? Sophon engine. Founded by Gao Yizhao, a doctoral student at Renmin University’s Hillhouse School of Artificial Intelligence.
 Tesla robots work in factories, Musk: The degree of freedom of hands will reach 22 this year!
May 06, 2024 pm 04:13 PM
Tesla robots work in factories, Musk: The degree of freedom of hands will reach 22 this year!
May 06, 2024 pm 04:13 PM
The latest video of Tesla's robot Optimus is released, and it can already work in the factory. At normal speed, it sorts batteries (Tesla's 4680 batteries) like this: The official also released what it looks like at 20x speed - on a small "workstation", picking and picking and picking: This time it is released One of the highlights of the video is that Optimus completes this work in the factory, completely autonomously, without human intervention throughout the process. And from the perspective of Optimus, it can also pick up and place the crooked battery, focusing on automatic error correction: Regarding Optimus's hand, NVIDIA scientist Jim Fan gave a high evaluation: Optimus's hand is the world's five-fingered robot. One of the most dexterous. Its hands are not only tactile
 The first robot to autonomously complete human tasks appears, with five fingers that are flexible and fast, and large models support virtual space training
Mar 11, 2024 pm 12:10 PM
The first robot to autonomously complete human tasks appears, with five fingers that are flexible and fast, and large models support virtual space training
Mar 11, 2024 pm 12:10 PM
This week, FigureAI, a robotics company invested by OpenAI, Microsoft, Bezos, and Nvidia, announced that it has received nearly $700 million in financing and plans to develop a humanoid robot that can walk independently within the next year. And Tesla’s Optimus Prime has repeatedly received good news. No one doubts that this year will be the year when humanoid robots explode. SanctuaryAI, a Canadian-based robotics company, recently released a new humanoid robot, Phoenix. Officials claim that it can complete many tasks autonomously at the same speed as humans. Pheonix, the world's first robot that can autonomously complete tasks at human speeds, can gently grab, move and elegantly place each object to its left and right sides. It can autonomously identify objects
