

How to use subplot in matlab

subplot is used in matlab to create multiple subplots in the same figure. You can draw a different graph in each subplot by specifying the number of rows, columns, and current plot position of the subplot.

In MATLAB, the subplot function is used to create multiple subplots in the same figure. Its basic syntax is:
subplot(m,n,p)
Among them, m and n represent the number of rows and columns of the subgraph respectively, and p represents the position of the current subgraph. The subplot function divides the current figure into a matrix of m rows and n columns, and sets the current drawing position to the p-th subfigure. The following will introduce in detail how to use the subplot function.
First, we need to create a figure window, which can be created using the figure function:
figure
Then, we can divide the subplots through the subplot function. For example, if we want to create a subgraph matrix with 2 rows and 2 columns, and set the current drawing position to the 1st subgraph, we can use the following code:
subplot(2,2,1)
Next, we can Draw the graph in the figure. For example, we can use the plot function to draw a simple curve:
x = 0:0.1:2*pi;
y = sin(x);
plot(x,y)
Then, we can continue to create other subplots. For example, we can set the current drawing position to the 2nd subgraph and draw another curve in it:
subplot(2,2,2)
plot(x,cos(x))
Similarly, we can draw different graphics in other subgraphs. For example, we can set the current drawing position to the 3rd subplot and draw a scatter plot in it:
subplot(2,2,3)
x = rand(1,100);
y = rand(1,100);
scatter(x,y)
Finally, we can set the current drawing position to the 4th subplot and draw in it A histogram:
subplot(2,2,4)
x = 1:5;
y = [3 5 2 6 1];
bar(x,y)
Through these steps, we can create multiple subgraphs in the same figure window and draw different graphics in each subgraph. It is worth noting that the parameters m, n and p of the subplot function must satisfy p<=m*n, otherwise an error will occur. In addition, if we only want to draw a subplot, we can use the plot function directly instead of using the subplot function.
In short, the subplot function is a function in MATLAB used to create multiple subplots in the same figure. We can draw different graphics in each subplot by specifying the number of rows, columns, and current plot position of the subplot.
The above is the detailed content of How to use subplot in matlab. For more information, please follow other related articles on the PHP Chinese website!

Hot AI Tools

Undresser.AI Undress
AI-powered app for creating realistic nude photos

AI Clothes Remover
Online AI tool for removing clothes from photos.

Undress AI Tool
Undress images for free

Clothoff.io
AI clothes remover

Video Face Swap
Swap faces in any video effortlessly with our completely free AI face swap tool!

Hot Article
Hot Tools

Notepad++7.3.1
Easy-to-use and free code editor

SublimeText3 Chinese version
Chinese version, very easy to use

Zend Studio 13.0.1
Powerful PHP integrated development environment

Dreamweaver CS6
Visual web development tools

SublimeText3 Mac version
God-level code editing software (SublimeText3)
Hot Topics
 1386
1386
 52
52

 What are the Java operations that come with Matlab?
May 03, 2023 pm 04:07 PM
What are the Java operations that come with Matlab?
May 03, 2023 pm 04:07 PM
1. Get the full-screen position of the mouse. The upper left corner of the screen is the coordinate origin. To get the mouse position and get the mouse pixel color, it is recommended to use it in conjunction with a while loop or timer function: importjava.awt.MouseInfo;mousepoint=MouseInfo.getPointerInfo().getLocation();mousepoint =[mousepoint.x,mousepoint.y]2 Get the current clipboard content importjava.awt.Toolkitimportjava.awt.datatransfer.DataFlavorclip=
 The difference between scilab and matlab
Dec 11, 2023 am 11:13 AM
The difference between scilab and matlab
Dec 11, 2023 am 11:13 AM
The difference between scilab and matlab: 1. Annotation symbols; 2. Representation of preset variables; 3. Usage of operators; 4. Definition and calling of matrices; 5. Editing and execution of programs; 6. Data types; 7. Functions Library; 8. Graphical interface; 9. Community support and ecosystem; 10. Cross-platform compatibility; 11. Price. Detailed introduction: 1. Comment symbols. In Scilab, comments are guided by "//", while in Matlab, comments are guided by "%"; 2. Representation of preset variables in Scilab, etc.
 How to use fprintf in matlab
Sep 28, 2023 pm 04:28 PM
How to use fprintf in matlab
Sep 28, 2023 pm 04:28 PM
fprintf is a function in MATLAB used to format output. The basic syntax of fprintf is "fprintf(fileID, format, A)", where fileID is an identifier used to specify the file to be written. If you want to write data to the command window, you can use 1 as fileID The value of format is a string used to specify the output format, and A is the data to be output.
 How to modify coordinates in matlab
Dec 15, 2023 am 10:40 AM
How to modify coordinates in matlab
Dec 15, 2023 am 10:40 AM
In MATLAB, you can use the "set" function to modify the axis properties of a graph. Detailed introduction: 1. Modify the range of the coordinate axis: set(gca, 'XLim', [0 10], 'YLim', [0 10]); 2. Modify the label of the coordinate axis: set(gca, 'XLabel', 'My X-axis', 'YLabel', 'My Y-axis'); 3. Modify the scale of the coordinate axis, etc.
 How to run m-file in matlab - Tutorial on running m-file in matlab
Mar 04, 2024 pm 02:13 PM
How to run m-file in matlab - Tutorial on running m-file in matlab
Mar 04, 2024 pm 02:13 PM
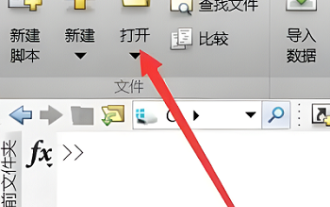
Do you know how to run m files in matlab? Below, the editor will bring you a tutorial on how to run m files in matlab. I hope it will be helpful to you. Let’s learn with the editor! 1. First open the matlab software and select the upper left "Open" the corner, as shown in the picture below. 2. Then select the m file to be run and open it, as shown in the figure below. 3. Press F5 in the window to run the program, as shown in the figure below. 4. We can view the running results in the command line window and workspace, as shown in the figure below. 5. You can also run the file by clicking "Run" directly, as shown in the figure below. 6. Finally, you can view the running results of the m file in the command line window and workspace, as shown in the figure below. The above is the matlab method that the editor brought to you
 How to stop running commands in matlab
Jan 14, 2021 am 11:46 AM
How to stop running commands in matlab
Jan 14, 2021 am 11:46 AM
How to stop running commands in matlab: 1. Select a program and click the run icon; 2. Click the pause icon above to temporarily stop the program from running; 3. Click to exit debugging to force stop the busy program.
 How would you convert MATLAB code to Python code?
Aug 19, 2023 pm 10:53 PM
How would you convert MATLAB code to Python code?
Aug 19, 2023 pm 10:53 PM
MATLAB is a popular programming language widely used in engineering and scientific fields, but Python is quickly becoming the language of choice for many programmers due to its flexibility and adaptability. If you want to convert MATLAB code to Python code, it may feel very difficult at first. However, with the right knowledge and approach, you can make the process much easier. Here are some steps to help you convert MATLAB code to Python: Step 1: Familiarize yourself with Python syntax Python and MATLAB have unique syntax, so you need to be familiar with Python syntax before you start converting your code. Spend some time understanding the basics of Python syntax, including variables and data types
 How to use matlab griddata function
Dec 15, 2023 am 10:11 AM
How to use matlab griddata function
Dec 15, 2023 am 10:11 AM
The griddata function is used to interpolate the corresponding Z value at a given (X, Y) coordinate, thereby gridding a set of three-dimensional data (x, y, z). Its usage is "griddata(x, y, z, xi, yi, method)".
