

ECharts Getting Started Guide: How to Use ECharts

ECharts Getting Started Guide: How to use ECharts, specific code examples are required
ECharts is a JavaScript-based data visualization library. By using ECharts, users can easily display Various charts, such as line charts, bar charts, pie charts, etc. This article will introduce you to how to use ECharts and provide detailed code examples.
- Installing ECharts
To use ECharts, you first need to install it. You can download ECharts from the ECharts official website https://echarts.apache.org/zh/index.html, or install it using npm. If you choose to use npm, you can install it with the following command:
1 |
|
- Create a new ECharts page
Before creating a new ECharts page, you need an HTML page to host it ECharts. In the HTML, you need to include ECharts' JavaScript file. You can import it via:
1 |
|
Once you have imported the ECharts JavaScript file, you can start creating your first ECharts instance. We recommend that you add a div element to the page before doing this so that you can render the chart into the page. You can add a div element in HTML like this:
1 |
|
- Create your first ECharts chart
The basics needed to create ECharts in HTML elements, next you need to write the code to implement your ECharts chart. The following is a very simple example of a line chart:
1 2 3 4 5 6 7 8 9 10 11 12 13 14 15 16 17 18 19 20 21 22 23 24 25 |
|
Here, we first initialize a new ECharts instance by using ECharts' init function, and save this instance to In a variable myChart. We introduced some configuration items and data, including a title, a tooltip, a legend, an x-axis, a y-axis, and a data series. In this example, we use a line chart data series. Finally, we apply these configuration items to our ECharts chart by calling the setOption method.
- Create other types of charts
In addition to line charts, ECharts also supports many other types of charts, such as bar charts, pie charts, scatter charts, radar charts, etc. wait. Below is sample code for a bar chart and a pie chart:
Bar chart:
1 2 3 4 5 6 7 8 9 10 11 12 13 14 15 16 17 18 19 20 21 22 23 24 25 |
|
Pie chart:
1 2 3 4 5 6 7 8 9 10 11 12 13 14 15 16 17 18 19 20 21 22 23 24 25 26 27 28 29 30 31 32 33 34 35 36 37 38 39 40 41 42 43 44 45 46 47 48 49 50 51 52 53 54 55 |
|
- Summary
Creating charts with ECharts is a relatively simple task, as long as you have some basic JavaScript knowledge. In this article, we provide you with an introductory tutorial that will help you get started with ECharts. If you need more information and code examples, you can visit the ECharts official website https://echarts.apache.org/zh/index.html.
The above is the detailed content of ECharts Getting Started Guide: How to Use ECharts. For more information, please follow other related articles on the PHP Chinese website!

Hot AI Tools

Undresser.AI Undress
AI-powered app for creating realistic nude photos

AI Clothes Remover
Online AI tool for removing clothes from photos.

Undress AI Tool
Undress images for free

Clothoff.io
AI clothes remover

Video Face Swap
Swap faces in any video effortlessly with our completely free AI face swap tool!
Hot Article
Hot Tools

Notepad++7.3.1
Easy-to-use and free code editor

SublimeText3 Chinese version
Chinese version, very easy to use

Zend Studio 13.0.1
Powerful PHP integrated development environment

Dreamweaver CS6
Visual web development tools

SublimeText3 Mac version
God-level code editing software (SublimeText3)
Hot Topics
 1393
1393
 52
37
110
52
37
110

 A Diffusion Model Tutorial Worth Your Time, from Purdue University
Apr 07, 2024 am 09:01 AM
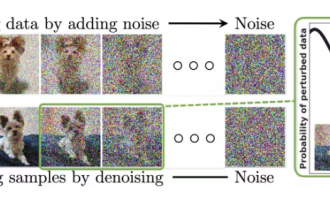
A Diffusion Model Tutorial Worth Your Time, from Purdue University
Apr 07, 2024 am 09:01 AM
Diffusion can not only imitate better, but also "create". The diffusion model (DiffusionModel) is an image generation model. Compared with the well-known algorithms such as GAN and VAE in the field of AI, the diffusion model takes a different approach. Its main idea is a process of first adding noise to the image and then gradually denoising it. How to denoise and restore the original image is the core part of the algorithm. The final algorithm is able to generate an image from a random noisy image. In recent years, the phenomenal growth of generative AI has enabled many exciting applications in text-to-image generation, video generation, and more. The basic principle behind these generative tools is the concept of diffusion, a special sampling mechanism that overcomes the limitations of previous methods.
 What software is crystaldiskmark? -How to use crystaldiskmark?
Mar 18, 2024 pm 02:58 PM
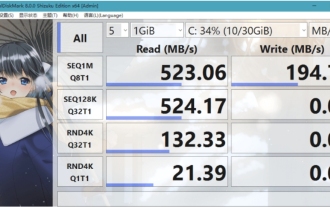
What software is crystaldiskmark? -How to use crystaldiskmark?
Mar 18, 2024 pm 02:58 PM
CrystalDiskMark is a small HDD benchmark tool for hard drives that quickly measures sequential and random read/write speeds. Next, let the editor introduce CrystalDiskMark to you and how to use crystaldiskmark~ 1. Introduction to CrystalDiskMark CrystalDiskMark is a widely used disk performance testing tool used to evaluate the read and write speed and performance of mechanical hard drives and solid-state drives (SSD). Random I/O performance. It is a free Windows application and provides a user-friendly interface and various test modes to evaluate different aspects of hard drive performance and is widely used in hardware reviews
 Generate PPT with one click! Kimi: Let the 'PPT migrant workers' become popular first
Aug 01, 2024 pm 03:28 PM
Generate PPT with one click! Kimi: Let the 'PPT migrant workers' become popular first
Aug 01, 2024 pm 03:28 PM
Kimi: In just one sentence, in just ten seconds, a PPT will be ready. PPT is so annoying! To hold a meeting, you need to have a PPT; to write a weekly report, you need to have a PPT; to make an investment, you need to show a PPT; even when you accuse someone of cheating, you have to send a PPT. College is more like studying a PPT major. You watch PPT in class and do PPT after class. Perhaps, when Dennis Austin invented PPT 37 years ago, he did not expect that one day PPT would become so widespread. Talking about our hard experience of making PPT brings tears to our eyes. "It took three months to make a PPT of more than 20 pages, and I revised it dozens of times. I felt like vomiting when I saw the PPT." "At my peak, I did five PPTs a day, and even my breathing was PPT." If you have an impromptu meeting, you should do it
 How to download foobar2000? -How to use foobar2000
Mar 18, 2024 am 10:58 AM
How to download foobar2000? -How to use foobar2000
Mar 18, 2024 am 10:58 AM
foobar2000 is a software that can listen to music resources at any time. It brings you all kinds of music with lossless sound quality. The enhanced version of the music player allows you to get a more comprehensive and comfortable music experience. Its design concept is to play the advanced audio on the computer The device is transplanted to mobile phones to provide a more convenient and efficient music playback experience. The interface design is simple, clear and easy to use. It adopts a minimalist design style without too many decorations and cumbersome operations to get started quickly. It also supports a variety of skins and Theme, personalize settings according to your own preferences, and create an exclusive music player that supports the playback of multiple audio formats. It also supports the audio gain function to adjust the volume according to your own hearing conditions to avoid hearing damage caused by excessive volume. Next, let me help you
 How to use NetEase Mailbox Master
Mar 27, 2024 pm 05:32 PM
How to use NetEase Mailbox Master
Mar 27, 2024 pm 05:32 PM
NetEase Mailbox, as an email address widely used by Chinese netizens, has always won the trust of users with its stable and efficient services. NetEase Mailbox Master is an email software specially created for mobile phone users. It greatly simplifies the process of sending and receiving emails and makes our email processing more convenient. So how to use NetEase Mailbox Master, and what specific functions it has. Below, the editor of this site will give you a detailed introduction, hoping to help you! First, you can search and download the NetEase Mailbox Master app in the mobile app store. Search for "NetEase Mailbox Master" in App Store or Baidu Mobile Assistant, and then follow the prompts to install it. After the download and installation is completed, we open the NetEase email account and log in. The login interface is as shown below
 How to use Baidu Netdisk app
Mar 27, 2024 pm 06:46 PM
How to use Baidu Netdisk app
Mar 27, 2024 pm 06:46 PM
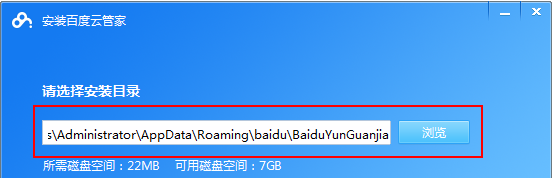
Cloud storage has become an indispensable part of our daily life and work nowadays. As one of the leading cloud storage services in China, Baidu Netdisk has won the favor of a large number of users with its powerful storage functions, efficient transmission speed and convenient operation experience. And whether you want to back up important files, share information, watch videos online, or listen to music, Baidu Cloud Disk can meet your needs. However, many users may not understand the specific use method of Baidu Netdisk app, so this tutorial will introduce in detail how to use Baidu Netdisk app. Users who are still confused can follow this article to learn more. ! How to use Baidu Cloud Network Disk: 1. Installation First, when downloading and installing Baidu Cloud software, please select the custom installation option.
 BTCC tutorial: How to bind and use MetaMask wallet on BTCC exchange?
Apr 26, 2024 am 09:40 AM
BTCC tutorial: How to bind and use MetaMask wallet on BTCC exchange?
Apr 26, 2024 am 09:40 AM
MetaMask (also called Little Fox Wallet in Chinese) is a free and well-received encryption wallet software. Currently, BTCC supports binding to the MetaMask wallet. After binding, you can use the MetaMask wallet to quickly log in, store value, buy coins, etc., and you can also get 20 USDT trial bonus for the first time binding. In the BTCCMetaMask wallet tutorial, we will introduce in detail how to register and use MetaMask, and how to bind and use the Little Fox wallet in BTCC. What is MetaMask wallet? With over 30 million users, MetaMask Little Fox Wallet is one of the most popular cryptocurrency wallets today. It is free to use and can be installed on the network as an extension
 All CVPR 2024 awards announced! Nearly 10,000 people attended the conference offline, and a Chinese researcher from Google won the best paper award
Jun 20, 2024 pm 05:43 PM
All CVPR 2024 awards announced! Nearly 10,000 people attended the conference offline, and a Chinese researcher from Google won the best paper award
Jun 20, 2024 pm 05:43 PM
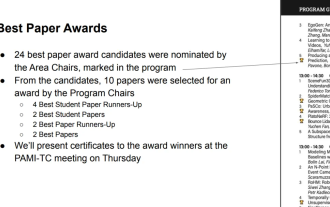
In the early morning of June 20th, Beijing time, CVPR2024, the top international computer vision conference held in Seattle, officially announced the best paper and other awards. This year, a total of 10 papers won awards, including 2 best papers and 2 best student papers. In addition, there were 2 best paper nominations and 4 best student paper nominations. The top conference in the field of computer vision (CV) is CVPR, which attracts a large number of research institutions and universities every year. According to statistics, a total of 11,532 papers were submitted this year, and 2,719 were accepted, with an acceptance rate of 23.6%. According to Georgia Institute of Technology’s statistical analysis of CVPR2024 data, from the perspective of research topics, the largest number of papers is image and video synthesis and generation (Imageandvideosyn
